Buletin Ilmiah Sarjana Teknik Elektro ISSN: 2685-9572
Design of a Soil Erosion Warning System in Watersheds Based on Arduino Uno
M. Ulud Risaldi, Ahmad Raditya Cahya Baswara
Department of Electrical Engineering, Universitas Ahmad Dahlan, Yogyakarta, Indonesia
ARTICLE INFORMATION |
| ABSTRACT |
Article History: Submitted 20 February 2023 Revised 30 March 2023 Accepted 03 April 2023
|
| 
Tropical climate conditions with two seasons, namely rainy and hot in Indonesia and coupled with relatively diverse surface and rock topography conditions, have the potential for natural disasters, one of which is erosion in watersheds. Making the system using the Arduino Uno microcontroller, SIM-800L V2 Module, Piezoelectric Sensor, Soil Moisture Sensor, Buzzer and LCD. The designed system will be able to display information on the spot, and can send via SMS. In pre-erosion conditions, there are two variables used, namely soil moisture and soil vibration. As for post-erosion, it only takes the soil vibration variable. The limit value of vibration in pre-erosion conditions is 31%. Pre-erosion data is divided into 3 statuses, namely BEWARE at humidity values of 31-70% and vibration values of 5-15%, DANGER status with humidity values of 71-100% or vibration values of 16-30%, and other than that they are included in the SAFE category. Whereas in post-erosion 3 categories are LIGHT EROSION at vibration values of 31-50%, MODERATE EROSION 51-70% and SEVERE EROSION 71-100%. |
Keywords: Erosion; Arduino Uno; Soil Moisture Sensor; Piezoeletrik Sensor; SIM-800L V2 |
Corresponding Author: Ahmad Raditya Cahya Baswara, Department of Electrical Engineering, Universitas Ahmad Dahlan, Bantul, Yogyakarta, Indonesia. Email: ahmadradityac@ee.uad.ac.id |
This work is licensed under a Creative Commons Attribution-Share Alike 4.0 
|
Document Citation: M. U. Risaldi and A. R. C. Baswara, “Design of a Soil Erosion Warning System in Watersheds Based on Arduino Uno,” Buletin Ilmiah Sarjana Teknik Elektro, vol. 5, no. 1, pp. 167-179, 2023, DOI: 10.12928/biste.v5i1.7867. |
- INTRODUCTION
Indonesia's geographical conditions have very hot characteristics, being located at the equator in a tropical marine climate and having high rainfall, so that Indonesia is a disaster-prone country in Southeast Asia [1]. Based on data from the United Nations Agency for the International Strategy for Disaster Risk Reduction (UNISDR) Indonesia is an archipelagic country located at the confluence of four tectonic plates and is nicknamed the ring of fire [2]. Coupled with the shape of the Indonesian state which is archipelago with many unified land and water areas, there will be the potential for various hydrometeorological disasters to occur [3]. Several hydrometeorological disasters such as floods, landslides, and droughts. Moreover, when it is associated with increased human activity, environmental damage tends to get worse and triggers an increase in the number and intensity of hydrometeorological disasters (floods, landslides and droughts) that occur one after another in many areas in Indonesia [4].
One of the frequent hygrometeorological disasters is landslides which are events where one block (mass) slides down against another mass [5][6]. Landslide disaster is one of the disasters that often occurs in Indonesia, especially in hilly and mountainous areas. Landslide disasters will result in downward movement, landslides usually occur in hilly areas in the wet tropics and cause various losses [7]. One of the disasters that have the same characteristics as landslides is soil erosion. The difference between soil erosion and a landslide is the volume of the block (mass) or soil that slides down. In general, landslides have a larger volume when compared to erosion that occurs with a relatively small volume and lasts for some time. Some of the causes of soil erosion include water content in the soil, rain, topography, and activity in the soil.
Soil erosion itself in its sense is the spread of soil into small parts so that it can move to another place by flow [8]. Soil erosion also affects the hydrological cycle, land cover degradation, and loss of biodiversity [9]. Areas with high erosion potential are land-water interfaces, such as watersheds (DAS). One of the causes of erosion is the conversion of watershed land to logging and building construction and excessive exploitation of productive land. Incorrect agricultural management also causes damage to land conditions in the watershed area which is of increasing concern so that it can cause erosion. There are also natural factors that cause erosion such as soil movement, soil characteristics, and rainfall [10].
A watershed is a land area that has topographical boundaries (ridges) that function to receive and store rainwater, nutrients, and sediment, tributaries of a watershed function to collect, store, and drain water from rainfall into lakes or lakes [11][12]. The area within the island of Java alone already has many watersheds which are in critical condition [13]. With conditions that have the potential for erosion, coupled with problems with slope conditions, land use and poor land cover conditions. Knowledge of watershed management principles is one of the preventive measures to prevent soil erosion. The problem is that the landslide early warning system in Indonesia is still very minimal. Therefore a system is needed to avoid losses [14].
With the existence of an early detection system for this erosion disaster, losses can be anticipated and prevented from occurring [15]. So that the system can be one of the efforts to mitigate the impact of erosion that occurs in watersheds (DAS). Mitigation efforts will reduce losses that occur.
Preventive efforts made by utilizing technology and electronic components related to needs. Utilization of the Soil Moiture Sensor will monitor the level of water content in the soil as a variable [16]. There is also a piezoelectric sensor to detect ground vibrations as a second variable [17]. One of the efficiencies of using technology is remote monitoring by utilizing the Short Message Service (SMS) system.
- METHODS
This research is devoted to the manufacture of soil erosion detection devices in the watershed research area (DAS) to be able to minimize and anticipate erosion which has an impact on the quantity of soil in the watershed. By using LCD and SMS outputs for reporting soil conditions and the possibility of erosion occurring which is useful for detecting vibration values and soil moisture values in its implementation [18]. Data collection in this study was limited to making prototypes by representing the watershed conditions.
- System Planning
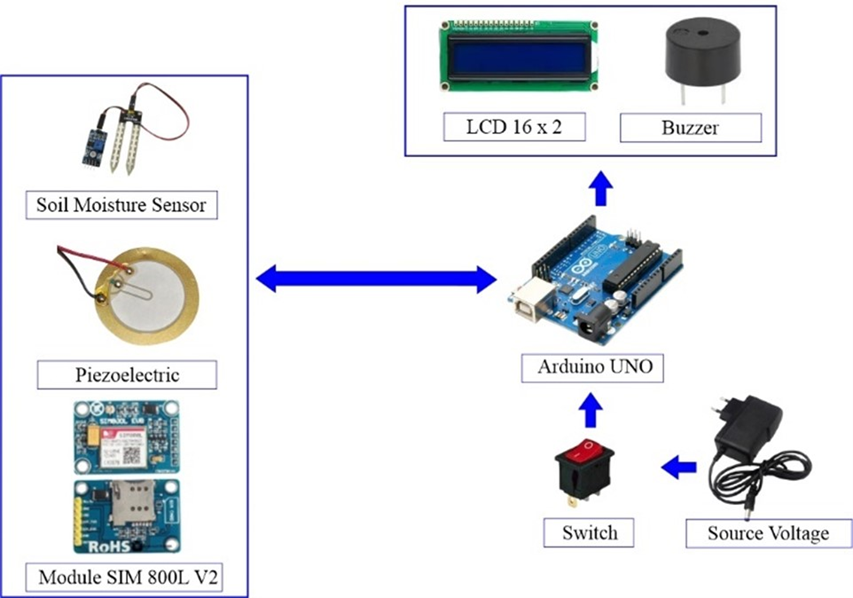
The system design is an overview of the input and output relationships between components and other components. Arduino will get an input voltage that can be adjusted via a switch, then Arduino will provide input voltage to the soil moisture sensor and piezoelectric sensor [19]. From the moisture sensor, soil moisture data will be obtained which will be processed again in Arduino to find out indications of soil erosion based on parameters [20][21]. While the piezoelectric will measure if there is movement and stretching of the soil which will be reprocessed in Arduino as the second parameter to determine the level of soil erosion. The design of a soil erosion warning system in a watershed can be seen in Figure 1.
The system design in Figure 1, the components that function as output are the Liquid Crystal Display (LCD) 16 x 2 and the buzzer. The LCD specifically functions as information output in written form which can be seen on the spot and a buzzer as a status indication in the form of sound output. In addition, the output can be monitored remotely via Short Message Service (SMS) using the SIM800L V2 module [22].
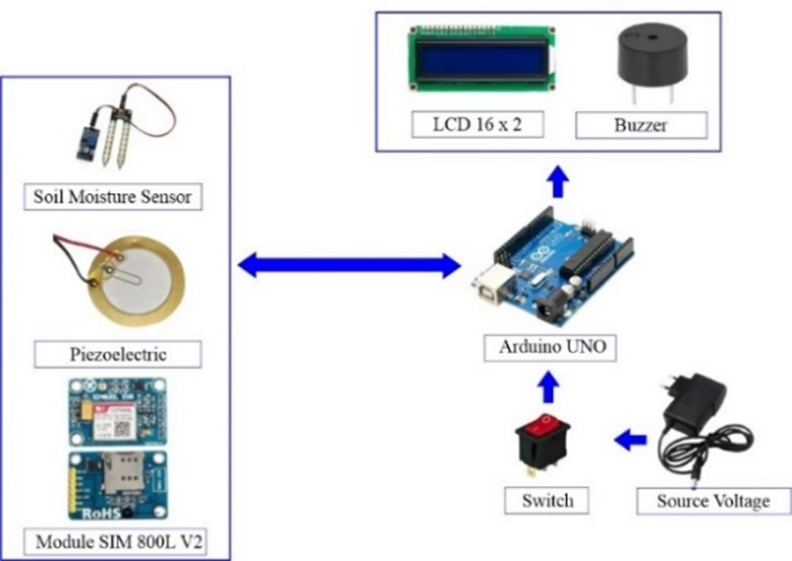
Figure 1. System Planning
- System Circuit
In the system created, it is necessary to describe the system circuit for the purpose of connecting between components using cables via pins found on each component or module. The schematic display of the system can be seen in Figure 2.
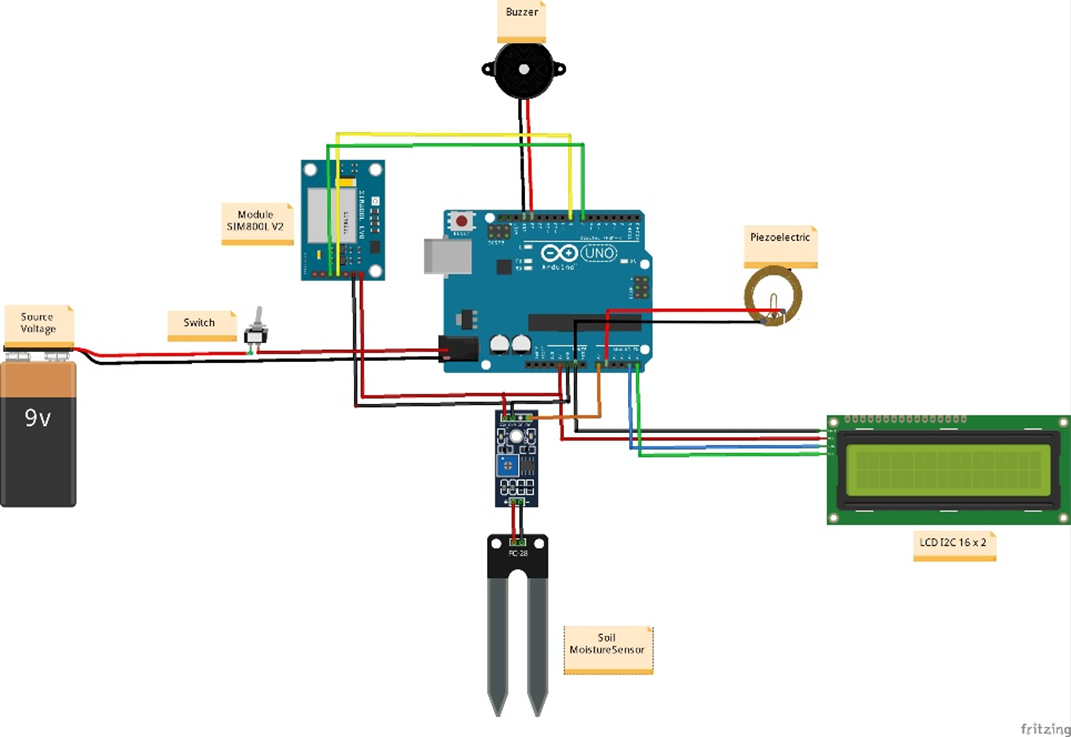
Figure 2. System circuit
Making an initial design will help when making the system and minimize errors that can occur. The connections between components and Arduino Uno can be briefly seen in Table 1.
Table 1. Component connections with Arduino Uno
Component | Arduino Uno |
Piezoelectric Sensors | The negative on the piezoelectric will be connected to GND and the positive will be connected to A1 |
Soil Moisture Sensors | The negative on the piezoelectric will be connected to GND, VCC to 5 V, and the positive will be connected to A0 |
LCD I2C | VCC is connected to 5 V, GND to GND, SCL will be connected to A5, and SDA to A4 |
SIM 800L V2 | V2 will use RX and TX communicants connected to pins 11 and 10 on the Arduino Uno. |
Buzzer | Using pin 13 as input on Arduino Uno |
- System Flow Chart
The software in this study was designed through several stages, namely starting from making a flow chart or flowchart which is an explanation of the program in the Arduino IDE software using C language. The flow of all these processes will be described in a flowchart which includes the input process, output process and initialization of sensor readings. In this study, two flow charts were made with each for pre-erosion and post-erosion conditions. The pre-erosion flow chart can be seen in Figure 3.
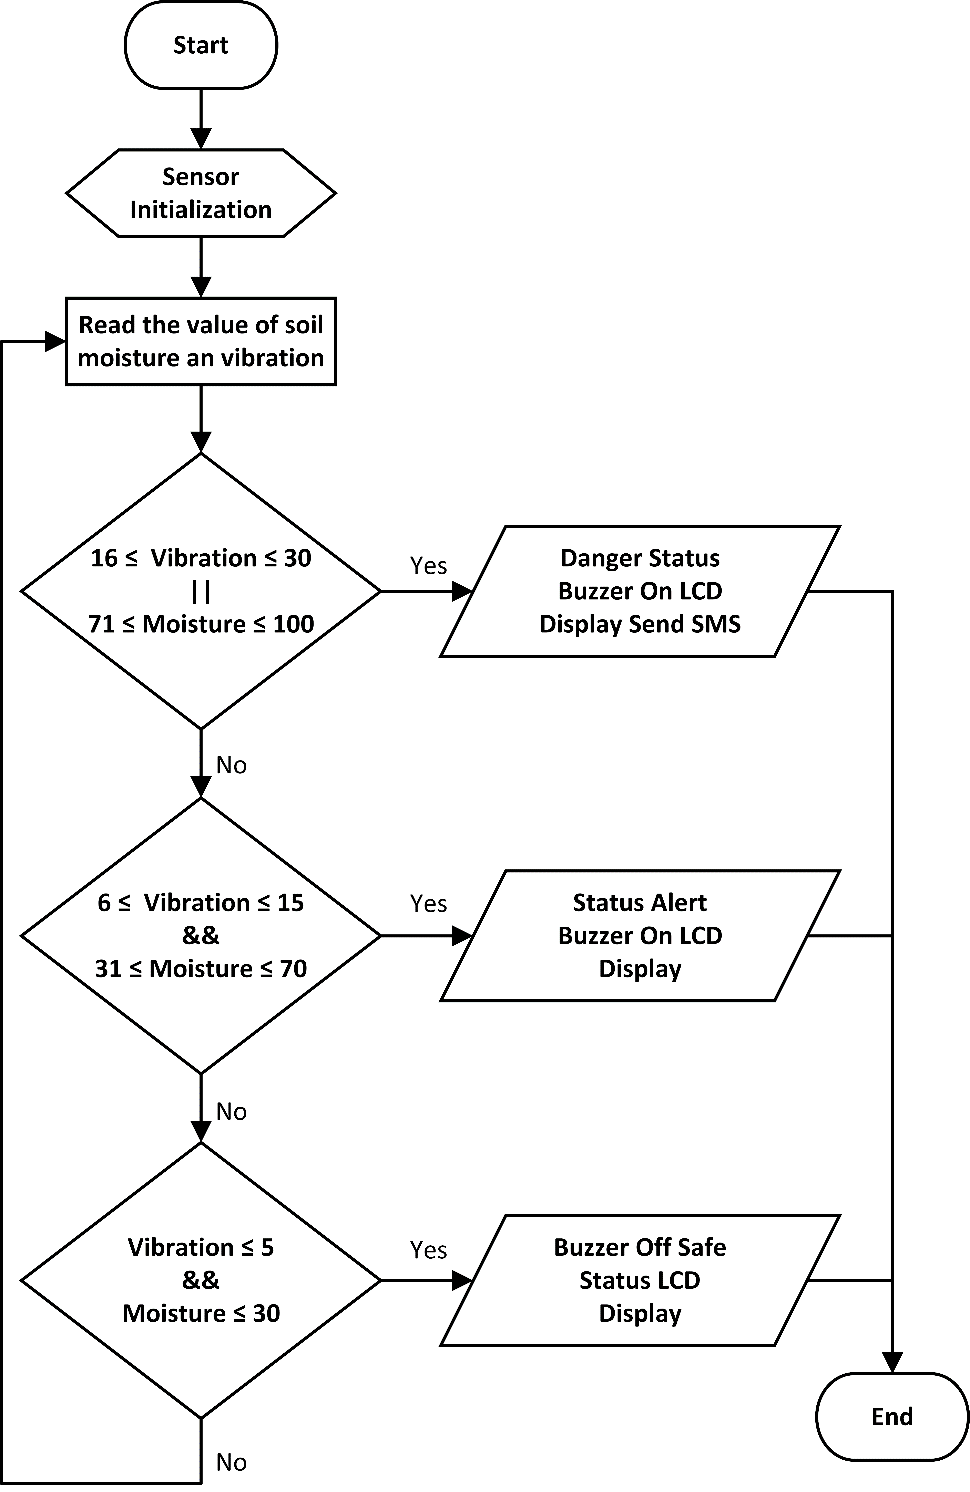
Figure 3. Pre-Erosion flowchart
Pre-erosion conditions are conditions before erosion occurs in the watershed area, in this condition there are 3 statuses namely SAFE, DANGER, and ALERT. This condition is a warning for erosion disaster. With two variables are the value of soil moisture and vibration. The alert indicator uses AND logic to determine the humidity and vibration values, while the hazard indicator uses the OR indicator to read the humidity and vibration values. The difference in the use of this logic aims to get readings that have high accuracy and are in accordance with the theoretical situation. Post-erosion flowchart display can be seen in Figure 4.
In addition to the three indicators of safety, alert and danger, there are also 3 other indicators to determine erosion categories through the simulations carried out. These three categories are light erosion, moderate erosion, and heavy erosion through the reading of analog values from the piezoelectric sensor. Soil moisture and vibration values are analog values that are read by Arduino Uno and then converted into percentage units to get units according to research standards. The greater the analog value, the analog value obtained on the soil moisture sensor, the smaller the percentage value of soil moisture or the less water content in the soil.
The LCD output will always display the ground state output according to the specified time unit. In contrast to the SMS output which will immediately send an indicator automatically if the situation is in a state of danger and severe erosion. Meanwhile, to get monitoring via SMS in other conditions, it can be done by sending a "Check" message to the number contained in the system so that the system will automatically send the state of the condition indicator.
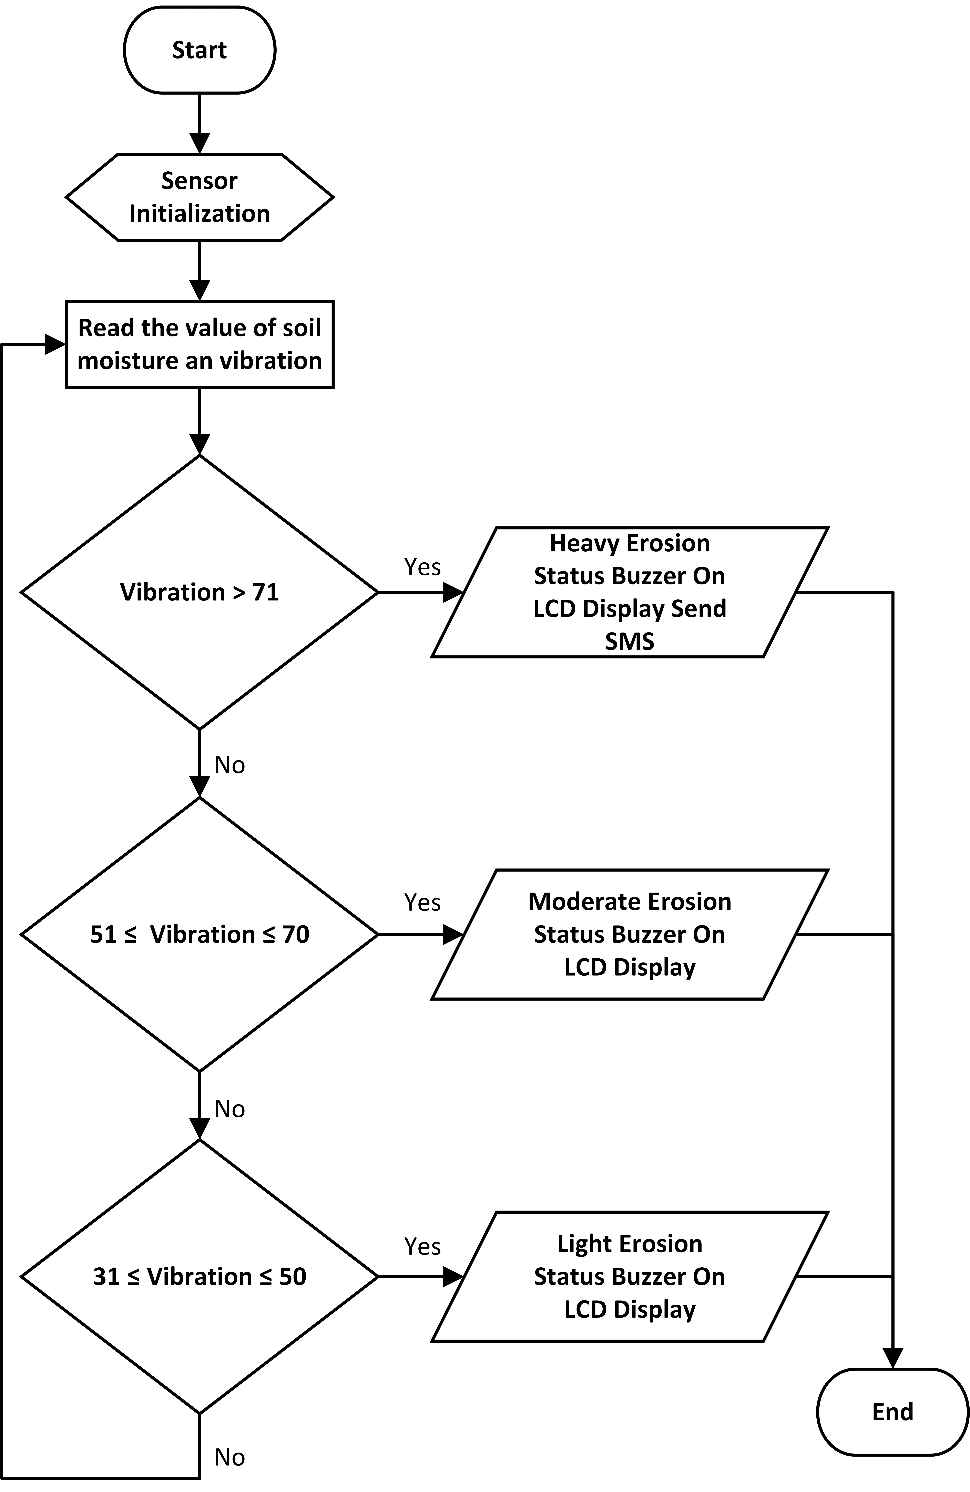
Figure 4. Post-Eruption flowchart
- System Block Diagram
The system block diagram serves to see the relationship between components so as to form a system to achieve research objectives. This daigram will also be an overview of the system to be created. The block diagram display can be seen in Figure 5. The system block diagram will serve as a reference for how the system works as a whole. Arduino is the center of the system that connects sensors or modules to produce the desired output.
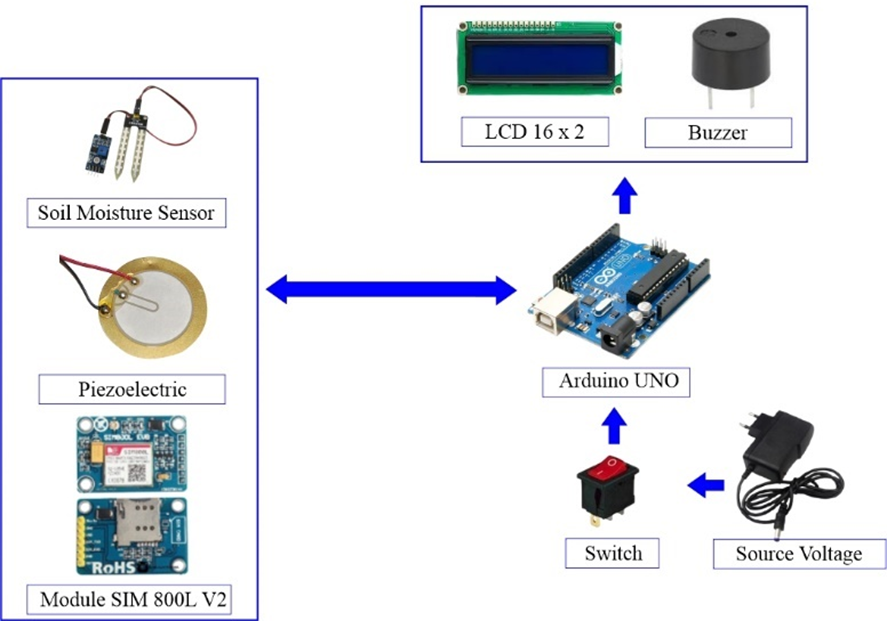
Figure 5. System block diagram
- System Testing
System testing is carried out to obtain system performance with accuracy according to the research objectives being carried out. So that the system can be a solution to the problems being tested. System testing is carried out before the data collection process is carried out by testing and calibrating sensors and designing prototypes to suit the conditions of the Watershed.
- Sensor Testing and Calibration
The sensors used in this research are soil moisture and peizoelectric sensors. To get the measurement results and category values for each sensor against the specified conditions, the sensor calibration stages are carried out [23]. Each sensor will be calibrated individually. Soil moisture sensor calibration uses a method to compare sensor values in the system with the mediatech soil meter 3 in 1. This tool is a tool that can measure soil moisture, PH value and light intensity. The display of the mediatech soil meter can be seen in Figure 6.
. 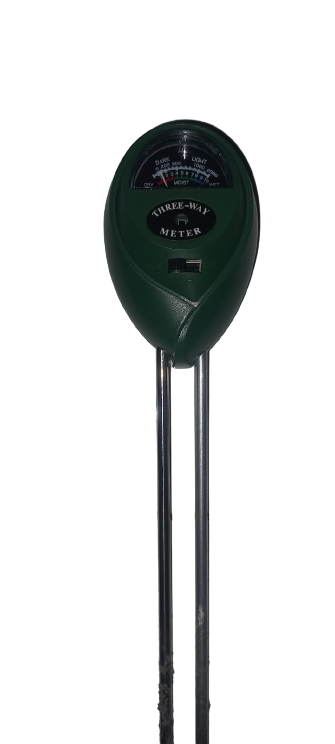
Figure 6. Mediatech soil moisture
In reading the soil moisture value, the mediatech soil meter divides into 3 categories of soil conditions with values ranging from 1 to 10. The categories are dry, moist and wet. The categories of state values from the mediatech soil meter are as shown in Table 2.
Table 2. Categories and values of mediatech soil meters
Category | Value |
Dry | 1-3 |
Moist | 4-7 |
Wet | 8-10 |
The calibration process of the soil moisture sensor with the Mediatech measuring instrument aims to determine the accuracy of the soil moisture sensor used to measure soil moisture [24]. By using the process of calculating the error value obtained from the comparison of measuring results. The error value is obtained from Equation (1) and Equation (2).
| 
| (1) |
| 
| (2) |
- RESULT AND DISCUSSION
- Sensor Testing
The calibration process is carried out with several trials to determine the value of the division of categories that have been carried out. Because the research also divides into 3 categories, the values obtained are not different, but there are some adjustments made to the values obtained. With reference to formulas 1 and 2, comparison data is obtained to obtain the error value of the sensor used so that it can be a benchmark for the accuracy of the sensor used in research. Because the mediatech soil meter soil meter measuring instrument has a value range of 1-10, adjustments are made to obtain the same range as the soil moisture sensor used, namely by using a decimal value between 1-100%. So, the solution obtained is to multiply the value on the measuring instrument by 10 so that the range of values of the sensor and measuring instrument becomes the same value. Soil moisture sensor testing can be seen in Table 3.
Table 3. Results of sensor calibration values
No | Soil Moisture Sensors | Mediatech Soil Meters | Difference | Error Value (%) |
1 | 10.29 | 10.5 | 0.21 | 2.00 |
2 | 14.7 | 15 | 0.3 | 2.00 |
3 | 17.6 | 16.4 | 1.2 | 7.32 |
4 | 24.34 | 19.7 | 4.64 | 23.55 |
5 | 66.28 | 50.5 | 15.78 | 31.25 |
6 | 67.45 | 69.5 | 2.05 | 2.95 |
7 | 69.01 | 70 | 0.99 | 1.41 |
8 | 69.82 | 69.5 | 0.32 | 0.46 |
9 | 76.15 | 79.05 | 2.9 | 3.67 |
10 | 67.16 | 65.4 | 1.76 | 2.69 |
11 | 70.28 | 75.9 | 5.62 | 7.40 |
12 | 69.11 | 70 | 0.89 | 1.27 |
13 | 72.34 | 79 | 6.66 | 8.43 |
14 | 80.74 | 84.3 | 3.56 | 4.22 |
15 | 75.66 | 78.5 | 2.84 | 3.62 |
Average Error Value | 6.82 |
The results of Table 3 are the values obtained from the calibration results with the aim of knowing the sensor error value with a predetermined measuring instrument comparison for more efficient results. In the value of the measuring instrument, the decimal value is obtained from observations made on the needle. Graphical display of the comparison of soil moisture sensor values with measuring instruments can be seen in Figure 7.
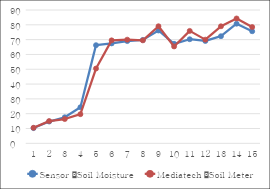
Figure 7. Graph comparison of soil moisture values
Because in making the system, categorization is needed so that the soil moisture reading value is divided into three system categories, namely the category of safe, alert and dangerous. The dry category will enter into the safe category, the moist category will enter the alert category and the wet category will fall into the hazard category. This category is the result of previous research literature, namely the relationship between the higher the water content in the soil is directly proportional to the potential for erosion that will occur.
The calibration of the piezoelectric sensor was carried out based on the results of previous research, so that the division of the 6 categories was the result of previous research and the experimental adjustments carried out on the prototype that had been made. From the results of previous research. when the fall height increases, the sensor output voltage increases and when the distance to the sensor falls closer, the sensor output voltage increases. Voltage and distance to the sensor have a fairly linear relationship [25]. So, it can be concluded that the higher the vibration value, the greater the erosion rate that occurs.
- Making a DAS Prototype
In the process of this research the testing of the tool was carried out by simulating a prototype made with the aim of imitating the conditions of the watershed, so that the data obtained can represent if the system is used directly in the watershed. To make a watershed prototype, use an aquarium because it has conditions that are in accordance with the needs of the research area that you want to make. The display of the prototype and the system created can be seen in Figure 8.
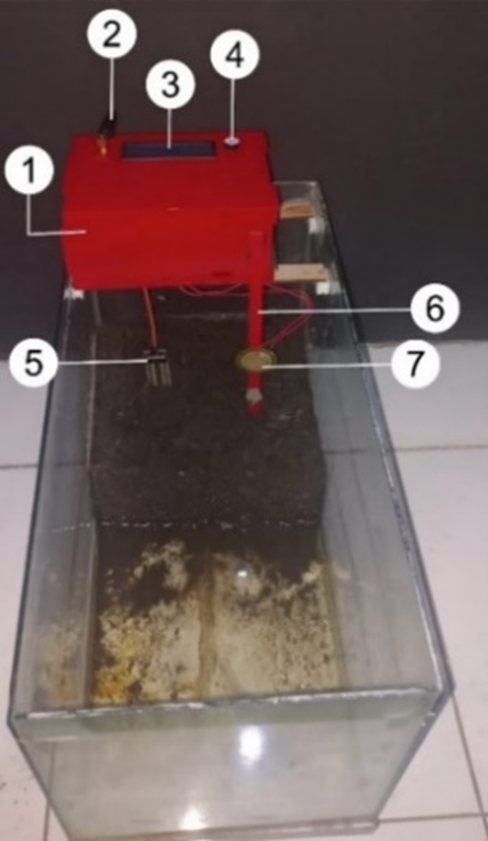
Figure 8. Display of the research prototype
Description of Figure 7
- Box System
- GSM Module Antenna 800L V2
- LCD 16x2
- Buzzers
- Soil Moisture Sensor
- Piezoelectric Sensor Holder
- Piezoelectric Sensors
- Pre-Erosion Data
Data collection was carried out by looking at a comparison between soil moisture values and vibrations that occurred on the 3 pre-erosion statuses which had 3 indicators which included SAFE, ALERT and DANGER. The units for humidity and vibration values are both in percentage units where the maximum value is 100%. The categorization of moisture values is based on 3 main categories of soil moisture values, namely DRY, MOIST, and WET. From the results of tests carried out on the soil erosion warning system, sample data was obtained as shown in Table 4.
Retrieval of experimental results was carried out by taking each 10 of each pre-erosion category that had been determined. Adjustment of data results with flow charts or flowcharts shows that category results with soil moisture and piezoelectric sensor data values are in accordance with system planning. Data collection is carried out by adjusting and testing conditions with changing circumstances so as to produce the desired data representation. When the status is SAFE, the buzzer connected to digital pin 13 will be in the OFF or LOW position, while in the ALERT status, the buzzer will be in HIGH or ON condition for 500 ms and back in OFF or LOW condition for two times.
When the system reading enters the DANGER status, the buzzer will be in HIGH or ON condition for seconds and return to LOW or OFF condition. The relationship between soil moisture and piezoelectric sensors can also be seen in Figure 9. Category acquisition is also shown in the serial monitor display contained in the Arduino IDE software. Evidence of displaying the results of the complete data can be seen in Figure 10.
Table 4. Pre-Erosion data results
No. | Soil Moisture Value (%) | Piezoelectric Value (%) | Status |
1 | 3.03 | 0 | Safe |
2 | 17.30 | 13 | Safe |
3 | 18.28 | 1 | Safe |
4 | 20.46 | 2 | Safe |
5 | 17.20 | 5 | Safe |
6 | 29.39 | 0 | Safe |
7 | 2.83 | 11 | Safe |
8 | 0.59 | 8 | Safe |
9 | 16.76 | 4 | Safe |
10 | 23.43 | 3 | Safe |
11 | 55.13 | 10 | Alert |
12 | 53.76 | 12 | Alert |
13 | 56.89 | 7 | Alert |
14 | 58.36 | 15 | Alert |
15 | 53.76 | 9 | Alert |
16 | 64.42 | 8 | Alert |
17 | 64.61 | 11 | Alert |
18 | 62.76 | 12 | Alert |
19 | 68.82 | 13 | Alert |
20 | 60.51 | 6 | Alert |
21 | 56.79 | 22 | Danger |
22 | 53.86 | 25 | Danger |
23 | 76.74 | 0 | Danger |
24 | 49.17 | 18 | Danger |
25 | 72.73 | 8 | Danger |
26 | 61.29 | 27 | Danger |
27 | 2.35 | 25 | Danger |
28 | 66.67 | 16 | Danger |
29 | 71.26 | 2 | Danger |
30 | 2.93 | 24 | Danger |
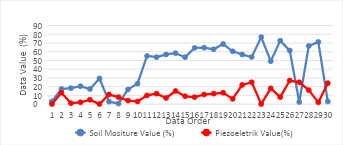
Figure 9. Graph of Pre-Erosion data
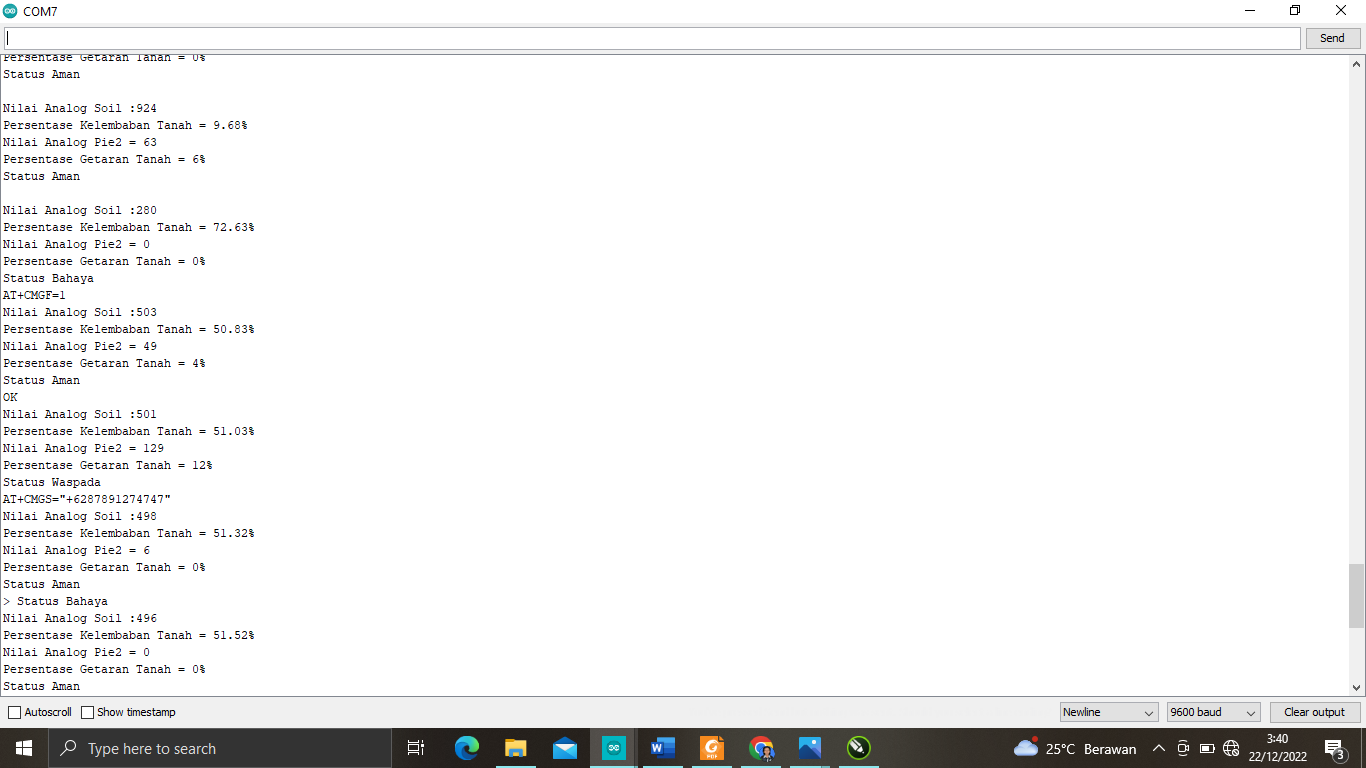
Figure 10. Evidence of Pre-Erosion monitor serial
The creation of this soil erosion warning system also aims to transmit information for the necessary mitigation solutions. Information is sent via Short Message Service (SMS) with category or status notifications that are read by the system. Display trial SMS and delivery time can be seen in Table 5.
Table 5. Display of Pre-Erosion SMS and delivery time
SMS Display | Delivery Time |
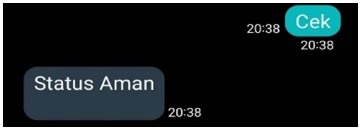
|
<1 minute |
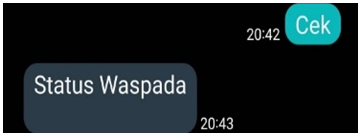
|
1 minute |

|
<1 minute |
- Post Erosion Data
System testing was carried out on the prototype by installing a barrier against the end of the soil and giving a vibration value to the soil in the same way as the pre-erosion test, only in this study the barrier was removed several times to find out whether the soil also experienced downward movement when the barrier was removed. This condition is a condition that represents the occurrence of erosion in the Watershed (DAS) based on the prototype that has been made. There are 3 categories for post-erosion events, namely, LIGHT EROSION, MODERATE EROSION, and SEVERE EROSION. The test table for these conditions can be seen in Table 6.
Table 6. Post-Erosion data
No. | Soil Moisture Value (%) | Piezoelectric Value (%) | Status |
1 | 52.39 | 42 | LIGHT EROSION |
2 | 59.92 | 49 | LIGHT EROSION |
3 | 48.88 | 48 | LIGHT EROSION |
4 | 41.45 | 36 | LIGHT EROSION |
5 | 0.68 | 48 | LIGHT EROSION |
6 | 2.64 | 46 | LIGHT EROSION |
7 | 27.47 | 36 | LIGHT EROSION |
8 | 23.75 | 38 | LIGHT EROSION |
9 | 47.31 | 50 | LIGHT EROSION |
10 | 11.63 | 33 | LIGHT EROSION |
11 | 39.98 | 54 | MODERATE EROSION |
12 | 59.34 | 51 | MODERATE EROSION |
13 | 48.19 | 64 | MODERATE EROSION |
14 | 40.66 | 62 | MODERATE EROSION |
15 | 0.68 | 67 | MODERATE EROSION |
16 | 4.50 | 58 | MODERATE EROSION |
17 | 3.13 | 61 | MODERATE EROSION |
18 | 3.03 | 66 | MODERATE EROSION |
19 | 7.82 | 58 | MODERATE EROSION |
20 | 30.01 | 55 | MODERATE EROSION |
21 | 58.06 | 92 | SEVERE EROSION |
22 | 0.68 | 71 | SEVERE EROSION |
23 | 52.88 | 79 | SEVERE EROSION |
24 | 4.11 | 77 | SEVERE EROSION |
25 | 3.23 | 100 | SEVERE EROSION |
26 | 50.05 | 74 | SEVERE EROSION |
27 | 7.43 | 73 | SEVERE EROSION |
28 | 10.36 | 95 | SEVERE EROSION |
29 | 38.03 | 76 | SEVERE EROSION |
30 | 54.35 | 87 | SEVERE EROSION |
The relationship between the vibration value and the erosion level category can also be seen in the graph as shown in Figure 11.
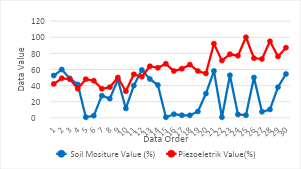
Figure 11. Post-Erosion graph data
Piezoelectric analog values for post-erosion data collection can be seen on the serial monitor in the Arduino IDE software in Figure 12.
Figure 12. Evidence of Post-Erosion monitor serial
Post-erosion conditions also include sending data via SMS for remote monitoring of the system. Monitoring is carried out by sending SMS automatically if SEVERE EROSION occurs during data collection. Whereas in the other 2 conditions for monitoring the system, you can send a "Check" SMS so that it will send the condition or status that occurs in the system. Evidence of SMS display for post-erosion conditions and delivery time for conditions can be seen in Table 7.
Table 7. Display of Post-Erosion SMS and delivery time
SMS Display | Delivery Time |

|
1 minute |
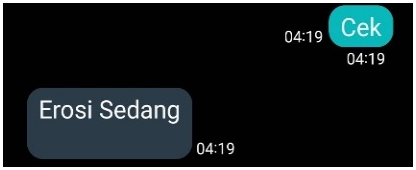
|
<1 minute |

|
<1 minute |
- CONCLUSION
The system uses two indicators, namely soil moisture and vibration values in detecting erosion that occurs in watersheds (DAS). Prior to testing the tool, the soil moisture sensor was calibrated with the results of soil moisture sensor calibration using the mediatech soil meter measuring instrument, an error value of 6.82 was obtained. System testing is divided into 2 main conditions, namely pre-erosion and post-erosion. The main pre-erosion conditions include SAFE status with a humidity value of 0-30% and 0-5% vibration, WASPADA with a humidity value of 31-70% and 6-15% vibration and with a humidity value of 71-100% or 16-30% vibration. While the post-erosion conditions include the status of LIGHT EROSION with a vibration value of 31-50%, MODERATE EROSION with a value of 51-70% and SEVERE EROSION with a vibration value of> 71%. The values for the distribution of categories were obtained from previous research with adjustments made when testing the system using prototypes.
REFERENCES
[1] A. Taqwa, M. Fadhli, S. Soim, A. S. Handayani, and Suroso, “Prototype Design of Landslide Early Detection System Using LoRa and IoT,” Proc. 4th Forum Res. Sci. Technol., vol. 7, pp. 495–499, 2021, https://doi.org/10.2991/ahe.k.210205.084.
[2] I. Triastari, S. I. A. Dwiningrum, and S. H. Rahmia, “Developing Disaster Mitigation Education with Local Wisdom: Exemplified in Indonesia Schools,” IOP Conf. Ser. Earth Environ. Sci., vol. 884, no. 1, 2021, https://doi.org/10.1088/1755-1315/884/1/012004.
[3] A. K. Choirunnisa and S. R. Giyarsih, “The socioeconomic vulnerability of coastal communities to abrasion in Samas, Bantul Regency, Indonesia,” Quaest. Geogr., vol. 37, no. 3, pp. 115–126, 2018. https://doi.org/10.2478/quageo-2018-0029.
[4] Y. Suprapto, E. Fasha, D. Liesnoor, and E. Suharini, “The Development of Natural Disaster Digital Literacy (DILIBA) Android Based of Students’ Understanding at Primary Teacher Education Study Program, Peradaban University.,” 2019, https://doi.org/10.4108/eai.19-10-2018.2281720.
[5] M. Li, W. Cheng, J. Chen, R. Xie, and X. Li, “A high performance piezoelectric sensor for dynamic force monitoring of landslide,” Sensors (Switzerland), vol. 17, no. 2, 2017, https://doi.org/10.3390/s17020394.
[6] S. Biansoongnern, B. Plungkang, and S. Susuk, “Development of Low Cost Vibration Sensor Network for Early Warning System of Landslides,” Energy Procedia, vol. 89, pp. 417–420, 2016, https://doi.org/10.1016/j.egypro.2016.05.055.
[7] P. Fatimah, B. Irawan and C. Setianingsih, "Design of Landslide Early Warning System Using Fuzzy Method Based on Android," 2020 12th International Conference on Information Technology and Electrical Engineering (ICITEE), Yogyakarta, Indonesia, 2020, pp. 350-355, https://doi.org/10.1109/ICITEE49829.2020.9271676.
[8] C. Zucca, N. Middleton, U. Kang and H. Liniger, “Shrinking water bodies as hotspots of sand and dust storms: The role of land degradation and sustainable soil and water management,” Catena, vol. 207, p. 105669, 2021, https://doi.org/10.1016/j.catena.2021.105669.
[9] E. M. López-García, E. Torres-Trejo, L. López-Reyes, Á. D. Flores-Domínguez, R. D. Peña-Moreno, and J. F. López-Olguín, “Estimation of soil erosion using USLE and GIS in the locality of Tzicatlacoyan, Puebla, México,” Soil Water Res., vol. 15, no. 1, pp. 9–17, 2020, https://doi.org/10.17221/165/2018-SWR.
[10] E. Science, “Vibration Effects on Soil Slope Detected by using Arduino System Vibration Effects on Soil Slope Detected by using Arduino System,” 2022, https://doi.org/10.1088/1755-1315/1091/1/012002.
[11] Y. Susanti, S. Syafrudin, and M. Helmi, “Soil Erosion Modelling at Watershed Level in Indonesia: A Review,” E3S Web Conf., vol. 125, no. 201 9, 2019, https://doi.org/10.1051/e3sconf/201912501008.
[12] I. G. Tunas, A. Tanga, and S. R. Oktavia, “Impact of landslides induced by the 2018 palu earthquake on flash flood in bangga river Basin, Sulawesi, Indonesia,” J. Ecol. Eng., vol. 21, no. 2, pp. 190–200, 2020, https://doi.org/10.12911/22998993/116325.
[13] W. Handayani, U. E. Chigbu, I. Rudiarto, and I. H. Surya Putri, “Urbanization and increasing flood risk in the Northern Coast of Central Java-Indonesia: An assessment towards better land use policy and flood management,” Land, vol. 9, no. 10, 2020, https://doi.org/10.3390/land9100343.
[14] M. A. A. Azharudin and N. N. N. Daud, “Vibration Effects on Soil Slope Detected by using Arduino System,” IOP Conf. Ser. Earth Environ. Sci., vol. 1091, no. 1, 2022, https://doi.org/10.1088/1755-1315/1091/1/012002.
[15] G. Gunawan, A. Rahman, B. P. Seputro, and M. Elsera, “Design of Early Warning System Flood and Landslide Mitigation Sensor Based on Internet of Thing,” J. Phys. Conf. Ser., vol. 1361, no. 1, 2019, https://doi.org/10.1088/1742-6596/1361/1/012062.
[16] S. Athani, C. H. Tejeshwar, M. M. Patil, P. Patil, and R. Kulkarni, “Soil moisture monitoring using IoT enabled arduino sensors with neural networks for improving soil management for farmers and predict seasonal rainfall for planning future harvest in North Karnataka-India,” Proc. Int. Conf. IoT Soc. Mobile, Anal. Cloud, I-SMAC 2017, no. February, pp. 43–48, 2017, https://doi.org/10.1109/I-SMAC.2017.8058385.
[17] R. Diharja, M. R. Fahlevi, E. S. Rahayu, and W. Handini, “Prototype-Design of Soil Movement Detector Using IoT Hands-on Application,” J. Penelit. Pendidik. IPA, vol. 8, no. 4, pp. 2245–2254, 2022, https://doi.org/10.29303/jppipa.v8i4.1709.
[18] L. K. Coulibaly, Q. Guan, T. V. Assoma, X. Fan and N. Coulibaly, “Coupling linear spectral unmixing and RUSLE2 to model soil erosion in the Boubo coastal watershed, Côte d'Ivoire,” Ecological Indicators, vol. 130, p. 108092, 2021, https://doi.org/10.1016/j.ecolind.2021.108092.
[19] F. Aji Purnomo, N. Maulana Yoeseph, and G. Wijang Abisatya, “Landslide early warning system based on arduino with soil movement and humidity sensors,” J. Phys. Conf. Ser., vol. 1153, no. 1, 2019, https://doi.org/10.1088/1742-6596/1153/1/012034.
[20] E. López et al., “A Low-Power IoT Device for Measuring Water Table Levels and Soil Moisture to Ease Increased Crop Yields,” Sensors, vol. 22, no. 18, p. 6840, 2022, https://doi.org/10.3390/s22186840.
[21] Anggara Trisna Nugraha and D. Priyambodo, “Design of a Monitoring System for Hydroganics based on Arduino Uno R3 to Realize Sustainable Development Goal`s number 2 Zero Hunger,” J. Electron. Electromed. Eng. Med. Informatics, vol. 3, no. 1, pp. 50–56, 2021, https://doi.org/10.35882/jeeemi.v3i1.8.
[22] A. A. Beltran, K. J. T. Dizon, K. C. Nones, R. L. M. Salanguit, J. B. D. Santos, and J. R. G. Santos, “Arduino-based disaster management alarm system with SMS,” J. Robot. Control, vol. 2, no. 1, pp. 24–28, 2021, https://doi.org/10.18196/jrc.2147.
[23] D. Dhatri P V S, M. Pachiyannan, J. Swaroopa Rani K and G. Pravallika, "A Low-Cost Arduino based Automatic Irrigation System using Soil Moisture Sensor: Design and Analysis," 2019 2nd International Conference on Signal Processing and Communication (ICSPC), Coimbatore, India, 2019, pp. 104-108, https://doi.org/10.1109/ICSPC46172.2019.8976483.
[24] I. G. E. Darmawan, E. Yadie, and H. Subagyo, “Rancang Bangun Alat Ukur Kelembaban Tanah Berbasis Arduino Uno,” PoliGrid, vol. 1, no. 1, p. 31, 2020, https://doi.org/10.46964/poligrid.v1i1.215.
[25] M. A. M. Al-Obaidi, M. A. H. Radhi, R. S. Ibrahim, and T. Sutikno, “Technique smart control soil moisture system to watering plant based on IoT with arduino uno,” Bull. Electr. Eng. Informatics, vol. 9, no. 5, pp. 2038–2044, 2020, https://doi.org/10.11591/eei.v9i5.1896.
AUTHOR BIOGRAPHY

| M. Ulud Risaldi is a student of the Department of Electrical Engineering, Faculty of Industrial Technology, Universitas Ahmad Dahlan, Yogyakarta, Indonesia.
|
|
|

| Ahmad Raditya Cahya Baswara is a Lecturer at the Department of Electrical Engineering, Faculty of Industrial Technology, Universitas Ahmad Dahlan, Yogyakarta, Indonesia. |
|
|
Design of a Soil Erosion Warning System in Watersheds Based on Arduino Uno (M. Ulud Risaldi)