Buletin Ilmiah Sarjana Teknik Elektro ISSN: 2685-9572
CNN Classification of Malaria Parasites in Digital Microscope Images Using Python on Raspberry Pi
Muhammad Muttaqin1, Meida C. Untoro1, Andre Febrianto1, Amir Faisal2, Agung W. Setiawan3, Bagas P. Prabowo4, Yusuf A. Rahman5
1 Informatics Engineering, Institut Teknologi Sumatera, Lampung, Indonesia
2 Biomedical Engineering, Institut Teknologi Sumatera, Lampung, Indonesia
3 Biomedical Engineering, Institut Teknologi Bandung, Jawa Barat, Indonesia
4 Medical Laboratory, Puskesmas Sukamaju, Lampung, Indonesia
5 Department of Internal Medicine, RSUD Abdoel Moeloek, Lampung, Indonesia
ARTICLE INFORMATION |
| ABSTRACT |
Article History: Submitted 04 January 2023 Revised 07 February 2023 Accepted 17 February 2023
|
| 
Malaria disease occurs because the plasmodium parasite infects human red blood cells spread by female Anopheles mosquitoes and then causes health problems such as blood deficiency and even death. The gold standard of malaria diagnosis is to use laboratory microscopy examination of the patient's red blood cell samples to distinguish between microscope images of parasitic and non-parasitic red blood cells. However, diagnosing malaria through microscope observation is time-consuming, subjective, and tiring for health workers. So, a malaria classification system was designed using the Convolutional Neural Network (CNN) method to distinguish parasitic and non-parasitic red blood cell images. The CNN model is trained using training data and also tested using test data. Then, the CNN training model is embedded on a Raspberry Pi equipped with a Graphical User Interface to facilitate observer interaction through the LCD screen on this digital and portable microscope. The CNN classification rate achieved an accuracy value of 97.88% using the database image and 98.76% using the digital microscope acquisition image. The CNN classification system of malaria parasites designed on a Raspberry Pi-based digital and portable microscope is expected to improve the diagnosis of malaria and reduce the infection rate of malaria patients, especially in various remote areas in Indonesia. |
Keywords: Malaria Parasites; Microscope Image; Raspberry Pi Minicomputer; CNN Classification; Pythons
|
Corresponding Author: Amir Faisal, Biomedical Engineering, Institut Teknologi Sumatera, Lampung, Indonesia. Email: amir.faisal@bm.itera.ac.id |
|
This work is licensed under a Creative Commons Attribution-Share Alike 4.0 
|
|
Document Citation: M. Muttaqin et al., “CNN Classification of Malaria Parasites in Digital Microscope Images Using Python on Raspberry Pi,” Buletin Ilmiah Sarjana Teknik Elektro, vol. 5, no. 1, pp. 108-120, 2023, DOI: 10.12928/biste.v5i1.7522. |
- INTRODUCTION
Malaria is a tropical disease caused by infection with plasmodium parasites from the bite of anopheles female mosquitoes that can multiply in human red blood cells [1]. Symptoms of malaria begin to occur about 10 to 15 days after the mosquito bite [2]. Malaria can cause risky health problems such as anemia and can even cause death, especially in infants, children under five and pregnant women [3].
In the flow of management of malaria infection, malaria disease must be treated properly and as soon as possible so that malaria infection can be controlled and the mortality rate due to malaria can be reduced [4]. However, microscopic observation of blood cells takes a long time because the plasmodium parasite has a very small size and to avoid examination errors that can occur [5].
There are several pattern classification methods in the literature to detect malaria based on artificial intelligence [16]-[19]. Djahari and Hermawan extracted features of malaria plasmodium images on red blood cells using Principal Component Analysis (PCA) then performed classification using Support Vector Machines (SVM) which resulted in 75% accuracy [6]. Hamid et al., used Median filter, k-Means segmentation method, color feature extraction, then performed backpropagation artificial condition network (JST) classification based on color features to identify the presence or absence of plasmodium parasite cells in blood cell images with an accuracy rate of 86.8% [7]. Arowolo et al., conducted feature extraction using PCA and classification of RNA sequence malaria vectors using the k-Nearest Neighbors (KNN) and decision tree algorithms where 86.7% accuracy was achieved for the KNN method and 83.3% accuracy for the decision tree method [8]. Mishra classified parasitic and non-parasitic red blood cell images using the Random Forest method with an accuracy rate of 91% [9]. Pratiwi et al., and Setiawan et al., classified microscopic images of malaria parasitic and non-parasitic red blood cells using the Convolutional Neural Network (CNN) method with an accuracy rate of 95.83% [2][10].
Based on this literature review, CNN method has the best accuracy level implemented for microscopic image classification of parasitic and non-parasitic red blood cells. CNN is the development of Multilayer Perceptron (MLP) for image data processing and is commonly used in classifying images into certain categories [11]. MLP is a development of JST made to reduce the shortcomings of JST with Single-layer Perceptron [12]. The CNN classification system of malaria parasites in this study was implemented on a digital and portable microscope. A raspberry pi minicomputer was used to embed the CNN model that had been trained using training data on Google Collaboratory. Light microscopes available in health facilities in Indonesia were used so that this additional equipment could be widely used. A digital camera facing the ocular lens of the light microscope is used to capture a digital image of the blood smear preparation sample located under the objective lens so that the results can be displayed directly through the LCD screen [13][20].
The design of a digital and portable microscope-based malaria parasite CNN classification system is expected to ease the process of microscopic examination of malaria parasite infection in red blood cells [14]. So that malaria diagnosis services in Indonesia can be improved, especially to deal with or reduce the level of malaria infection, especially in remote areas [15].
- METHODS
The flowchart of this research method is divided into two parts, namely the training of the CNN model and the planting of the trained CNN model on the Raspberry Pi as shown in Figure 1. Testing the accuracy of the classification of the CNN model was carried out using training and test data sourced from the Google Collaboratory database. While testing the accuracy of the classification of malaria parasites on the Raspberry Pi was carried out using digital microscope image data. Then, digital and portable microscopy acquisition systems, CNN model training and testing data, CNN architectural design, and testing the accuracy of the malaria parasite CNN classification are described in the next sub-chapter.
- Digital and Portable Microscope Image Acquisition System
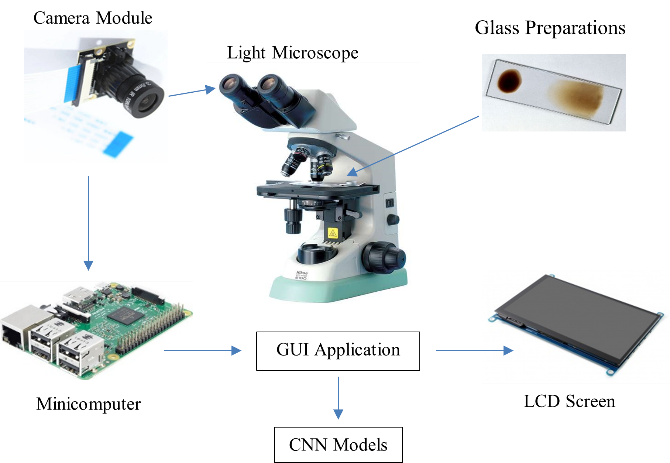
The digital and portable microscope image acquisition system uses a raspberry pi camera, raspberry pi mini computer, liquid crystal display (LCD) screen as shown in Figure 2. The digital camera is placed on the ocular lens of the light microscope to obtain a digital image of the blood smear sample containing malaria parasites. A preparation glass is needed to place the blood smear sample on the objective lens so that it can be seen on the ocular lens. The light microscope used came from the Medical Laboratory, Sukamaju Community Health Center, Bandar Lampung. The choice of using this light microscope is so that additional digital and portable microscope equipment can be used in health facilities spread across Indonesia. So that the acquisition image from the microscope can be stored in digital format and classified using a CNN model based on the raspberry pi mini computer platform. Then the results of this CNN classification of malaria parasites can be displayed on an LCD screen so that the results of this microscope examination can be read by health workers.
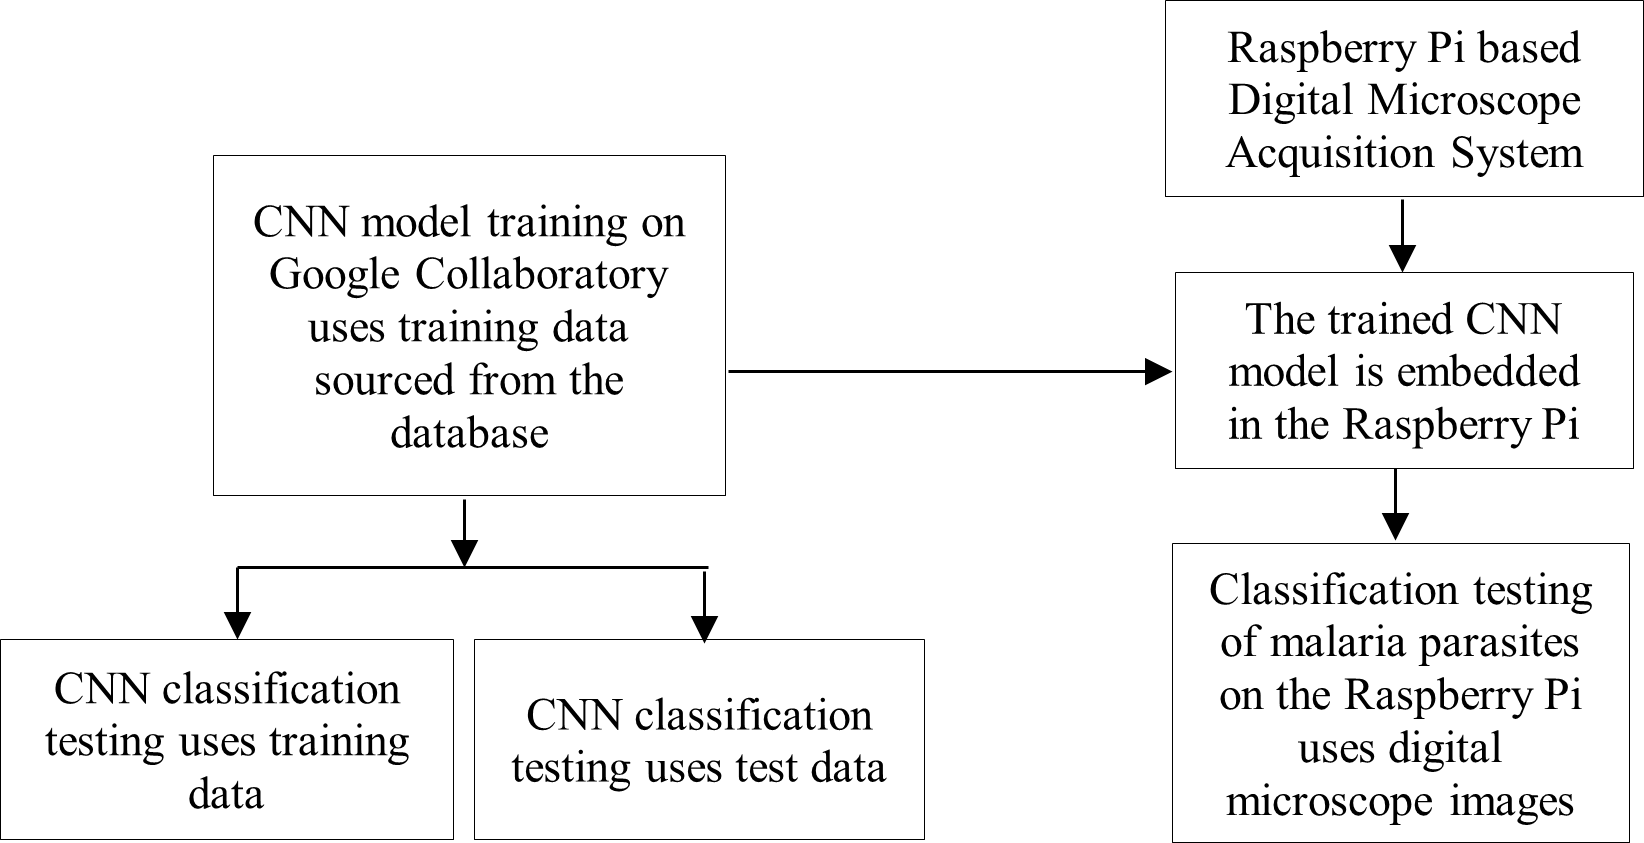
Figure 1. The flowchart of the CNN model training research at Google Collaboratory and the implantation of the trained CNN model on the Raspberry Pi as well as testing its classification accuracy using training data, tests, and digital microscope images, and testing the accuracy of the malaria parasite CNN classification will be explained in the following sub-chapters
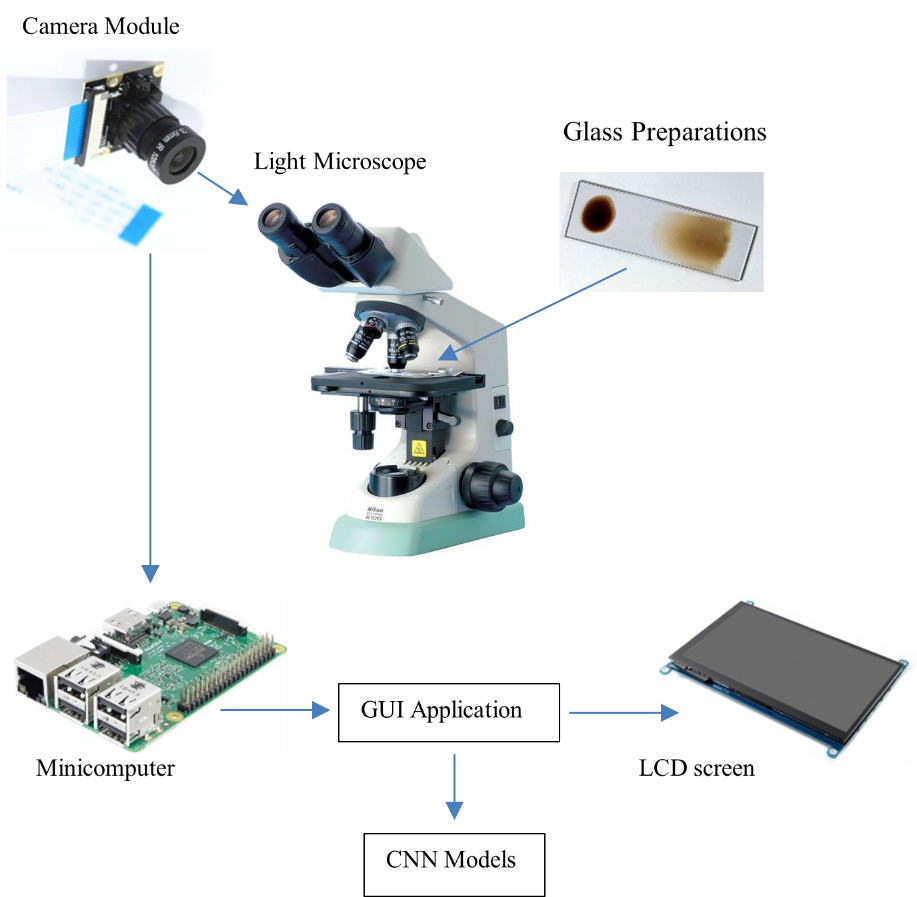
Figure 2. Overall illustration of a series of electronic device components and software on a digital microscope
- CNN Model Training and Testing Data
The data used for training and testing the CNN model were obtained from the Lister Hill National Center for Biomedical Communications website, U.S. National Library of Medicine (NLM) and annotated by the Mahidol-Oxford Tropical Medicine Research Unit in Bangkok, Thailand which was used in the development and training stages of the CNN model for malaria detection. This data consists of 27,556 image data, which is divided into two categories, namely the parasitized (infected) category of 13,778 data and the non-parasitized (not infected with malaria) category of 13,778 data.
A total of 26,000 images are used in CNN model training, which is further divided into 75% training data (19,500 images) and 25% validation data (6,500 images) containing 50% parasitic images and 50% non-parasitic images. Then, 1,556 images will be used for CNN model testing. Digital image data of sample preparations acquired from the microscope are also used to test the CNN model. Microscope images of infected red blood cells (purple parasite objects) and uninfected malaria parasites can be seen in Figure 3. The malaria parasite is seen as a purple object.
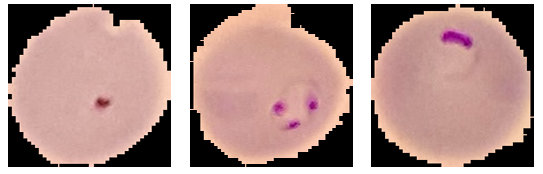

Figure 3. Microscope images of red blood cells infected and uninfected with malaria parasites
- CNN Architecture Design
In the classification of malaria parasites and non-parasites, the CNN method is used, which is an MLP variant that contains weights and several layers that can be used for image classification. CNN is specifically designed to process input data in image formats where pixels are the smallest component unit. In this malaria parasite classification, the CNN architecture uses several layers, namely input image, convolution layer, rectified linear units (ReLU), pooling layer using max polling and fully connected layer which is illustrated in Figure 4 and its size can be seen in Table 1.
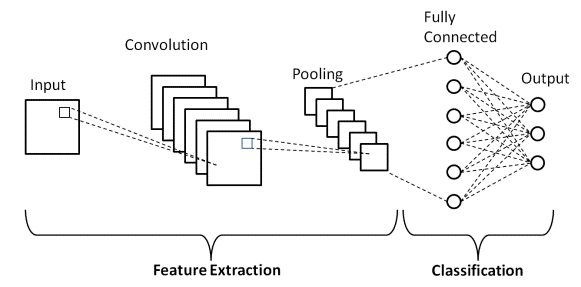
Figure 4. Illustration of the basic architecture of the CNN model
The input image is the image used for CNN training obtained from the National Library of Medicine website. In the convolution layer, a layer with a size of 64x64 pixels and a filter with a size of 3x3 pixels are used. After going through the convolution process, each layer will be processed using the ReLu activation function.
Furthermore, the max pooling process is carried out with a size of 2x2 pixels with a stride or shift of 2 pixels. Then a flatten process will be carried out at the end to convert the image features into one-dimensional vectors so that they can be used as input from the fully-connected layer and can be classified. In Table 1 above the output of the flatten layer is 4096 pixels which is obtained from the number of pixels from the previous layer which has been converted into a one-dimensional vector.
Table 1. CNN model architecture
No | Layer | Output (piksel) |
1 | Input image | 64, 64, 3 |
2 | Convolutional 1 | 64, 64, 16 |
3 | ReLU Activation 1 | 64, 64, 16 |
4 | Max Pooling 1 | 32, 32, 16 |
5 | Convolutional 2 | 32, 32, 32 |
6 | ReLU Activation 2 | 32, 32, 32 |
7 | Max Pooling 2 | 16, 16, 32 |
8 | Convolutional 3 | 16, 16, 64 |
9 | ReLU Activation 3 | 16, 16, 64 |
10 | Max Pooling 3 | 8, 8, 64 |
11 | Dropout | 8, 8, 64 |
12 | Flatten | 4096 |
13 | Dense | 200 |
14 | Dropout | 200 |
15 | Dense | 2 |
Furthermore, the layer dropout stage is a process to temporarily remove some pixels to speed up the process. After that the dense function, which is adding a layer to the fully connected to classify according to the class on the output. In Table 1 above, the dense layer has an output of 2 because in this study the classification results are divided into 2, namely infected or not infected. Details of the steps for each layer are as follows:
- Convolutional Layer
In this layer, the input image will be processed with a size of 64 pixels. Convolutional layers use several parameters such as filters and stride. The convolution process in this study uses a kernel size of 3x3 pixels and uses a filter with a size of 3x3 pixels. In the convolution process, the dot product calculation operation is performed between the kernel of the 3x3 pixel size image with a 3x3 pixel filter, and the number of strides shifts of 1 pixel. The convolution calculation process is carried out sequentially and a displacement or shift of 1 pixel is made until all parts of the image pixels have been processed. Simulation of calculations on this layer can be seen in Figure 5 with a 6x6 pixel input image.

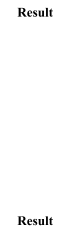
Figure 5. Convolutional layer
- Rectified Linear Units (ReLU)
The ReLU activation function is used to make the results of the previous layer non-linear. This layer uses the ReLU activation function 𝑓(𝑥) = max(0, x), the result of this process is essentially to create a barrier at zero. If the value of x or the input of the node in the kernel is smaller than 0 then the value of x = 0, while for a value of x greater than 0 then the value of x is the number x itself. Simulation on this layer can be seen in Figure 6.
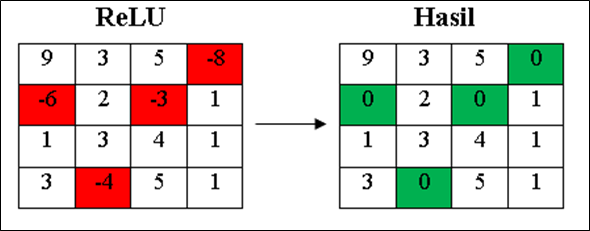

Figure 6. ReLU layer
- Polling Layer
In this layer, the kernel size used is 2x2 pixels. This pooling layer aims to reduce the dimensions of the convolution process results or commonly called downsampling. This research will use the max pooling technique in the pooling layer process, where the largest value will be used. The simulation process of the max pooling layer can be seen in Figure 7 using a size of 2x2 pixels with a stride or shift of 1.

Figure 7. Pooling layer
- Fully Connected Layer
This layer will be processed in the last layer after all hidden layers are processed, which then results in an output which is a class label. Fully connected layer there is a flatten process, which is the unification of each pixel into a one-dimensional vector, dropout layer, which is the process of temporarily removing some hidden layers to speed up the process, and dense process, which is to add a layer to the fully connected by using a sigmoid activation function to perform classification and then become an output, namely one of the class labels.
- CNN Model Building
At the stage of making the CNN model for detection of malaria, the CNN model will be implemented into programming in Python at the Google Collaboratory. While the training data and validation data for training and model validation will use a validation dataset. To support the creation of this model, several libraries are needed as follows:
- Sklearn
Scikit-learn or sklearn is a common python library used for processing data and training data for machine learning applications. Sklearn has several features that are very helpful in the CNN model building process as follows:
- Train test split feature to divide train data and test data.
- Confusion matrix feature to evaluate classification accuracy by comparing actual value and predicted value which will produce 4 categories namely true positive, true negative, false positive and false negative.
- Classification report feature to view precision, recall and accuracy values based on the confusion matrix.
- Predict feature to predict validation data or test data for the model created.
- Tensorflow
Tensorflow is a python library that can be used to make it easier to train and build neural networks for the process of classifying or recognizing an object.
- Keras
Keras is a python library commonly used to create and evaluate a machine learning model, and is compatible with other libraries such as tensorFlow.
The input image data size will be changed to 64x64 pixels according to the CNN architecture design. It takes about 20 minutes to access all the images from the dataset. The next process is to create a CNN model structure using a keras library. The CNN architecture used has several layers, namely input image, convolution layer, ReLU, pooling layer using max polling and fully connected layer. To declare the layers, the model.add command is used and adjusted to the required layer functions such as the activation function.
After the CNN model has been formed, model training will be carried out using the training data that has been accessed. For model training, 100 epochs of learning will be carried out, which means that the learning algorithm will conduct training for 100 iterations, during the learning process, the accuracy of each epoch will be calculated using the model.evaluate command.
After the model has passed the training and validation stage, the model will be saved into a file with the extension h5. Next, the h5 model will be tested to test the accuracy of the model obtained using the confusion matrix. To conduct testing with input data directly from the user, a function will be created to access the CNN model created using Google Collaboratory. This CNN model in h5 format will be embedded in the Graphical User Interface on the raspberry pi mini computer. To access the model, the keras.models.load_model library is needed. After successfully integrating the CNN model, testing can be done with image input from the user. Furthermore, the image will be resized to a size of 64x64 pixels, to classify the image into a model that has been made, the image will be represented in the form of an array. After the array can be predicted using the CNN model by running the CNN.predict() command, which will issue classification results in the form of parasitized or uninfected classes.
- Accuracy Testing of CNN Model for Malaria Parasite Classification
The model testing stage is carried out to determine whether the model that has been made is able to detect malaria and has good accuracy. Tests conducted using malaria datasets from the NLM website. To measure the performance accuracy of the CNN model for malaria detection classification, confusion matrix is used. Confusion matrix can be used to measure the performance of classification models of two or more classes. Confusion matrix will compare the actual value and predicted value which will produce 4 categories namely true positive, true negative, false positive and false negative. Confusion matrix can calculate the accuracy of image classification that is successfully identified correctly. In this study, it is expected that the accuracy will reach 80% as a measure of the success of the model that has been made. The calculation formula for accuracy, precision, recall and F1 Score, can be seen in the Equation (1), Equation (2), Equation (3), and Equation (4).
Description:
1.  is the degree of comparison between the predicted value and the actual value.
2.  is the level of accuracy between the information requested by the user and the answer provided by the system.
3.  is the success rate of the system in retrieving information.
4.  Score describes the average comparison of precision and recall.
5.  or true positive is a label that is correct and predicted to be correct.
6.  or false positive is a label that is correct but predicted wrong.
7.  or true negative is a label that is false but predicted to be true.
8.  or false negative is a label that is wrong and predicted wrong.
- RESULTS AND DISCUSSION
- CNN Model Testing Using Validation Data
After the model has been successfully trained for 100 epochs, the model will be tested using validation data. From the confusion matrix for classification of validation data as shown in Figure 8, the following test results are obtained:
• The correct prediction with parasite detected images (true positive) was 3107 images.
• The prediction is correct with 3099 detected images that are not infected (true negative).
• Incorrect prediction with the results of the prediction detected parasites, it turns out that the image is not infected (false positive) as many as 167 images.
• Incorrect prediction with the prediction results not being infected, it turns out that the image is infected with parasites (false negative) as many as 130 images.
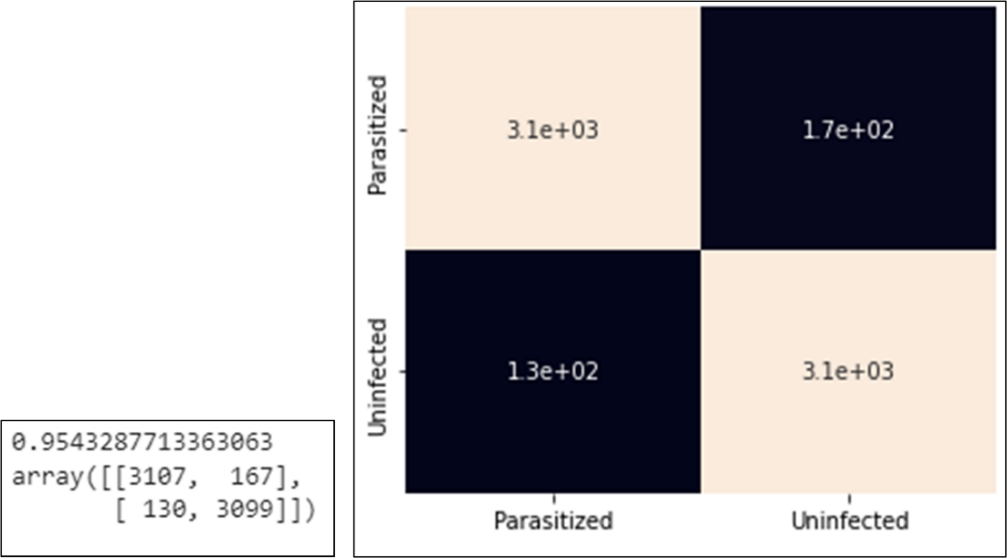
Figure 8. Confusion matrix results and confusion matrix heatmap with validation data
From the classification results on the confusion matrix in Figure 8, the accuracy value can be calculated as follows.

- Classification Accuracy Testing Using NLM Dataset
Testing the accuracy of this model uses test data or testing data with data details, namely 779 infected data and 778 data not infected with malaria. The test results using this confusion matrix for classification of test data can be seen in Figure 9 where the following test results are obtained:
- Correct prediction with parasite detected images (true positive) as many as 758 out of a total of 779 parasite images.
- Correct prediction with 766 out of 778 images detected as uninfected (true negative).
- False prediction with the result of prediction of parasite detection, it turns out that the image is not infected (false positive) as many as 21 images.
- False prediction with the result of prediction is not infected, it turns out that the image is infected with parasites (false negative) as many as 12 images.
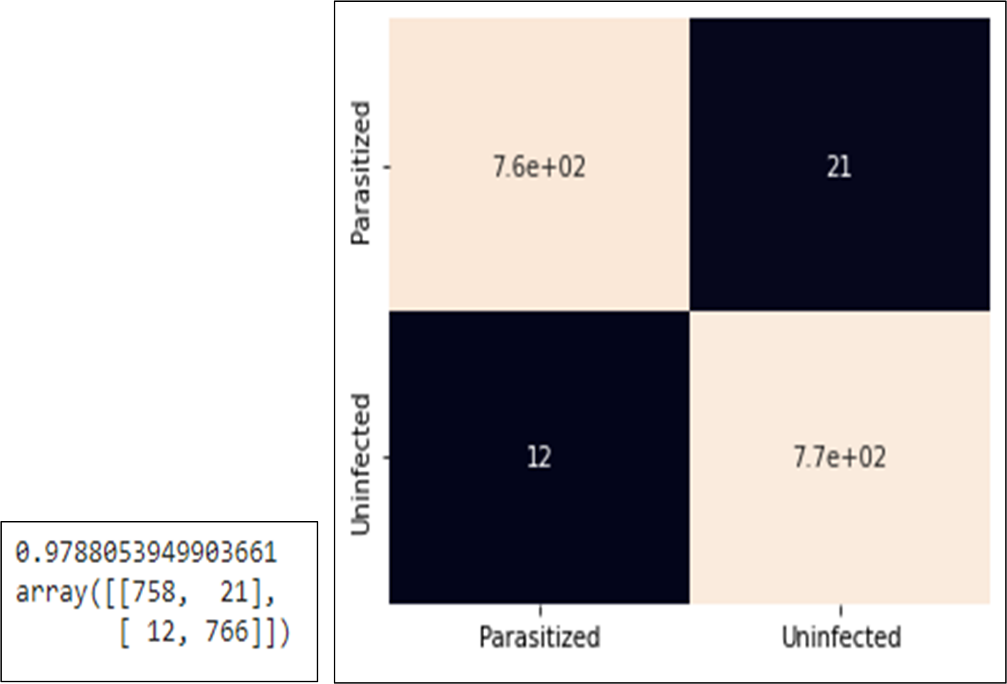
Figure 9. Confusion matrix and heatmap results confusion matrix with test data
From the classification results in the confusion matrix above, the accuracy, precision, recall and F1 score can be calculated as follows:
From the calculation of accuracy, precision, recall and F1 score of the malaria detection model above, the accuracy is 97.88%, precision is 97.30%, recall is 98.44% and F1 score is 97.85%.
- Testing Using Digital Microscope Image
This test aims to validate that the model created can detect malaria parasites from images of preparations taken directly from a light microscope. The image of the sample preparation has been declared indicated by malaria parasites by medical laboratory experts. The image of red blood cells in one field of view that has been taken using a camera can be seen in Figure 10.
In this test, the red blood cell image will be tested using a CNN model that has been created through Google Collaboratory, from the image of one field of view of the malaria preparation, a manual crop is performed to obtain a single red blood cell image from the preparation can be seen in Figure 10. After the crop operation, 243 red blood cell images are obtained which can be classified as follows.
- 240 images are of red blood cells not infected with malaria.
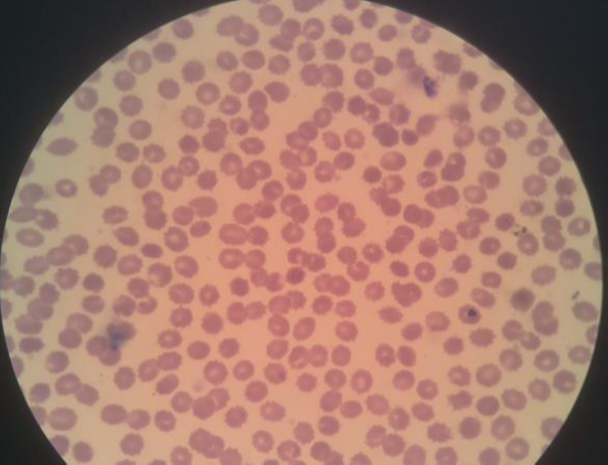
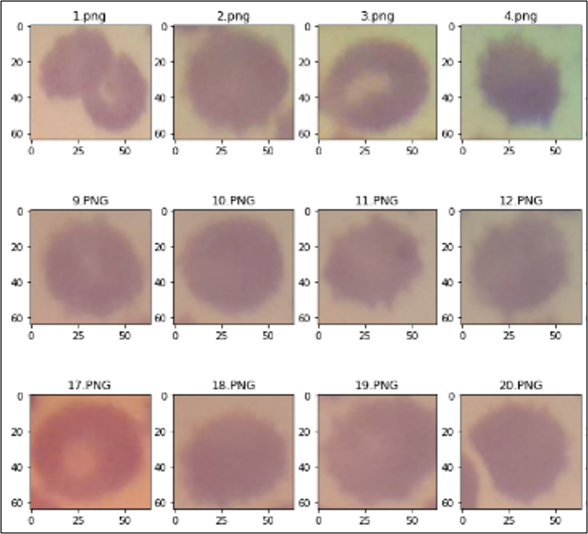
Figure 10. Digital image of one red blood cell field of view and the result of manual cropping for each red blood cell
- 3 images of red blood cells infected with malaria.
Classification is performed on cropped blood cell images to detect the presence or absence of malaria parasites in the image. Malaria classification testing is carried out on all images and the results of the classification will be displayed with the label "parasitized" for images that contain parasites and "uninfected" for images that do not detect parasites as shown in Figure 11. In this figure we can see that there are 3 images that have purple objects that are classified as parasite detected while the rest are not detected parasites. From the tests carried out using the CNN model that has been made, the following classification results are obtained:
- Correct prediction with 3 parasite detected images out of a total of 3 images.
- Correct prediction with images detected not infected with parasites as many as 237 out of a total of 240 images.
- Incorrect prediction with the results of the prediction being detected by parasites, it turns out that the image is not infected by 3 images.
Based on the test results, it can be calculated that the malaria classification accuracy rate is 98.76% using the equation below, so the test is successful and has passed the expected accuracy success parameter limit of 80%.


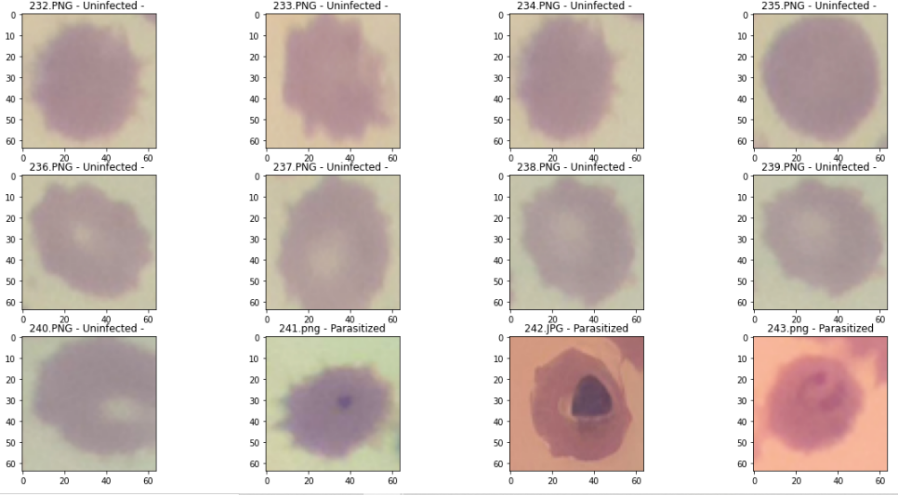

Figure 11. Results of the CNN classification of malaria parasites and non-parasites on one red blood cell
- Comparison of Classification Accuracy with Previous Research Results
Classification of malaria plasmodium images on red blood cells using SVM which produces an accuracy of 75% [6]. Backpropagation ANN classification to identify the presence or absence of plasmodium parasite cells in blood cell images achieves an accuracy rate of 86.8% [7]. Classification of RNA sequence malaria vectors using the KNN method achieves an accuracy of 86.7% and decision trees achieves an accuracy of 83.3% [8]. Classification of parasitic and non-parasitic red blood cell images using the Random Forest method achieves an accuracy rate of 91% [9]. Classification of red blood cell microscopic images of malaria parasites and non-parasites using the CNN method achieves an accuracy rate of 95.83% [2][10]. While the level of classification accuracy in this study reached 97.88% using test data sourced from databases and 98.76% using test data from digital microscope image acquisition as shown in Table 2.
Table 2. Comparison of the accuracy of the classification of malaria parasites
Method | Accuracy |
SVM | 75 % |
JST backpropagation | 86.8 % |
KNN | 83.3 % |
Decision Tree | 86.7 % |
Random Forest | 91 % |
CNN (Setiawan et al.,) | 95.83 % |
CNN (Database) | 97.88 % |
CNN (Microscope Image) | 98.76 % |
- CONCLUSION
The classification system for malaria parasites using the CNN model based on the raspberry pi mini-computer has been tested using validation data and test data sourced from the NLM database and digital images of red blood cells acquired using a raspberry pi-based digital microscope. Testing for detection of malaria parasites using the NLM database achieved an accuracy rate of 97.88% and testing using digital images of red blood cells captured from a digital microscope achieved an accuracy rate of 98.76% in less than 3 seconds for each processed blood cell image. Comparison with the results of previous studies shows that this study achieves a higher accuracy value. The relatively high accuracy value of the classification of malaria parasites indicates that the design of this digital and portable microscope can be used to reduce the burden on health workers when carrying out laboratory examinations of malaria in health facilities that are spread all over the country..
Testing the CNN model using digital microscope images from blood smear samples from malaria patients has been carried out for 1 field of view consisting of 243 single red blood cells. Testing the CNN model and counting the number of parasite-infected red blood cells for 100 fields of view according to the malaria examination procedure is very interesting to do in future research.
Testing the CNN model using digital microscope images was carried out on image 1 field of view where there were 243 single red blood cells. To get 243 single red blood cell images, a manual cropping operation was performed on image 1 field of view. In future research, it is hoped that this operation can be performed automatically using the image segmentation method.
ACKNOWLEDGMENTS
We are grateful for the funding provided by the Abdoel Moeloek Regional Hospital, the Lampung Provincial Health Office and the use of laboratory facilities at the Sukamaju Health Center, the Regional Health Laboratory (Labkesda) of Lampung Province.
REFERENCES
- E. L. Febrianti and T. Christy, “Penerapan Forward Chaining Untuk Mendiagnosa Penyakit Malaria dan Pencegahannya Berbasis Web,” Jurnal Teknologi dan Sistem Informasi, vol. 4, no. 1, pp. 93-100, 2017, https://doi.org/10.33330/jurteksi.v4i1.32.
- N. K. C. Pratiwi, N. Ibrahim, Y. N. Fu’adah and S. Rizal, “Deteksi Parasit Plasmodium pada Citra Mikroskopis Hapusan Darah dengan Metode Deep Learning,” ELKOMIKA: Jurnal Teknik Energi Elektrik, Teknik Telekomunikasi, & Teknik Elektronika, vol. 9, no. 2, pp. 306-317, 2021, https://doi.org/10.26760/elkomika.v9i2.306.
- Direktorat Jenderal Pencegahan dan Pengendalian Penyakit, Kemenkes RI, “Buku Saku Tata Laksana Kasus Malaria.” 2020, https://persi.or.id/wp-content/uploads/2020/11/bukusaku_malaria.pdf.
- A. W. Setiawan, A. Faisal, N. Resfita and Y. A. Rahman, “Detection of Malaria Parasites using Thresholding in RGB, YCbCr and Lab Color Spaces,” 2021 International Seminar on Application for Technology of Information and Communication (iSemantic), pp. 70-75, 2021, https://doi.org/10.1109/iSemantic52711.2021.9573224.
- Yohannes, S. Devella and K. Arianto, “Deteksi Penyakit Malaria Menggunakan Convolutional Neural Network Berbasis Saliency,” JUITA: Jurnal Informatika, vol. 8, no. 1, pp. 37–44, 2020, https://doi.org/10.30595/juita.v8i1.6671.
- K. I. Djahari and G. Hermawan, “Implementasi Metode Principal Component Analysis dan Support Vector Machines dalam Mendeteksi Plasmodium Malaria pada Citra Sampel Darah,” Teknik Informatika – Universitas Komputer Indonesia, 2016, http://repository.unikom.ac.id/id/eprint/53445.
- M. Hamid, P. Mudjirahardjo and E. Yudaningtyas, “Penerapan Fitur Warna Untuk Identifikasi Plasmodium Falciparum pada Sediaan Apus Darah Menggunakan MK-Means dan Jaringan Backpropagation,” MATICS: Jurnal Ilmu Komputer dan Teknologi Informasi, vol. 8, no. 2, pp. 73–77, 2016, https://doi.org/10.18860/mat.v8i2.3730.
- M. O. Arowolo, M. Adebiyi, A. Adebiyi and O. Okesola, “PCA Model For RNA-Seq Malaria Vector Data Classification Using KNN And Decision Tree Algorithm,” 2020 International Conference in Mathematics, Computer Engineering and Computer Science (ICMCECS), pp. 1-8, 2020, https://doi.org/10.1109/ICMCECS47690.2020.240881.
- S. K. Mishra, “Human Malaria Detection and Stage Classification using Random Forest Classifier,” International Journal of Scientific Development and Research (IJSDR), vol. 6, no. 6, pp. 214–218, 2021, https://www.ijsdr.org/papers/IJSDR2106032.pdf.
- A. W. Setiawan, Y. A. Rahman, A. Faisal, M. Siburian, N. Resfita and M. W. G., R. Setiawan, “Deteksi malaria berbasis segmentasi warna citra dan pembelajaran mesin,” Jurnal Teknologi Informasi dan Ilmu Komputer (JTIIK), vol. 8, no. 4, pp. 769–776, 2021, https://doi.org/10.25126/jtiik.2021844377.
- Y. Jusman, S. Riyadi, A. Faisal, S. N. A. M. Kanafiah, Z. Mohamed and R. Hassan, “Classification System for Leukemia Cell Images based on Hu Moment Invariants and Support Vector Machines,” 2021 11th IEEE International Conference on Control System, Computing and Engineering (ICCSCE), pp. 137-141, 2021, https://doi.org/10.1109/ICCSCE52189.2021.9530974.
- G. O. F. Parikesit, M. Darmawan and A. Faisal, “Quantitative low-cost webcam-based microscopy,” Optical Engineering, vol. 49, no. 11, pp. 113-205, 2010, https://doi.org/10.1117/1.3517747.
- I. Susanti et al., “Pengembangan Mikroskop Dengan Mikrokontroler dan Cahaya Monokromatik Untuk Mendeteksi Parasit Malaria,” Jurnal Teknologi Laboratorium, vol. 6, no. 2, pp. 75–82, 2017, https://doi.org/10.29238/teknolabjournal.v6i2.59.
- Y. Jusman et al., “Comparison of Texture and Shape Features Performance for Leukemia Cell Images using Support Vector Machine,” 2021 1st International Conference on Electronic and Electrical Engineering and Intelligent System (ICE3IS), pp. 24-28, 2021, https://doi.org/10.1109/ICE3IS54102.2021.9649683.
- I. S. Faradisa, Taufikurrahman, E. Nurcahyo, “Aplikasi Arduino untuk Otomatisasi Apusan Darah Tepi dan Pengecatan Menggunakan Pewarna Giemsa.” Seminar Nasional Inovasi dan Aplikasi Teknologi di Industri (SENIATI) 2016, pp. 221-228, 2016, https://ejournal.itn.ac.id/index.php/seniati/article/view/812.
- J. Yoon, W. S. Jang, J. Nam, D. -C. Mihn and C. S. Lim, “An Automated Microscopic Malaria Parasite Detection System Using Digital Image Analysis,” Diagnostics, vol. 11, no. 3, p. 527, 2021, https://doi.org/10.3390/diagnostics11030527.
- S. Punitha, P. Logeshwari, P. Sivaranjani and S. Priyanka, “Detection of malarial parasite in blood using image processing,” Asian Journal of Applied Science and Technology (AJAST), vol. 1, no. 2, pp. 211-213, 2017, https://dx.doi.org/10.2139/ssrn.2942420.
- G. Hcini, I. Jdey and H. Ltifi, “Improving Malaria Detection Using L1 Regularization Neural Network,” Journal of Universal Computer Science, vol. 28, no. 10, 1087-1107, 2022, https://doi.org/10.3897/jucs.81681.
- U. Salamah, R. Sarno, A. Z. Arifin, A. S. Nugroho, I. E. Rozi and P. B. S. Asih, “A Robust Segmentation for Malaria Parasite Detection of Thick Blood Smear Microscopic Images,” Journal of Telecommunication, Electronic and Computer Engineering (JTEC), vol. 9, no. 4, pp. 1450-1459, 2019, https://doi.org/10.18517/ijaseit.9.4.4843.
- R. Sangameswaran, “MAIScope: A low-cost portable microscope with built-in vision AI to automate microscopic diagnosis of diseases in remote rural settings,” ArXiv: Electrical Engineering and Systems Science, Image and Video Processing, arXiv preprint arXiv:2208.06114, 2022, https://doi.org/10.48550/arXiv.2208.06114.
CNN Classification of Malaria Parasites in Digital Microscope Images Using Python on Raspberry Pi (Muhammad Muttaqin)