Buletin Ilmiah Sarjana Teknik Elektro ISSN: 2685-9572
Gray Level Co-Occurrence Matrix (GLCM)-based Feature Extraction for Rice Leaf Diseases Classification
Herminarto Nugroho, Wahyu Agung Pramudito, Handoyo Suryo Laksono
Department of Electrical Engineering, Universitas Pertamina, Indonesia
ARTICLE INFORMATION |
| ABSTRACT |
Article History: Received 02 November 2023 Revised 03 October 2024 Published 21 January 2025 |
| 
In this paper, we propose Gray Level Co-Occurrence Matrix (GLCM) based Feature Extraction to identify and classify rice leaf diseases. An Artificial Neural Network (ANN) algorithm is used to train a classification model. Various statistical features such as energy, contrast, homogeneity, and correlation are extracted from the GLCM matrix to describe the image texture features. After feature removal, an ANN classification model was trained using a dataset consisting of images of healthy and diseased rice leaves. The ANN training process involves optimizing weights and bias using backpropagation to achieve accurate classification. After training, the ANN model is tested using split test data to measure classification performance. The experimental results show that the GLCM method is effective in helping improve accuracy, validation of accuracy, loss, validation of loss, precision, and recall. |
Keywords: Gray Level Co-Occurance Matrix; Artificial Intelligence; Feature Extraction; Neural Network; Image Classification |
Corresponding Author: Herminarto Nugroho, Universitas Pertamina, Jakarta, Indonesia. Email: herminarto.nugroho@universitaspertamina.ac.id |
This work is licensed under a Creative Commons Attribution-Share Alike 4.0 
|
Document Citation: H. Nugroho, W. A. Pramudito, and H. S. Laksono, “Gray Level Co-Occurrence Matrix (GLCM)-based Feature Extraction for Rice Leaf Diseases Classification,” Buletin Ilmiah Sarjana Teknik Elektro, vol. 6, no. 4, pp. 392-400, 2024, DOI: 10.12928/biste.v6i4.9286. |
- INTRODUCTION
The Central Bureau of Statistics (BPS) noted that the rice harvest area in Indonesia reached 10.61 million hectares with a production of 55.67 million tons of GKG [1]. The success of harvest and high production cannot be separated from the threat of diseases that attack rice plants. The threat of diseases that attack rice plants is much influenced by climate change, especially El Nino climate change. The success of rice harvest in 2022 is predicted to decrease due to the influence of El Nino climate change by 4.3% compared to the period January - April 2023 with the period January - April 2022. Data from the National Food Agency (Bapanas) processed from the Central Statistics Agency (BPS) shows that the realization of rice production in March 2023 was 5.12 million tons. This is lower than the projection of 5.38 million tons. The correction of rice production realization in March 2023 is the second time. Previously, in February 2023, the realization of rice production was 2.86 million tons, while the projection was 3.68 million tons [5].
The opinion of the Advisory Board of the Indonesian Agricultural Economics Association (Perhepi), Bayu Krisnamurthi, argues that in the medium term, the government needs to intensify the use of rice varieties that can survive in drylands, such as Inpari and Inpago [5]. There is another variety to deal with El Nino climate change, namely the Cihereng variety [6].
There were tests on disease development and growth of five rice varieties (Oryza Santiva L) with a block planting system. Tests were conducted on the varieties Logawa, Inpari 13, Ciherang, IR64, and Cibogo. Blast disease, Tungro, Bacterial Leaf Blight, Brown Spot, Leaf Blight, and Narrow Brown Spot were found [8]. There is an inventory of the types of diseases that attack the leaves of rice plants (Oryza Sativa L). The diseases that often appear on the leaves of rice plants are Bacterial Leaf Blight, Leaf Blast, Fusarium Leaf Disease (Brown Spot), Leaf Blade Blight, and Narrow Brown Leaf Spot Disease in the inventory [4].
The level of disease that generally occurs in rice is in the leaf area of rice. As explained in [8], there are several types of leaf diseases that usually attack rice, including Brown Spot, Bacterial Leaf Blight, Blast, Narrow Brown Spot, and Leaf Blister.
The presence of pests or diseases is one of the reasons why production yields often do not reach optimal levels. In [2], it is stated that diseases can cause up to 100% damage to plants, thus becoming one of the limiting factors between growth and production yields. The government has certainly conducted counseling, as in the Jombang district government conducted a strategy to overcome turbulence [3].
Extension is definitely for the success of rice harvesting, but there must be conditions where human error in farmers when in the field and high program procurement costs, a system is needed to minimize or even eliminate human error and reduce program procurement costs. Thus, Computer Vision is a non-destructive and potential solution to overcome this problem and provide consistent results. Therefore, a system is needed that helps to detect rice leaf diseases by favoring a system that does not use much Computation Power.
A system that does not use much Computation Power will be very helpful to farmers when faced with rice leaf diseases with a lack of internet facilities, moreover this system can support the enthusiasm of young farmers to learn rice farming with the equipment they often use, namely smartphones. So to reduce Computation Power in direct classification, an indirect classification system is used, namely by adding the Feature Extraction process. Computer Vision is a system solution to detect rice leaf disease because Computer Vision in practice often uses Machine Learning techniques to process and analyze visual data and involves the most important part of Computer Vision is Feature Extraction.
Feature extraction is the process of retrieving important features or characteristics from input data for use in data analysis or processing. In the context of image processing, features can be visual properties such as the shape, size, or color of objects in the image. These features are then used in applications such as image classification, image segmentation, or pattern recognition. This process aims to reduce the dimensionality of the input data and focus on the most important and meaningful features in a specific application. There are several methods in Feature Extraction, including Gray Level Co-Occurrence Matrix (GLCM), Scale-Invariant Descriptor Aggregation (SDA), Local Binary Patterns (LBP), Histogram of Oriented Gradients (HOG), Scale-Space Feature Detection, Haar-like Feature Detection, SURF (Speeded Up Robust Features), SIFT (Scale-Invariant Feature Transform), Wavelets Transform, Fractal Dimension Analysis, Principal Component Analysis (PCA), Independent Component Analysis (ICA), Deep-Learning Feature Extraction, Linear Discriminant Analysis (LDA), and Autoencoder.
There is a method that has good accuracy and computation time compared to other feature extraction methods, namely the GLCM method. The GLCM method is one of the feature extraction methods that has the advantages of spatial information, texture analysis, non-parametric, computationally efficient, and invariant to brightness and contrast [10][11]. The advantages of the GLCM method are very supportive in this experiment, namely efficient computing to be used when conditions without internet (Non-Cloud Computing) by farmers in rice fields that have minimal conditions for internet facilities [12][13].
There are several implementations of the rice leaf disease classification system. The first implementation titled Deep Learning for Rice Leaf Disease Detection in Smart Agriculture, carried out the creation of a mobile application using deep learning techniques. Specifically, it proposes using EfficientNet which is a variant in deep learning networks for classification. The approach also utilizes pre-trained models in imageNet for transfer learning. The proposed model can detect five types of images including three types of common diseases on rice leaves in Vietnam (e.g. brown spot, hispa, and leaf blast). Two other classes are also included such as healthy rice leaves and other leaves (grass, plants, etc). The model was trained on 1790 images and achieved 95% accuracy. The model was converted to tflite format to run on mobile or IoT devices. Finally, an Android app was built for rice leaf disease detection using the pre-trained model. When applying in practice on mobile devices, it takes about 1.7 seconds to detect and provide treatment solutions for a disease, so this could be a useful solution to help farmers. This work continues to be improved by collecting more data (both the number of images for each disease and other types of rice diseases) to retrain the model as well as to compare with other deep learning approaches. Moreover, the application will be developed for multi-platform so that it can be run on iOS devices [9][14]. The second implementation titled An IoT based System with Edge Intelligence for Rice Leaf Disease Detection using Machine Learning, is the creation of a system that will detect healthy and infected leaves automatically by favoring edge devices because many similar studies but use server-side processing which makes the cost not cheap. Raspberry Pi is used as an edge device that is low in cost and power consumption. The system can classify the leaves within 0.18 seconds to 0.25 seconds, and the accuracy of our image classification model is 97.50%. It is expected that this system contributes to the advancement of the agricultural sector of Bangladesh [7][20].
But of course a system is needed that requires high accuracy with efficient computation power from the problem of the agricultural sector on human error and the cost of use or the cost of implementing programs to overcome problems in rice leaf diseases, so in this final project discusses “Gray Level Co-Occurrence Matrix (GLCM) for feature extraction Rice Leaf Disease Classification System”. The completion of this problem used data on 5 rice leaf diseases, namely bacterial leaf blight, brown spot, healthy, leaf blast, leaf scald, and narrow brown spot. The basis for using 5 rice leaf diseases from journals (Negeri Padang et al., n.d.; Susanti et al., 2018). The feature extraction method used is GLCM with ANN classification algorithm method [21]-[24].
- METHODS
- Design Considerations
Aspects that are taken into consideration in designing this system include:
- Making Analysis of the feature extraction method is carried out only 1 method, namely the GLCM method. The selection of using the GLCM method is based on the following considerations:
- The function of the GLCM method is more suitable for identifying disease types that affect the texture of rice leaves, such as the presence of spots or distinctive motifs on the leaves.
- In using the GLCM method, texture features such as energy, contrast, homogeneity, entropy, and correlation can be extracted from rice leaf images [15],
- The GLCM method has relatively faster computation. This allows GLCM to be used in applications that require real-time image processing, such as classification of rice leaf diseases in the field.
- The classification algorithm used is the ANN algorithm. The use of ANN algorithm is based on the following considerations:
- Able to handle highly complex and non-linear data
- Has the ability to perform good modeling on unstructured data
- Able to perform classification and regression simultaneously
- Has the ability to adapt to data changes
- Creating a model that is in accordance with the dataset used in order to provide high accuracy results so that the model created can classify rice leaf diseases accurately. At the stage of modeling the level of accuracy and val accuracy will affect the results of the classification so that making a model that is in accordance with the dataset will greatly affect the results of the system created.
- The dataset used has more than 1400 example images for each input disease data, this needs to be developed in pre-processing to obtain a lot of data and aims to provide good accuracy results, the more diverse the example images in the dataset, the higher the accuracy of the system to classify. In this design, the example image dataset used is sourced from the Kaggle platform uploaded by Ade Fiqri. the dataset has 6 classes of rice leaf disease classification and each type has more than 1400 example images.
- Design Specifications
In designing this Final Project, design specifications are used as in the following Table 1:
Table 1. Design Specifications
Specifications | Target | Reason |
Classification Accuracy | 90 % | Targeted 90% because the reference journal produced an accuracy of 88.6% with the ANN method and its classification of two rice leaf diseases, namely Leaf Blast and Brown Spot |
Classification Execution Time | 4 s | The target is 4 s because based on several references, the average execution time is 4 s with the estimated processors used at that time Intel Core i7-8700K, AMD Ryzen 7 1800X, Intel Core i5-7600K, AMD Ryzen 5 1600X, and Intel Core i3-7100. While in the use of the design later used Intel Core i5-11400H |
- Technical Analysis
- Dataset Collection
Datasets for experiments were obtained from the Kaggle website (https://www.kaggle.com/datasets/adefiqri12/riceleafsv3). In the dataset has 6 classes of rice leaf disease classification and each type is done data augmentation process with horizontal flip and vertical flip process, at first the average consists of 350 images / images and after the process has more than 1400 example images each class.
- Pre-Processing
Data pre-processing using image augmentation [16][17]. Dataset is an important factor, the more datasets the better the ability of the classification system created. To multiply the images you have, you can use the image augmentation method. This method can multiply images by changing the original image into a different form by rotating the image, adding noise and flipping the image so that the image has more and more.
- Feature Extraction
Feature Extraction is a textural feature extraction of rice leaf images using one of the feature extraction methods. The function of feature extraction on the processed image is to reduce dimensionality, improve classification performance, increase interpretability, and reduce overfitting.
- Classification
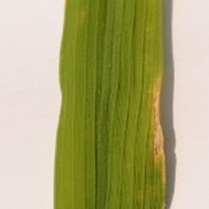
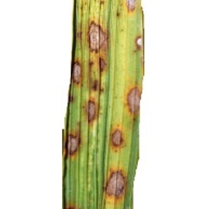
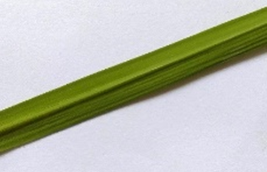
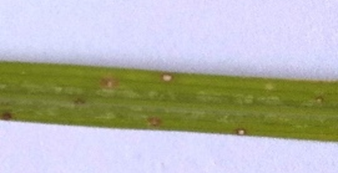
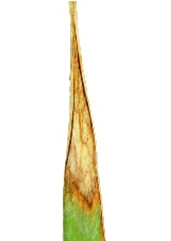
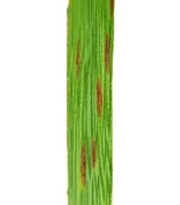
Classification is a method that can be used in predicting labels or categories on unknown data based on examples of pre-existing data that have been labeled or categorized can be seen in Figure 1. The purpose of classification is to build a model or algorithm that can recognize input data patterns and predict the appropriate output class [18][19].
| 
| 
|
Bacterial Leaf Blight | Brown Spot | Healthy |
1400 | 1492 | 1484 |
| 
| 
|
Leaf Blast | Leaf Scald | Narrow Brown Spot |
1452 | 1432 | 1408 |
Figure 1. Rice leaf disease names and sample images
- RESULT AND DISCUSSION
In this result and discussion, we obtained some of the best parameters from each method used, such as ANN, GLCM+ANN, and CNN methods. The following are the best parameters of the method can be seen in Table 2. In the comparison of the results of each method, the best parameter level is obtained in the combination of feature extraction combined with ANN classification algorithm.
Table 2. Comparison of results on ANN, GLCM+ANN, and CNN Methods
| ANN | GLCM+ANN | CNN |
epoch | 100 | 100 | 30 |
Time/Epoch (s) | 9,40 s | 3,13 s | 188 s |
accuracy | 93.18% | 97.38% | 95.75% |
validation accuracy | 91.06 | 96.89% | 93.58% |
loss | 0.1816 | 0.0396 | 0.1189 |
validation loss | 0.2176 | 0.0224 | 0.1355 |
precision | 91.364583% | 97.2089% | 93.6667%. |
recall | 91.2535% | 97.0529% | 93.6667%. |
- Implementation of Gray Level Co-Occurrence Matrix (GLCM) for Feature Extraction of Rice Leaf Disease Classification System
In this design experiment using data scenarios on training data and testing data that have different divisions and include the number of learning rates used, namely 0.0001 and the number of epochs used 100. Table 3 is the accuracy and loss results obtained from the data scenario test.
Based on Table 3 Data Scenario shows the accuracy results in 3 Data Scenario conditions with data division (Training: Validation) of (80:20), (70:30), and (60:40) which are not significantly different, which is above 90%. The accuracy validation results show results that are not significantly different as well, which is above 90% as well. The loss results in each condition have results that are not significantly different and likewise in validation loss. In the results of each condition, it can be seen that the Scenario Data condition with data division (Testing) of (80:20) has better accuracy and loss results compared to other Scenario Data comparisons. Scenario Data with data division (Training: Testing) of (80: 20) has an accuracy result of 97.38% with an accuracy validation result of 96.89% and a loss result of 0.0396 with a validation loss of 0.0224 which shows the use of Scenario Data with data division (Training: Testing) of (80: 20) results in better accuracy and validation or close to 100% and has better loss and validation loss or close to 0. this shows that the data division condition (Training: Testing) of (80: 20) separates different tasks in the learning process and improves overall model performance.
Table 3. Data Scenario (Training:Validation)
Scenario Data (Training:Validation) | Accuracy (%) | Validation Accuracy (%) | Loss | Validation Loss | Time/Epochs (s) |
(80:20) | 97.38 | 96.89 | 0.0396 | 0.0224 | 3.13 |
(70:30) | 95.07 | 94.12 | 0.0346 | 0.0337 | 5.25 |
(60:40) | 97.23 | 95.76 | 0.0272 | 0.0640 | 3.17 |
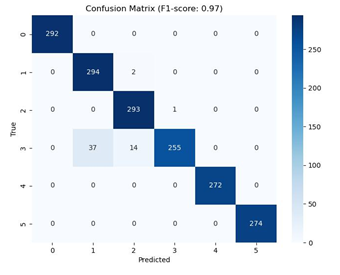
The following are the plot results of accuracy, accuracy validation, loss, loss validation, precision, precision validation, recall, recall validation, and confusion matrix on the condition of data sharing (Training: Testing) of (80:20) can be seen in Figure 2.
The accuracy of the model accuracy on the training data seems to increase from the 50th epoch of about 96.99% to about 97.38% in the 100th epoch and the accuracy on the validation of the model accuracy on the training data seems to increase from the 50th epoch of about 96.71% to about 96.89% in the 100th epoch. The changes that occur in accuracy and validation accuracy at each epoch indicate that the model generally learns well from the training data during the running epochs can be seen in Figure 3.
At the 50th epoch, the loss on the training data was 0.0848 and tended to decrease or improve as the number of epochs increased until the 100th epoch had a value of 0.0396. This shows that the model has successfully learned from the training data and is approaching the desired performance. In the validation data, the loss tends to decrease or improve after each epoch runs, as indicated by the 50th epoch having a validation loss value of 0.0893 and the 100th epoch having a validation loss value of 0.0224. This condition can be a sign that there is no overfitting in the model. This indicates that the model is trying to adjust the training and validation data can be seen in Figure 4.
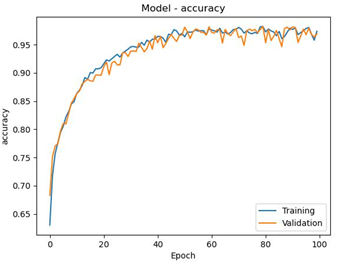
Figure 2. Accuracy and validation accuracy at (80:20)
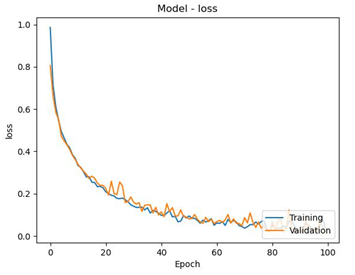
Figure 3. Loss and validation loss at (80:20)

Figure 4. Confusion Matrix at (80:20)
After knowing the precision and recall results in class 0 or bacterial leaf blight, class 1 or brown spot, and class 2 or healthy from the confusion matrix, the next process is calculating the precision and recall results in class 3 or leaf blast, class 4 or leaf scald, and class 5 or narrow brown spot. The precision and recall results for each class are described in Table 4. The following is a table of precision and recall results for each class.
Table 4. Precision and recall values for each class
Class | Precision Value | Recall Value |
0 | 1 | 1 |
1 | 0.888218 | 0.993243 |
2 | 0.94822 | 0.996599 |
3 | 0.996094 | 0.833333 |
4 | 1 | 1 |
5 | 1 | 1 |
In Table 4, the Precision and Recall Values for each class show that class 0 has a precision value of 1 and a recall value of 1, which means that false positives and false negatives have a value of 0. The occurrence of false positives and false negatives with a value of 0 means that the model system is processing better or there are no false positives and false negatives. Class 1 shows a low precision value compared to other classes, this shows that the value of false positives is getting bigger. The larger the false positive value, the more rice leaf plants have class 1 disease but are processed as other classes and class 3 shows a low recall value compared to other classes, this shows that the value of false negatives is getting bigger. The larger the false negative value, the more rice leaf plants have class 3 disease but are processed as class 3. In Table 4 Precision and Recall Values, there is an interesting discussion in classes 1, 2, and 3, the interesting discussion is in the form of system processing that considers class 3 to be class 1 and class 2. Analysis is carried out by paying attention to the class 3 image which is like the class 1 and 2 images. The following are images of classes 1, 2, and 3 in Table 5.
Table 5. Images of classes 1, 2, and 3
Based on Table 5, it can be observed that there are several special characteristics that are considered by the system such as class 3 or leaf blast in class 1 or brown spot and class 2 or healthy, such as the oval shape of rice disease on class 3 rice leaves or leaf blast accompanied by white spots in it which is also almost the same as class 1 or brown spot and class 3 rice leaf disease which is very small in its indication to indicate disease on the leaves which shows almost the same as class 2 or healthy disease.
In Table 4, the Precision and Recall values for each class can be calculated for the overall precision and recall values. The following is the calculation of precision and recall values based on equation (1) and equation (2):
The overall precision value is 0.972089 or 97.2089%. The following is the overall value of Recall:
The overall recall value is 0.970529 or 97.0529%.
- CONCLUSION
The GLCM method using the ANN classification algorithm obtained the best accuracy and loss values in the training and validation data division method of 80:20 with an influence on the learning rate of 0.0001 and epoch of 100 which resulted in an accuracy value of 97.38%, validation accuracy of 96.89%, loss of 0.0396, validation loss of 0.0224, precision of 97.2089%, and recall of 97.0529% based on the stability of the training and validation data on the graph, this shows that the GLCM method has an effect on accuracy and loss and is supported by increasingly better precision and recall with the influence of the features processed in the GLCM method.
REFERENCES
- Badan Pusat Statistik(BPS - Statistics Indonesia). Pada 2022, luas panen padi mencapai sekitar 10,45 juta hektar dengan produksi sebesar 54,75 juta ton GKG. 2023. https://www.bps.go.id/id/pressrelease/2023/03/01/2036/.
- N. Thakur, S. Kaur, P. Tomar, S. Thakur, and A. N. Yadav, “Microbial biopesticides: current status and advancement for sustainable agriculture and environment,” In New and future developments in microbial biotechnology and bioengineering, pp. 243-282, 2020, https://doi.org/10.1016/B978-0-12-820526-6.00016-6.
- X. Zhang, Z. Cao and W. Dong, "Overview of Edge Computing in the Agricultural Internet of Things: Key Technologies, Applications, Challenges," in IEEE Access, vol. 8, pp. 141748-141761, 2020, https://doi.org/10.1109/ACCESS.2020.3013005.
- J. E. Groce, M. A. Farrelly, B. S. Jorgensen, and C. N. Cook, “Using social‐network research to improve outcomes in natural resource management,” Conservation Biology, vol. 33, no. 1, pp. 53-65, 2019, https://doi.org/10.1111/cobi.13127.
- K. P. Devkota, C. M. Khanda, S. J. Beebout, B. K. Mohapatra, G. R. Singleton, and R. Puskur, “Assessing alternative crop establishment methods with a sustainability lens in rice production systems of Eastern India,” Journal of cleaner production, vol. 244, p. 118835, 2020, https://doi.org/10.1016/j.jclepro.2019.118835.
- P. Schneider and F. Asch, “Rice production and food security in Asian Mega deltas—A review on characteristics, vulnerabilities and agricultural adaptation options to cope with climate change,” Journal of Agronomy and Crop Science, vol. 206, no. 4, pp. 491-503, 2020, https://doi.org/10.1111/jac.12415.
- S. M. Shahidur Harun Rumy, M. I. Arefin Hossain, F. Jahan and T. Tanvin, "An IoT based System with Edge Intelligence for Rice Leaf Disease Detection using Machine Learning," 2021 IEEE International IOT, Electronics and Mechatronics Conference (IEMTRONICS), pp. 1-6, 2021, https://doi.org/10.1109/IEMTRONICS52119.2021.9422499.
- A. S. Mahmad-Toher, N. Govender, D. Dorairaj, and M. Y. Wong, “Comparative evaluation on calcium silicate and rice husk ash amendment for silicon-based fertilization of Malaysian rice (Oryza sativa L.) varieties,” Journal of Plant Nutrition, vol. 45, no. 9, pp. 1336-1347, 2022, https://doi.org/10.1080/01904167.2021.2014878.
- N. Thai-Nghe, N. T. Tri, and N. H. Hoa, “Deep Learning for Rice Leaf Disease Detection in Smart Agriculture,” In Lecture Notes on Data Engineering and Communications Technologies, vol. 124, pp. 659–670, 2022, https://doi.org/10.1007/978-3-030-97610-1_52.
- P. K. Mall, P. K. Singh and D. Yadav, "GLCM Based Feature Extraction and Medical X-RAY Image Classification using Machine Learning Techniques," 2019 IEEE Conference on Information and Communication Technology, Allahabad, India, 2019, https://doi.org/10.1109/CICT48419.2019.9066263.
- V. Durgamahanthi, J. Anita Christaline, and A. Shirly Edward, “GLCM and GLRLM based texture analysis: application to brain cancer diagnosis using histopathology images,” In Intelligent Computing and Applications: Proceedings of ICICA 2019, pp. 691-706, 2021, https://doi.org/10.1007/978-981-15-5566-4_61.
- Y. Gupta, R. K. Lama, S. W. Lee, and G. R. Kwon, “An MRI brain disease classification system using PDFB-CT and GLCM with kernel-SVM for medical decision support,” Multimedia Tools and Applications, vol. 79, no. 43, pp. 32195-32224, 2020, https://doi.org/10.1007/s11042-020-09676-x.
- S. Singh, D. Srivastava and S. Agarwal, "GLCM and its application in pattern recognition," 2017 5th International Symposium on Computational and Business Intelligence (ISCBI), pp. 20-25, 2017, https://doi.org/10.1109/ISCBI.2017.8053537.
- K. T. Islam, R. G. Raj and A. Al-Murad, "Performance of SVM, CNN, and ANN with BoW, HOG, and Image Pixels in Face Recognition," 2017 2nd International Conference on Electrical & Electronic Engineering (ICEEE), pp. 1-4, 2017, https://doi.org/10.1109/CEEE.2017.8412925.
- L. G. Almeida, M. Backović, M. Cliche, S. J. Lee, and M. Perelstein, “Playing tag with ANN: boosted top identification with pattern recognition,” Journal of High Energy Physics, vol. 2015, no. 7, pp. 1-21, 2015, https://doi.org/10.1007/JHEP07(2015)086.
- C. U. Kumari, S. Jeevan Prasad and G. Mounika, "Leaf Disease Detection: Feature Extraction with K-means clustering and Classification with ANN," 2019 3rd International Conference on Computing Methodologies and Communication (ICCMC), pp. 1095-1098, 2019, https://doi.org/10.1109/ICCMC.2019.8819750.
- L. Gómez-Chova, D. Tuia, G. Moser and G. Camps-Valls, "Multimodal Classification of Remote Sensing Images: A Review and Future Directions," in Proceedings of the IEEE, vol. 103, no. 9, pp. 1560-1584, 2015, https://doi.org/10.1109/JPROC.2015.2449668.
- M. A. Chandra and S. S. Bedi, “Survey on SVM and their application in image classification,” International Journal of Information Technology, vol. 13, no. 5, pp. 1-11, 2021, https://doi.org/10.1007/s41870-017-0080-1.
- Z. Akata, F. Perronnin, Z. Harchaoui and C. Schmid, "Good Practice in Large-Scale Learning for Image Classification," in IEEE Transactions on Pattern Analysis and Machine Intelligence, vol. 36, no. 3, pp. 507-520, 2014, https://doi.org/10.1109/TPAMI.2013.146.
- N. Aggarwal and D. Singh, “Technology assisted farming: Implications of IoT and AI,” In IOP Conference Series: Materials Science and Engineering, vol. 1022, no. 1, p. 012080, 2021, https://doi.org/10.1088/1757-899X/1022/1/012080.
- T. N. Gia, L. Qingqing, J. P. Queralta, Z. Zou, H. Tenhunen and T. Westerlund, "Edge AI in Smart Farming IoT: CNNs at the Edge and Fog Computing with LoRa," 2019 IEEE AFRICON, pp. 1-6, 2019, https://doi.org/10.1109/AFRICON46755.2019.9134049.
- Y. Akkem, S. K. Biswas, and A. Varanasi, “Smart farming using artificial intelligence: A review,” Engineering Applications of Artificial Intelligence, vol. 120, p. 105899, 2023, https://doi.org/10.1016/j.engappai.2023.105899.
- M. Gardezi, et al., “Artificial intelligence in farming: Challenges and opportunities for building trust,” Agronomy Journal, vol. 116, no. 3, pp. 1217-1228, 2024, https://doi.org/10.1002/agj2.21353.
- M. Deivakani, C. Singh, J. R. Bhadane, G. Ramachandran and N. Sanjeev Kumar, "ANN Algorithm based Smart Agriculture Cultivation for Helping the Farmers," 2021 2nd International Conference on Smart Electronics and Communication (ICOSEC), pp. 1-6, 2021, https://doi.org/10.1109/ICOSEC51865.2021.9591713.
Gray Level Co-Occurrence Matrix (GLCM)-based Feature Extraction for Rice Leaf Diseases Classification (Herminarto Nugroho)