Buletin Ilmiah Sarjana Teknik Elektro ISSN: 2685-9572
Flood Detection Design based on the Internet of Things
Freddy Artadima Silaban 1, Yufimar Taufiq 2, Lukman Medriavin Silalahi 3,
Grace Lamudur Arta Sihombing 4
1,2,3 Department of Electrical Engineering, Universitas Mercu Buana, Jakarta, Indonesia
4 Department of Information Technology, Institut Agama Kristen Negeri, Tarutung, Indonesia
ARTICLE INFORMATION |
| ABSTRACT |
Article History: Submitted 22 September 2023 Revised 26 October 2023 Accepted 09 November 2023
|
| 
Flood detection devices and water levels from several previous research studies were not optimal because they were still running and manual information, such as through loudspeakers, in some research, electronic devices have been used, but no information has been obtained, and it is not optimal if there is a danger sign. So this research is a study on the development of an automatic flood detection system and water level based on the IoT (Internet of Things). The system uses a NodeMCU Esp8266 controller with a combination of potentiometer sensors mounted on a water-level mechanic and connected to the Thingspeak IoT platform. Based on the results of the analysis and testing that have been done, the system is designed to combine the previous research algorithms so that it works more optimally and is better. The flood detection system and water level are made in two parts: one is placed upstream and the other is placed downstream, where the devices are connected. The device will turn on a danger alert when the altitude percentage is more than 85% of the maximum height. The lag time in the upload and download process is included in the Fast category (≤10 seconds). The resulting information can be monitored through the media portal website. |
Keywords: Flood; Water Level; Internet of Things; NodeMCU; Sensors; Website |
Corresponding Author: Freddy Artadima Silaban, Department of Electrical Engineering, Universitas Mercu Buana, Meruya Selatan, Kembangan, Jakarta Barat 11650, Indonesia. Email: freddy.artadima@mercubuana.ac.id |
This work is licensed under a Creative Commons Attribution-Share Alike 4.0 
|
Document Citation: F. A. Silaban, Y. Taufiq, L. M. Silalahi, and G. L. A. Sihombing, “Flood Detection Design based on the Internet of Things,” Buletin Ilmiah Sarjana Teknik Elektro, vol. 5, no. 4, pp. 427-437, 2023, DOI: 10.12928/biste.v5i4.9209. |
- INTRODUCTION
The frequent occurrence of floods in various regions is one of the factors related to this research. The causes of flooding include high rainfall and environmental conditions that have begun to deteriorate, especially in river areas [1]–[5], because the function of riverbanks as water catchment areas and green areas has begun to disappear. If there is high-intensity rain accompanied by large amounts of water from upstream to downstream, it can make the water space narrow and clogged so that water can overflow into residential areas [6]–[8]. The lack of information obtained by the community around the river at the time of a flood has made people unable to prepare themselves [9]–[10]. Therefore, it is necessary to make a tool for the early detection of floods [11]–[13].
In previous research, many have discussed the real-time IoT-based water level monitoring system from the riverbank using the NodeMCU Esp8266 controller [14]–[18], but the interface method of reading results and components used, in my opinion, is still inefficient [19]–[20]. Therefore, research uses a water level sensor with design mechanics that can provide notifications in the form of a water level graphic on the media website and can provide information to the public to anticipate flood disasters. So the research focuses on developing a flood detector and a water level detector based on the IoT (Internet of Things) [21]–[22].
The steps taken start with calibrating the water level sensor to determine the value of the sensor reading so that it is following the actual situation, then creating a website display that is used to display the water level sensor readings on the IoT Thingspeak platform [23]–[27]. One of the functions of this design is to provide warnings for areas that are frequently flooded. Flood warning in the form of an alarm and level height monitoring on the website The tools used are expected to work effectively with environmental conditions that require the sensor to have a long-term lifetime, and the accuracy of sensor readings can also be better than previous research, given that the components used are mechanically based and the signal obtained by analog data is converted into digital data by the controller..
- METHODS
In the design and development of a flood detection device and water level based on IoT (Internet of Things), several steps must be done to make a device that has been designed, the stages are:
- Architecture Tool Development
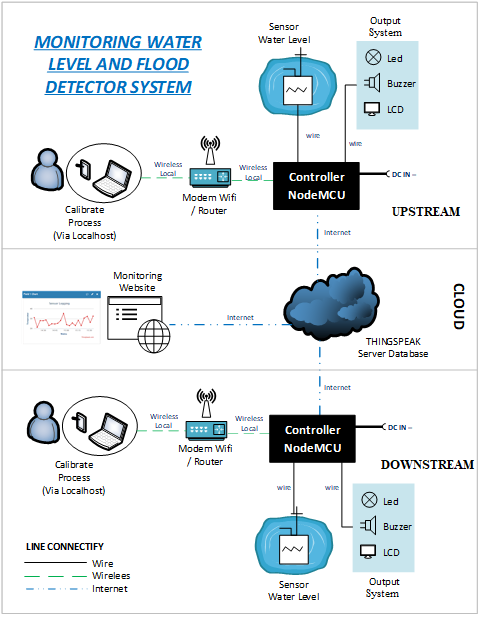
The system created is a control system that can be used to monitor water levels via the internet using the Thingspeak server. Using the Thingspeak server, devices can be connected. If the equipment upstream reads the water level rising and crossing the safe limit, then the alarm will go off, and the downstream equipment will also fire an alarm warning because there could be a potential for flooding in the area. The data that is on the Thingspeak server can also be displayed on the website so that users can see details of the water level in a certain area can be seen in Figure 1.
After the architectural development research was done, it was continued to make block circuit diagrams, which are one of the most important parts of designing a tool because from this block diagram, it can be seen how the entire circuit works. So that the entire block circuit diagram illustrates how the tools are made. Before looking at the block diagram, you must know the work flow of the block diagram for the system being designed shown in the Figure 2.
DC power supply as the input voltage for controller power consumption. Voltage Regulator: a voltage decrease from ± 9V to ± 5V as input to the VIN NodeMCU. The NodeMCU controller, the main component of the tool, functions to regulate the overall system performance and get a ± 5V supply. A water level is an object that is controlled and monitored in this system. The Water Level Sensor, a component used to determine the value of the object being measured, uses a mechanical pulley method that rotates the potentiometer. A laptop or smartphone device is a device used for the tool calibration process. It has to be connected to the same network as NodeMCU via the same router or modem. How to access the calibration menu using the IP (Internet Protocol) address, which can be found on the modem or router interface settings menu The WiFi modem is used so that the system can connect to the internet. Thingspeak is an IoT (Internet of Things) platform that functions as a server from NodeMCU for a database feature that stores sensor data. The website functions to display water level information on the database server.
Figure 1. Design and development architecture
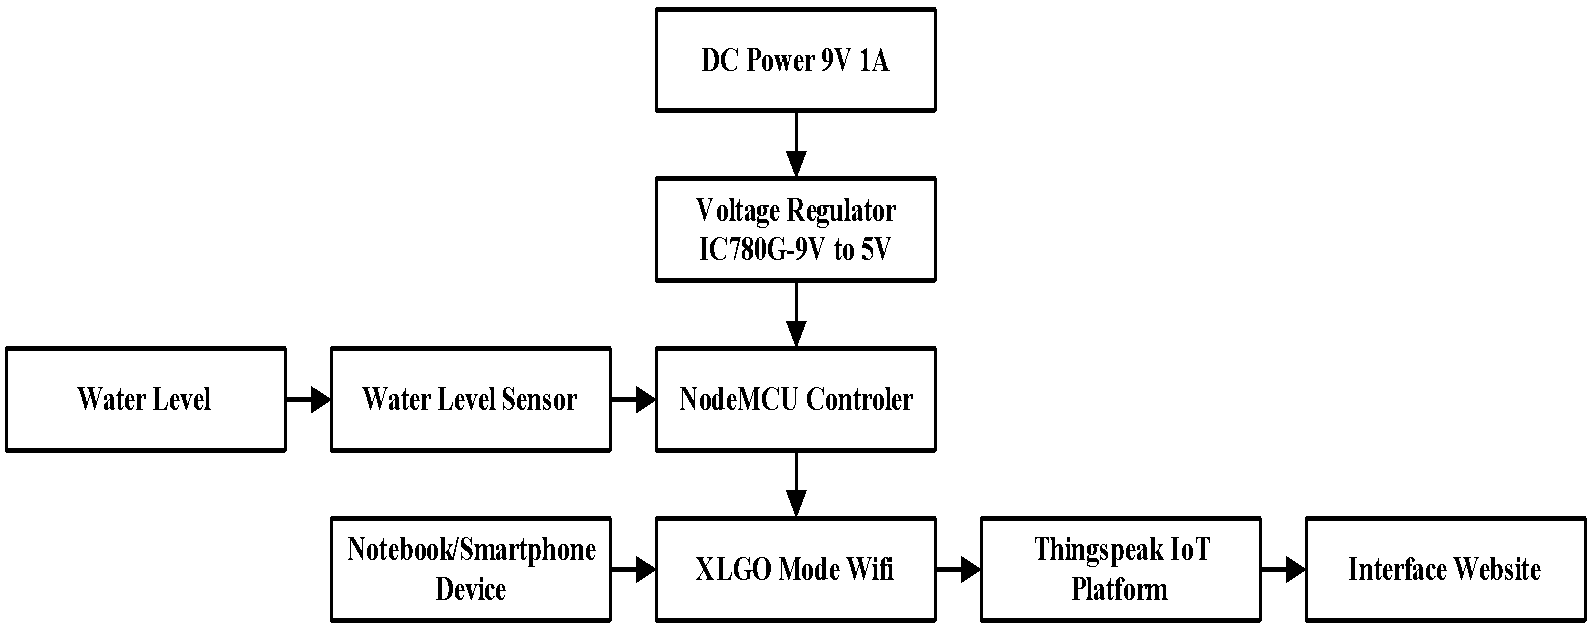
Figure 2. Development block diagram
- Water Level Sensor Design
In general, most people use ultrasonic sensors to measure the water level, but in this research and development study, a river water level sensor uses the float method, which is mechanically arranged. The water level sensor is placed in the water so that the float can float and go up and down to adjust the water level. The sensor mechanic that is made can be applied to the water level monitoring system; the sensor design can be used for measurements at river locations because the material used is iron; the tool can be used in the long term, given the erratic river water conditions; so in designing the sensor, one must pay attention to the life condition of the sensor that is made so that it can last a long time with the conditions in which this sensor will be placed. The sensor design used uses the pulley method, which will pulley between the float and the ballast.
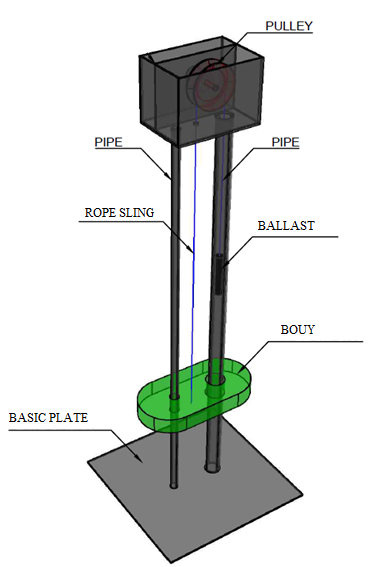
Figure 3. Buoy sensor design
- Sensor Weight Calculations
The sensor for measuring the water level uses the pulley method, which involves a ballast on the side of the float and a weight in the pipe. The working principle of this sensor is that the ballast on the buoy must be heavier than the ballast in the pipe. This functions so that when the float is lifted by rising water, the ballast pulls the rope that surrounds the pulley, thus making the potentiometer sensor rotate too, and when the water condition decreases, the buoy also drops and pulls back the ballast in the lifted pipe. Taking into account the ballast used, the following data.
So the data is obtained that  , so the amount of power (weight in the pipe) to pull the load is equal to the weight of the load
  , while the mechanical advantage of the pulley can still be calculated, as can be seen in the equation (1).
| 
| (1) |
If the mechanical advantage that is obtained is 1, then the force required to lift the buoy load is the same as the weight of the ballast load in the pipe itself. The weight on the pipe, which functions as the force  , is lifted if the buoyancy load decreases or the water condition decreases, and when the water rises, the load is also lifted by the pulling force from Fk because it gets help from the buoyancy force water.
- Sensor Data Calculations
Sensor data calculations are used for data processing in programming, data that must be known, among others, pulley data used. Pulley Data, Pulley diameter (D) 68 mm, Radius (R) is 34 mm, Maximum Circumference of Pulley (1x round) (K1x) is 214 mm. After the pulley data is obtained, it is combined with the potentiometer data as follows, Pulley X Potentiometer data, Potentiometer Resistance Value (Resistance) is 10000 Ω, Potentiometer Rotation Maximum (N) is 10 × round, Digital sensor data (10 x round) (DataDigital10x) is 1024, Ratio K pulley ÷ K timing potentio is 1.25, Maximum Circumference of Pulley (10 x round) or the maximum height that can be measured (K1x × n) is 1710 Mm, Digital sensor data (1x round) (DataDigital1x) is 102.40, and Maximum Circumference of Pulley (1x round) (K10x / n) is 170.97 Mm.
After the pulley and potentiometer data are combined, it is then combined with the mechanical data from the float sensor. Pulley Data x Potentiometer x Buoy Sensor, Maximum height measured (H) is 1000 mm, Digital sensor data is 599, Condition of Actual Altitude is 200 Mm, Current sensor data is 255, Data lower limit is 241.4, and Data upper limit is 734.1.
Several values are in yellow, which indicates that the value can be changed according to the actual condition of the float sensor. After the pulley calculation process, potentiometer, and float sensor are combined, the required range data is obtained from the minimum to the maximum height of 479, and that value is processed in programming.
- Website Interface Design
The website interface developed is to use a blog site, namely Blogger, because bloggers already support HTML programming for templates and uploaded content. The HTML code for widgets can be obtained directly from the Thingspeak channel that was previously created. The website interface in this study can be accessed at the following address: HTTP://waterlevel.iot.blogspot.com/2020/06/monitoring.html, Here is the appearance of the website page:
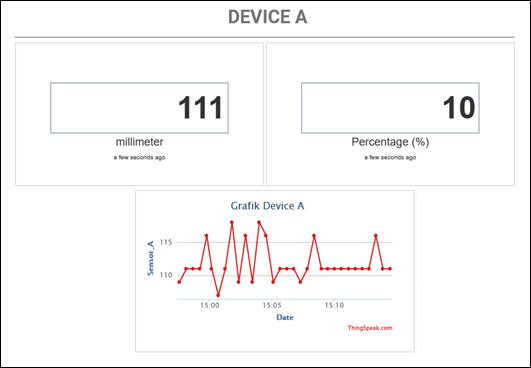
Figure 4. Website interface display
- RESULT AND DISCUSSION
At this stage, it is a process of willingness to develop and analyze all the data that has been taken. Three points are discussed in the analysis of this research, according to the tests that have been carried out, and all are related to the performance of the tools made.
- Sensor Trial Analysis
The sensor analysis stage is the process of determining whether the sensor can be used and applied to the system being created. The number of data samples taken in the Device A test is based on the total number of maximum potentiometer turns. The potentiometer used on Device A has a maximum of 10 rounds, so for the data taken, 11 data points, starting from 0x turns to 10x rounds. On Device B, because the type of potentiometer used is different, the number of data samples taken is also different. The potentiometer used has a resistance value of 1k. The data taken in the analysis of the sensor test results are the number of potentiometer turns (for device A) and the degree of potential rotation (for device B), the amount of resistance R1 and R2 on the potentiometer, analog data output in the form of voltage accompanied by a percentage, and digital data output. in the form of 10-bit digital data along with the percentage. Based on the data in Tables 1 and Table 2, namely the test table for sensor test devices A and B, the sensor test results are obtained for the analysis process of whether the sensor can be used in the system.
Table 1. Test results for sensor device A
No | Potentiometer | Output |
Round | R1
(Ω) | R2
(Ω) | Analog Sensor Data | Digital Sensor Data |
Voltage (V) | Percentage (%) | Data 10-bit | Percentage (%) |
1 | 0x | 0 | 9980 | 0 | 0.00% | 0 | 0.00 |
2 | 1x | 979 | 9006 | 0.38 | 9.97% | 110 | 10.74 |
3 | 2x | 1995 | 7998 | 0.75 | 19.69% | 222 | 21.68 |
4 | 3x | 2980 | 6990 | 1.13 | 29.66% | 334 | 32.62 |
5 | 4x | 4010 | 5975 | 1.52 | 39.90% | 448 | 43.75 |
6 | 5x | 4950 | 4930 | 1.88 | 49.34% | 553 | 54.00 |
7 | 6x | 5890 | 4050 | 2.27 | 59.58% | 660 | 64.45 |
8 | 7x | 7010 | 2850 | 2.65 | 69.55% | 777 | 75.88 |
9 | 8x | 7920 | 1910 | 3.03 | 79.53% | 895 | 87.40 |
10 | 9x | 8890 | 1050 | 3.41 | 89.50% | 1000 | 97.66 |
11 | 10x | 9950 | 20 | 3.81 | 100.00% | 1024 | 100.00 |
Table 2. Test results for sensor device B
No | Potentiometer | Output |
Round | R1
(Ω) | R2
(Ω) | Analog Sensor Data | Digital Sensor Data |
Voltage (V) | Percentage (%) | Data 10-bit | Percentage (%) |
1 | 0° | 2 | 989 | 0 | 0.00% | 2 | 0.20% |
2 | 75° | 201 | 7699 | 0.9 | 23.68% | 250 | 24.41% |
3 | 150° | 498 | 467 | 1.9 | 50.00% | 500 | 48.83% |
4 | 225° | 771 | 213 | 2.7 | 71.05% | 800 | 78.13% |
5 | 300° | 990 | 4 | 3.8 | 100.00% | 1024 | 100.00% |
Table 1 and Table 2 are tables to show the output percentage value in both analog and digital data. The percentage is obtained from the comparison of the output value with the maximum value of the output data. The analog data output range value is 0 V to 3.78 V, which is obtained from the internal NodeMCU analog pin process. While the maximum value for digital data is 0–1023, the data is the result of analog data conversion. The results of the percentage data can be seen in Figure 5 and Figure 6.
Figure 5 and Figure 6 show the output data for devices A and B. The graph shows that with each rotation of the potentiometer, the resistance values r1 and r2 change and affect the analog and digital outputs that enter NodeMCU, so the percentage graph tends to go up, which means the sensor is in the state of being ready to use.
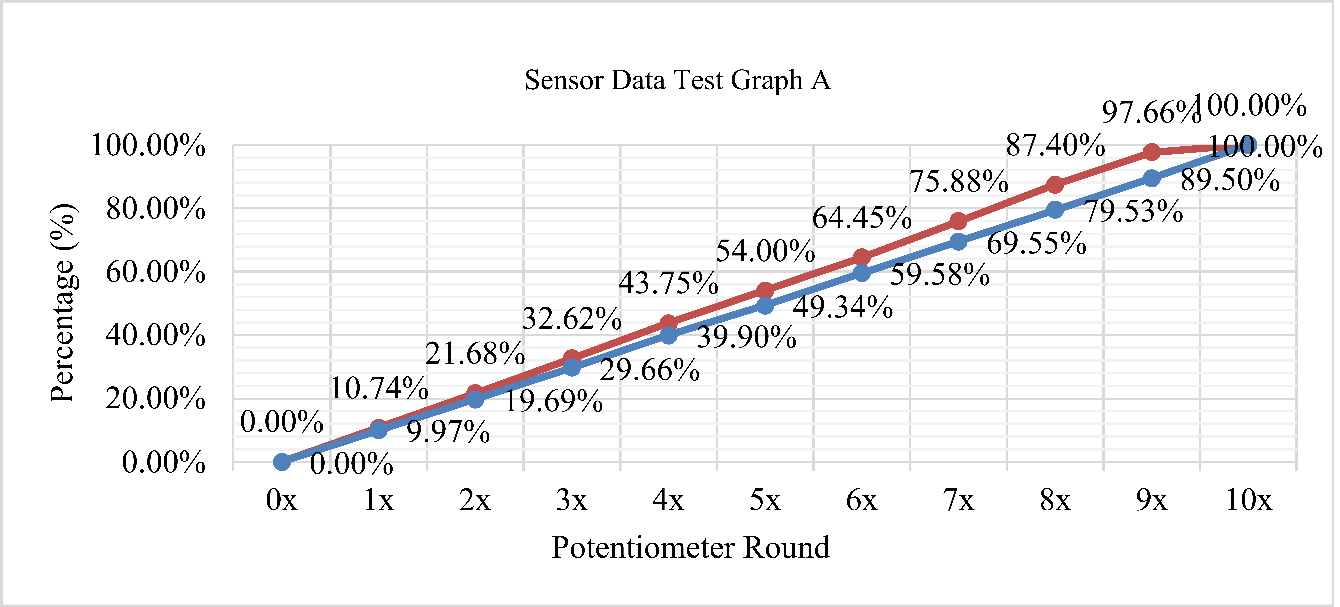
Figure 5. The percentage result of Device A sensor output
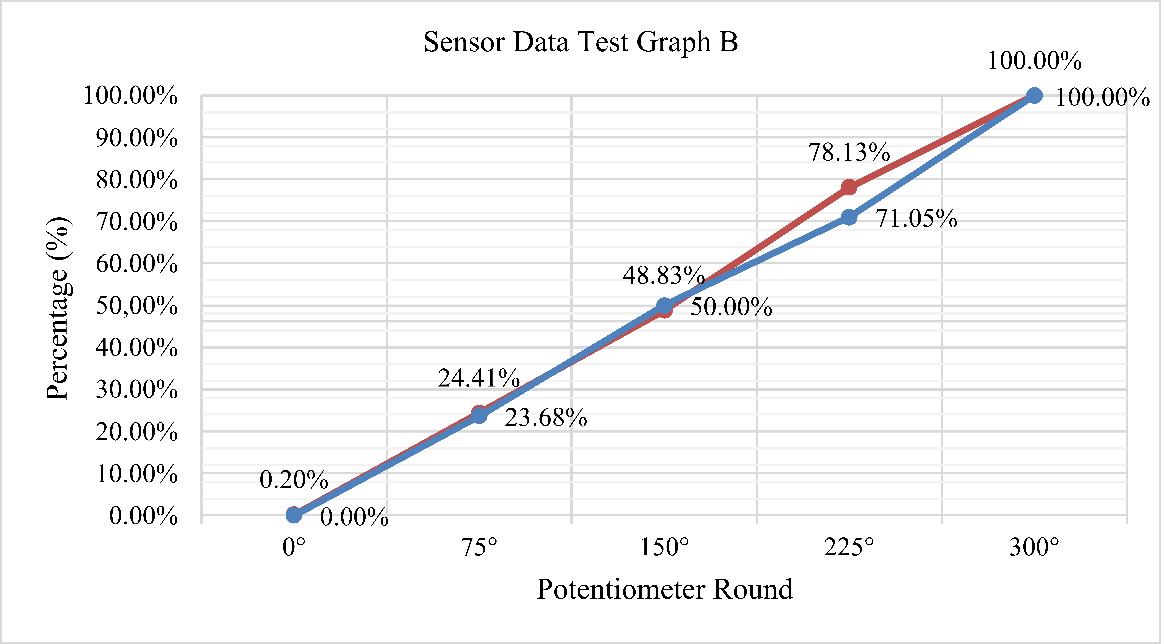
Figure 6. The result of the percentage output the device sensor B
- Calibration Analysis Tool
The sensor calibration stage is the process of adjusting the sensor data to the actual altitude data. This calibration process is done via the localhost web, which can be accessed via the IP address (internet protocol) of each device.
After the calibration web opens, the data that must be filled in is the maximum height of the sensor and the percentage limit. Press the Min button when the position of the mechanical sensor is minimal, and press the Max button for the maximum sensor height position. After the data is entered, the calibration process is complete. However, the controller cannot be connected to the Thingspeak platform before pressing the Thingspeak button. The following is a table of results from the calibration test for devices A and B can be seen in Table 3.
Table 3. Device calibration test results
Device | Maximum Height of Sensor (mm) | Range Data | Limit |
Min | Max | Distance | Limit Percentage | Data Sensor | Height (mm) |
A | 1100 | 303 | 962 | 659 | 85% | 863 | 935 |
B | 1100 | 130 | 734 | 604 | 85% | 643 | 935 |
In device A, the maximum height is set to 1100 mm, with a minimum range of 303, and a maximum range of 962, so the difference between the max and min ranges is 659 and the percentage limit is 85%. The results of the calibration data can be calculated by equation (2).
Sensor data limit is the process of knowing the data sensor value when the limit condition is reached, meaning that this data value becomes the limit for the tool's danger sign. The data limit value is obtained when the percentage of 85% is 863; if the sensor value exceeds the value of the sensor data limit, the DANGER sign lights up. Limit altitude data is a process to find out what the actual height of the water is when it crosses the limit. 85% of the actual height of the sensor is 935 mm, which means that if it exceeds that height, the DANGER sign will light up.
In device A, the maximum height is set to 1100 mm, with a minimum range of 303 and a maximum range of 962, so the difference between the max and min ranges is 659, and the percentage limit is 85%. The results of the calibration data can be calculated by equation (3).
- Inter-Device Testing Analysis
In the analysis phase, testing between devices is the stage where the device work process is in normal conditions, namely the conditions in Thingspeak that make the device connect with others. In this connection, the parameters taken are the height and the percentage of sensor readings, so that each device can display the parameter values of the readings on other devices. The parameter used for the safe and dangerous limit markers is the reading percentage; that is, when the percentage value shows <85%, then the condition is in the SAFE category, but if ≤ 85%, it is in the DANGER category. In testing between devices, the programming tools have been changed using 4 Thingspeak channels, namely for the following parameters,
The height of device A, Percentage of device A, The height of device B, and Percentage of device B.
This was done because, seeing the response of the tool regarding the time lag during internal device testing, there were still many time lags that were included in the slow and very slow criteria. The internal channel update is still set to 15 seconds, as it was during the internal device test, because this value is the minimum update interval setting of Thingspeak. The data collection process starts from the lowest reading to the highest, after which a random reading is carried out. The results of testing devices A and B that have been done can be seen in Table 4 and Table 5. The results of testing between devices on the device (B) can be seen in Table 5.
In Table 4 and Table 5, there is data on the length of time and time lag criteria during the upload and download process. The criteria for the upload delay time are: fast (1–10 seconds), normal (11–20 seconds), slow (21–30 seconds), and very slow (<31 seconds). So that you can get a fast grouping graph, see Figure 7 and Figure 8.
Table 4. Test results between devices part (A)
No | Date & Time | Height
(mm) | Percent
(%) | Info | Data Pause Time (Second) | Time-off criteria |
Upload | Download | Upload | Download |
1 | 2020-07-06 02:18:08 WIB | 110 | 10 | Secure | 2.5 | 1.5 | Fast | Fast |
2 | 2020-07-06 02:19:35 WIB | 196 | 17 | Secure | 2.5 | 3.5 | Fast | Fast |
3 | 2020-07-06 02:21:01 WIB | 297 | 27 | Secure | 1.5 | 4.5 | Fast | Fast |
4 | 2020-07-06 02:23:24 WIB | 394 | 35 | Secure | 1.5 | 2.5 | Fast | Fast |
5 | 2020-07-06 02:25:13 WIB | 503 | 45 | Secure | 2.5 | 1.5 | Fast | Fast |
6 | 2020-07-06 02:27:15 WIB | 609 | 55 | Secure | 1.5 | 3.5 | Fast | Fast |
7 | 2020-07-06 02:29:18 WIB | 707 | 64 | Standby 3 | 2.5 | 2.5 | Fast | Fast |
8 | 2020-07-06 02:29:53 WIB | 815 | 74 | Standby 2 | 2.5 | 2 | Fast | Fast |
9 | 2020-07-06 02:32:18 WIB | 912 | 82 | Standby 1 | 6 | 4 | Normal | Fast |
10 | 2020-07-06 02:32:54 WIB | 1001 | 91 | Danger | 2.5 | 1.5 | Fast | Fast |
11 | 2020-07-06 02:33:29 WIB | 1096 | 99 | Danger | 6.5 | 4 | Normal | Fast |
12 | 2020-07-06 02:34:20 WIB | 970 | 88 | Danger | 2.5 | 3.5 | Fast | Fast |
13 | 2020-07-06 02:34:56 WIB | 921 | 83 | Standby 1 | 2.5 | 3.5 | Fast | Fast |
14 | 2020-07-06 02:37:47 WIB | 765 | 69 | Standby 3 | 13.5 | 1.5 | Slow | Fast |
Table 5. Test results between devices part (B)
No | Date & Time | Height
(mm) | Percent
(%) | Info | Data Pause Time (Second) | Time-off criteria |
Upload | Download | Upload | Download |
1 | 2020-07-06 02:17:43 WIB | 107 | 9 | Secure | 4 | 1.5 | Fast | Fast |
2 | 2020-07-06 02:19:07 WIB | 204 | 18 | Secure | 4 | 1.5 | Fast | Fast |
3 | 2020-07-06 02:20:48 WIB | 306 | 27 | Secure | 3 | 2.5 | Fast | Fast |
4 | 2020-07-06 02:22:30 WIB | 306 | 27 | Secure | 2.5 | 1 | Fast | Fast |
5 | 2020-07-06 02:24:27 WIB | 499 | 45 | Secure | 2.5 | 1 | Fast | Fast |
6 | 2020-07-06 02:26:24 WIB | 600 | 54 | Secure | 2.5 | 3.5 | Fast | Fast |
7 | 2020-07-06 02:28:23 WIB | 704 | 64 | Standby 3 | 4.5 | 2.5 | Fast | Fast |
8 | 2020-07-06 02:29:31 WIB | 802 | 72 | Standby 2 | 8.5 | 1 | Normal | Fast |
9 | 2020-07-06 02:30:56 WIB | 904 | 82 | Standby 1 | 4 | 5 | Fast | Fast |
10 | 2020-07-06 02:32:54 WIB | 1001 | 91 | Danger | 2.5 | 2.5 | Fast | Fast |
11 | 2020-07-06 02:33:10 WIB | 1089 | 99 | Danger | 2 | 3 | Fast | Fast |
12 | 2020-07-06 02:34:01 WIB | 771 | 70 | Standby 3 | 14 | 1.5 | Slow | Fast |
13 | 2020-07-06 02:35:42 WIB | 769 | 69 | Standby 3 | 1.5 | 1.5 | Fast | Fast |
14 | 2020-07-06 02:37:55 WIB | 1107 | 100 | Danger | 2.5 | 3.5 | Fast | Fast |
Figure 7 shows the upload time in testing between devices A, which is classified as fast, while the download time shows the results of the fast time lag criteria (≤ 5 seconds). When compared with the internal test data for device A in Figure 7, the test results between devices (A) in Figure 7 show better results; this can be seen in the results of the time criteria graph for each test. Testing between devices (A) can be better because, in the testing process, each parameter uses one channel, meaning that the update interval is 15 seconds, always updating data on only one parameter that is taken (such as height).
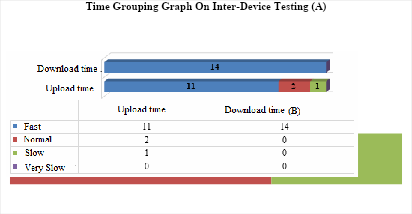
Figure 7. Graph of test results between devices (A)
Figure 8 shows the upload time in testing between devices B is classified as fast, while the upload time shows good results. The criterion for lag time is fast (≤ 5 seconds). When compared with the internal test data for device B in Figure 8, the test results between devices (B) in Figure 8 show better results; this can be seen in the results of the time criteria graph for each test. Testing between devices (B) can be better because, in the testing process, each parameter uses one channel, meaning that the update interval is 15 seconds, always updating data on only one parameter that is taken (such as height).
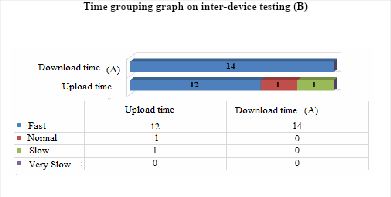
Figure 8. Graph of test results between devices (B)
- CONCLUSIONS
The design and development of a flood detection-based internet of things can run according to the designed concept. The tool can measure the water level. When the actual condition of the water level is, for example, 1058 mm, the sensor reading also shows the number 1058 mm. If the sensor reads the water level ≤ 60% (≤ 660mm), then the altitude condition is in the secure category. If the sensor reads a water level of 61–70% (671–770 mm), then the altitude condition is in the category Standard 3. If the sensor reads a water level of 71–80% (781–880 mm), then the altitude condition is in the standby 2 category. If the sensor reads 81–85% (891–935 mm) water level, then the altitude condition is in the standby 1 category. If the sensor reads water level = ≥ 85% (≥ 935mm), then the altitude condition is in the DANGER category, so the alarm is active.
REFERENCES
- W. W. Hassan, A. Z. Jidin, S. A. C. Aziz, and N. Rahim, “Flood disaster indicator of water level monitoring system,” Int. J. Electr. Comput. Eng, vol. 9, no. 3, pp. 1694-1699, 2019, https://doi.org/10.11591/ijece.v9i3.pp1694-1699.
- S. I. Abdullahi, M. H. Habaebi, and N. Abd Malik, “Intelligent flood disaster warning on the fly: developing IoT-based management platform and using 2-class neural network to predict flood status,” Bulletin of Electrical Engineering and Informatics, vol. 8, no. 2, pp. 706-717, 2019, https://doi.org/10.11591/eei.v8i2.1504.
- D. Satria, S. Yana, T. Hidayat, S. Syahreza, E. Yusibani, and R. Munadi, “Application of GSM communication system on flood alarm systems,” In Journal of Physics: Conference Series,vol. 1232, no. 1, p. 012023, 2019, https://doi.org/10.1088/1742-6596/1232/1/012023.
- H. Malik and W. Zatar, "A Real-Time and Low-Cost Flash Flood Monitoring System to Support Transportation Infrastructure," 2020 IEEE 44th Annual Computers, Software, and Applications Conference (COMPSAC), pp. 1111-1112, 2020, https://doi.org/10.1109/COMPSAC48688.2020.0-115.
- P. Barmpoutis, P. Papaioannou, K. Dimitropoulos, and N. Grammalidis, “A review on early forest fire detection systems using optical remote sensing,” Sensors, vol. 20, no. 22, p. 6442, 2020, https://doi.org/10.3390/s20226442.
- M. Anbarasan, B. Muthu, C. B. Sivaparthipan, R. Sundarasekar, S. Kadry, S. Krishnamoorthy, and A. A. Dasel, “Detection of flood disaster system based on IoT, big data and convolutional deep neural network,” Computer Communications, vol. 150, pp. 150-157, 2020, https://doi.org/10.1016/j.comcom.2019.11.022.
- E. Abana, C. V. Dayag, V. M. Valencia, P. H. Talosig, J. P. Ratilla, G. Galat, “Road flood warning system with information dissemination via social media”, International Journal of Electrical and Computer Engineering (IJECE), vol. 9, no. 6, pp. 4979-4987, 2019, https://doi.org/10.11591/ijece.v9i6.pp4979-4987.
- H. Moorthy and R. Sukumar, "Advanced Bridge Monitoring System using Internet of Things," 2022 International Interdisciplinary Humanitarian Conference for Sustainability (IIHC), pp. 688-692, 2022, https://doi.org/10.1109/IIHC55949.2022.10060795.
- Sulistyowati R., et al., “A river water level monitoring system using android-based wireless sensor networks for a flood early warning system,” Second International Conference on Electrical Systems, Technology and Information 2015 (ICESTI 2015). pp. 401-408, 2016, https://doi.org/10.1007/978-981-287-988-2_43.
- M. J. Subashini, R. Sudarmani, S. Gobika and R. Varshini, "Development of Smart Flood Monitoring and Early Warning System using Weather Forecasting Data and Wireless Sensor Networks-A Review," 2021 Third International Conference on Intelligent Communication Technologies and Virtual Mobile Networks (ICICV), pp. 132-135, 2021, https://doi.org/10.1109/ICICV50876.2021.9388418.
- A. M. Wahab and A. N. Muhamad Ludin, “Flood vulnerability assessment using artificial neural networks in Muar Region, Johor Malaysia,” In IOP Conference Series: Earth and Environmental Science, vol. 169, p. 012056, 2018, https://doi.org/10.1088/1755-1315/169/1/012056.
- N. S. Romali, Z. Yusop, and A. Z. Ismail, “Application of Hec-Ras and Arc Gis for Floodplain Mapping in Segamat Town,” International Journal of GEOMATE, vol 14, no. 43, pp. 125-131, 2018, https://doi.org/10.21660/2018.43.3656.
- M. Codo and M. A. Rico-Ramirez, “Ensemble radar-based rainfall forecasts for urban hydrological applications,” Geosciences, vol. 8, no. 8, p. 297, 2018, https://doi.org/10.3390/geosciences8080297.
- S. I. Abdullahi, M. H. Habaebi, S. T. Gunawan, and M. R. Islam, “Miniaturized Water Flow and Level Monitoring System for Flood Disaster Early Warning,” In IOP Conference Series: Materials Science and Engineering, vol. 260, no. 1, pp. 1, 2019, https://doi.org/10.1088/1757-899X/260/1/012019.
- S. I. Abdullahi, M. H. Habaebi, and N. A. Malik, “Flood Disaster Warning System on the go,” In 2018 7th International Conference on Computer and Communication Engineering (ICCCE), pp. 258-263, 2018, https://doi.org/10.1109/ICCCE.2018.8539253.
- F. A. Silaban, S. Budiyanto, and W. K. Raharja, “Stepper motor movement design based on FPGA,” in International Journal of Electrical and Computer Engineering (IJECE), vol. 10, no. 1, pp. 151-159, 2020, https://doi.org/10.11591/ijece.v10i1.pp151-159.
- J. Wu, H. Liu, G. Wei, T. Song, C. Zhang, and H. Zhou, “Flash flood forecasting using support vector regression model in a small mountainous catchment,” Water, vol. 11, no. 7, p. 1327, 2019, https://doi.org/10.3390/w11071327.
- T. Zhao, B. Minsker, F. Salas, D. Maidment, V. Diev, J. Spoelstra, and P. Dhingra, “Statistical and Hybrid Methods Implemented in a Web Application for Predicting Reservoir Inflows during Flood Events,” JAWRA Journal of the American Water Resources Association, vol. 54, no. 1, pp. 69-89, 2018, https://doi.org/10.1111/1752-1688.12575.
- F. Guzzetti, S. L. Gariano, S. Peruccacci, M. T. Brunetti, I. Marchesini, M. Rossi, and M. Melillo, “Geographical landslide early warning systems,” Earth-Science Reviews, vol. 200, p. 102973, 2020, https://doi.org/10.1016/j.earscirev.2019.102973.
- Z. Z. Zulkifli, M. Mamat and H. T. Yew, "River Water Level Prediction for Flood Risk Assessment using NARX Neural Network," 2022 IEEE International Conference on Artificial Intelligence in Engineering and Technology (IICAIET), pp. 1-6, 2022, https://doi.org/10.1109/IICAIET55139.2022.9936739.
- Q. Ke, et al., “Urban pluvial flooding prediction by machine learning approaches–a case study of Shenzhen city, China,” Advances in Water Resources, vol. 145, p. 103719, 2020, https://doi.org/10.1016/j.advwatres.2020.103719.
- F. A.Silaban, S. Budiyanto, L. M. Silalahi, “Design of a conductive material detection system”, in International Journal of Robotics and Automation (IJRA), vol. 9, no. 4, pp. 292-299, 2020, https://doi.org/10.11591/ijra.v9i4.pp292-299.
- H. Yuliandoko, Subono, V. A. Wardhany, S. H. Pramono and P. Siwindarto, “Design of flood detection system based on velocity and water level sensor in Arduino with SWOD application on Kalimati-Kretek Gantung DAM Banyuwangi,” In IOP Conference Series: Materials Science and Engineering, vol. 403, no. 1, p. 012066, 2018, https://doi.org/10.1088/1757-899X/403/1/012066.
- M. H. A. Abdullah, M. Othman, S. Kasim, S. A. Mohamed, “Evolving spiking neural networks methods for classification problem: a case study in flood events risk assessmen”, International Journal of Electrical and Computer Engineering (IJECE), vol. 16, no. 1, pp. 222-229, 2019, https://doi.org/10.11591/ijeecs.v16.i1.pp222-229.
- J. G. Natividad and J. M. Mendez, “Flood monitoring and early warning system using ultrasonic sensor,” In IOP conference series: materials science and engineering, vol. 325, no. 1, p. 012020, 2018, https://doi.org/10.1088/1757-899X/325/1/012020.
- J. G. Natividad and J. M. Mendez, “Flood monitoring and early warning system using ultrasonic sensor,” In IOP conference series: materials science and engineering, vol. 325, no. 1, p. 012020, 2018, https://doi.org/10.1088/1757-899X/325/1/012020.
- P. Kumar, M. Tripathi, A. Nehra, M. Conti and C. Lal, "SAFETY: Early Detection and Mitigation of TCP SYN Flood Utilizing Entropy in SDN," in IEEE Transactions on Network and Service Management, vol. 15, no. 4, pp. 1545-1559, 2018, https://doi.org/10.1109/TNSM.2018.2861741.
AUTHOR BIOGRAPHY
| Freddy Artadima Silaban, received his Master of Engineering (MT) degree in Electrical Engineering, Information Technology Specialization, Gunadarma University, Depok, 2016. He currently teaches at Universitas Mercu Buana, Jakarta (Indonesia). The focus of the research is an embedded system using control devices such as the FPGA, Arduino, and NodeMCU Modules. As well as IC design research using Xilinx ISE. |
|
|

| Yufimar Taufiq, is an electrical graduated with a degree from Universitas Mercu Buana, Jakarta, 2020. The focus of the research is an embedded system using control devices such as the Arduino, NodeMCU. |
|
|

| Lukman Medriavin Silalahi, received his Master of Engineering (MT) degree in Electrical Engineering, Microwave Technology, Universitas Mercu Buana, Jakarta, 2017. He currently teaches at Universitas Mercu Buana, Jakarta (Indonesia). The focus of research is mobile telecommunications and embedded systems. |
|
|

| Grace Lamudur Arta Sihombing, received her Master of Computer (M.Kom) degree in Computer Science and Information Technology, University of Sumatera Utara, Medan, 2016. She curently teaches at Institut Agama Kristen Negeri (IAKN) Tarutung, Indonesia. The focus of the research is system security engineering, information systems and technology. |
Flood Detection Design based on the Internet of Things (Freddy Artadima Silaban)