Buletin Ilmiah Sarjana Teknik Elektro ISSN: 2685-9572
Temperature and Humidity Monitoring System in
Internet of Things-based Solar Dryer Dome
Dzakarasma Tazakka Ma’arij, Anton Yudhana
Department of Electrical Engineering, Universitas Ahmad Dahlan, Yogyakarta, Indonesia
ARTICLE INFORMATION |
| ABSTRACT |
Article History: Submitted 15 June 2023 Revised 17 July 2023 Accepted 13 August 2023 |
| 
The village of Gerbosari has a program for cultivating spice rhizome plants as an effort to improve the economy. These plants are dried using a Solar Dryer Dome (SDD) as a solution to the rain-related issues. The SDD has an automatically controlled exhaust fan based on the measured temperature. Temperature and humidity readings are taken using DHT22 and DHT11 sensors, respectively. Weather conditions (clear or rainy) are detected using a rain sensor. Weather, temperature, and humidity monitoring are done through On The Spot (OTS) and Internet of Things (IoT) methods. OTS utilizes an LCD 16x2, while IoT utilizes the Blynk application and WhatsApp. The temperature errors for DHT22 and DHT11, respectively, are 1.572% and 0.721%, while the humidity errors are 5.223% for DHT22 and 3.214% for DHT11. If the error values approach 5% or more, program adjustments are necessary. Throughout the day, regardless of clear or rainy weather, the temperature inside the SDD is higher, and the humidity is lower than the temperature and humidity outside. |
Keywords: DHT22; Rain Sensor; Solar Dryer Dome; Blynk; Calibration |
Corresponding Author: Anton Yudhana, Department of Electrical Engineering, Universitas Ahmad Dahlan, Bantul, Yogyakarta, Indonesia. Email:eyudhana@ee.uad.ac.id |
This work is licensed under a Creative Commons Attribution-Share Alike 4.0 
|
Document Citation: D. T. Ma’arij and A. Yudhana, “Temperature and Humidity Monitoring System in Internet of Things-based Solar Dryer Dome,” Buletin Ilmiah Sarjana Teknik Elektro, vol. 5, no. 3, pp. 323-335, 2023, DOI:10.12928/biste.v5i3.8633. |
- INTRODUCTION
Kalurahan Gerbosari is one of the sub-villages in the Samigaluh Sub-district, Kulon Progo Regency [1]. It has a program for cultivating spice rhizome plants, which are agricultural or plantation products aimed at improving the economy [2]. One of the products made from these spice rhizomes and marketed in Gerbosari Village is herbal tea. The plants should be prepared in a dry condition to ensure their longevity [3]. The drying process requires specific temperature and time to reduce the moisture content in the plants. Once the plants are dried while preserving their original form, they are called “simplisia” [4].
However, drying poses challenges during rainy weather as it can affect the quality and storage life of the simplisia. To address this, the village uses a Solar Dryer Dome (SDD), a closed space designed to absorb solar energy and retain heat inside [5]. The SDD is equipped with an exhaust fan on one side, located at the back, to ensure proper air circulation [6]. The SDD serves as a drying solution during rainy weather.
The exhaust fan is not active 24/7 but is controlled based on the temperature inside the SDD. It plays a crucial role in maintaining a stable temperature inside the SDD and is automatically controlled. Additionally, the temperature inside the SDD should be higher than the outside temperature.
Weather, temperature, and humidity readings are taken using rain sensors and temperature sensors (for both temperature and humidity). The DHT22 sensor measures the temperature inside the SDD and is also used to determine the automation of the exhaust fan. On the other hand, the DHT11 sensor measures the temperature outside the SDD [7], [8].
Before conducting measurements, the temperature and humidity sensors need to be calibrated. This calibration determines the difference between the sensors used and the standard measuring tool. The standard measuring tool used is the ThermoPro TP50 thermohygrometer. If the measurement values exceed the standard limit, they need to be adjusted through the program code.
Weather, temperature, humidity, and exhaust fan conditions can be monitored either on-site (On the Spot) or remotely through the Internet of Things (IoT). IoT is a technology that enables remote interactions with the help of software [9]. One popular IoT software is Blynk. Additionally, WhatsApp (WA) can also be used for IoT by sending messages to monitor or control the system [10].
- METHOD
The method used is monitoring and control, both for short distances (On the Spot/OTS) and long distances (Internet of Things/IoT). The monitored parameters are weather, temperature, and humidity both inside and outside the SDD. The automatic control is applied to the exhaust fan. The results of the OTS monitoring and control are displayed on an LCD 16x2 screen, while IoT monitoring and control are done through the Blynk application and WhatsApp.
- System Design
The system design is divided into hardware design and software design. The hardware design is described in a wiring diagram, while the software design includes block diagrams and flowcharts. The block diagram contains the stages or processes within the system being created [11]. The wiring diagram illustrates the cabling and communication paths between components in the system [12], [13]. The flowchart explains the workflow of the system based on the planning that has been made [14].
- Software Design
The block diagram is divided into three parts: input, process, and output. The input section consists of sensor blocks (DHT11, DHT22, and rain sensor). The process section includes internet modem and microcontrollers (Main and WA). The output section comprises monitoring (via WhatsApp), an interface, and control (Relay). The interface block is further divided into IoT (Blynk) and OTS (LCD 16x2) blocks. The block diagram of the system can be seen in Figure 1.
DHT11 and DHT22 are temperature and humidity sensors [15]–[19]. The difference between the two sensors lies in their characteristics and measurement ranges. DHT11 reads temperatures from 0-50°C, while DHT22 operates in the range of -40°C to 80°C [20], [21]. DHT22 is superior in terms of measurement, especially due to its wider range compared to DHT11.
The microcontrollers used are Node MCU ESP8266 and Wemos Lolin D1 Mini. Node MCU ESP8266 serves as the main microcontroller, while Wemos Lolin D1 Mini functions as the microcontroller for WA. Node MCU ESP8266 is a newer development of Arduino and is more affordable [23]. Similarly, Wemos Lolin D1 Mini is based on ESP8266, integrating a WiFi chip [24]. ESP8266 excels in its use as it can handle IoT communication within a single device [25], [26].
The communication path in the block diagram is unidirectional. The output section, monitoring, and interface only display monitoring results and controls. WhatsApp is utilized to send scheduled messages to the user. On the other hand, Blynk operates in real-time, displaying unscheduled monitoring results and controls, accessible at any time.
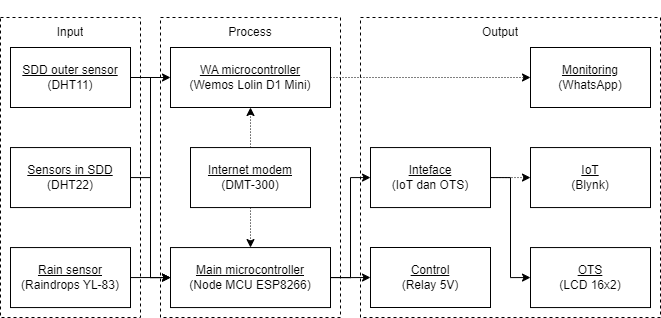
Figure 1. Block diagram
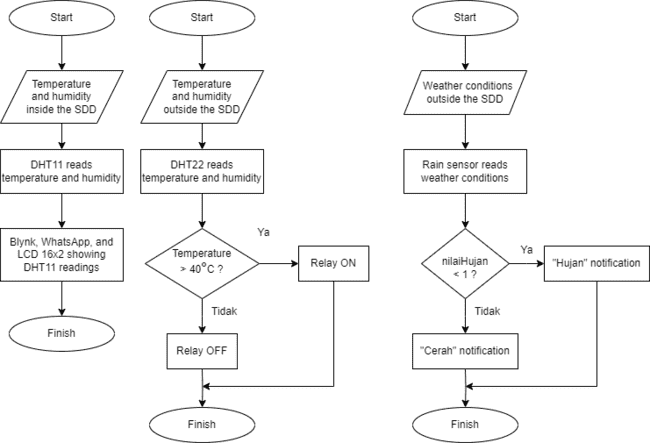
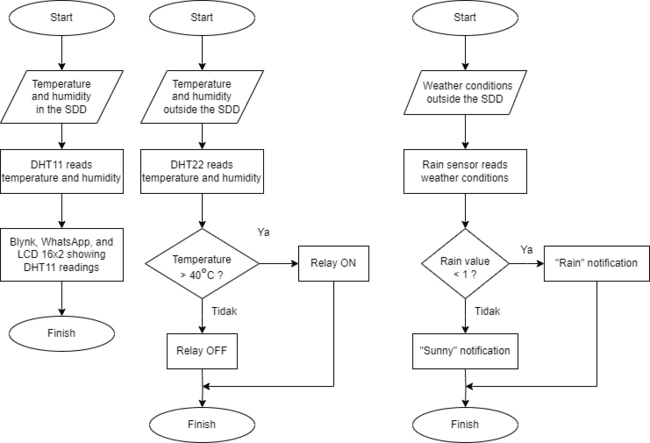
The flowchart is divided into three parts, namely the DHT11, DHT22, and rain sensor flowcharts. The DHT11 flowchart explains the process of reading temperature and humidity outside the SDD (System Design Document). The DHT22 flowchart includes the steps for reading temperature data for relay automation. Finally, the rain sensor flowchart displays notifications “Rain” or “Clear” based on the current weather conditions. The flowcharts for DHT11, DHT22, and the rain sensor can be seen in Figure 2, Figure 3, and Figure 4, respectively.

| 
| 
|
Figure 2. DHT11 flowchart | Figure 3. DHT22 flowchart | Figure 4. Rain sensors flowchart |
- Hardware Design
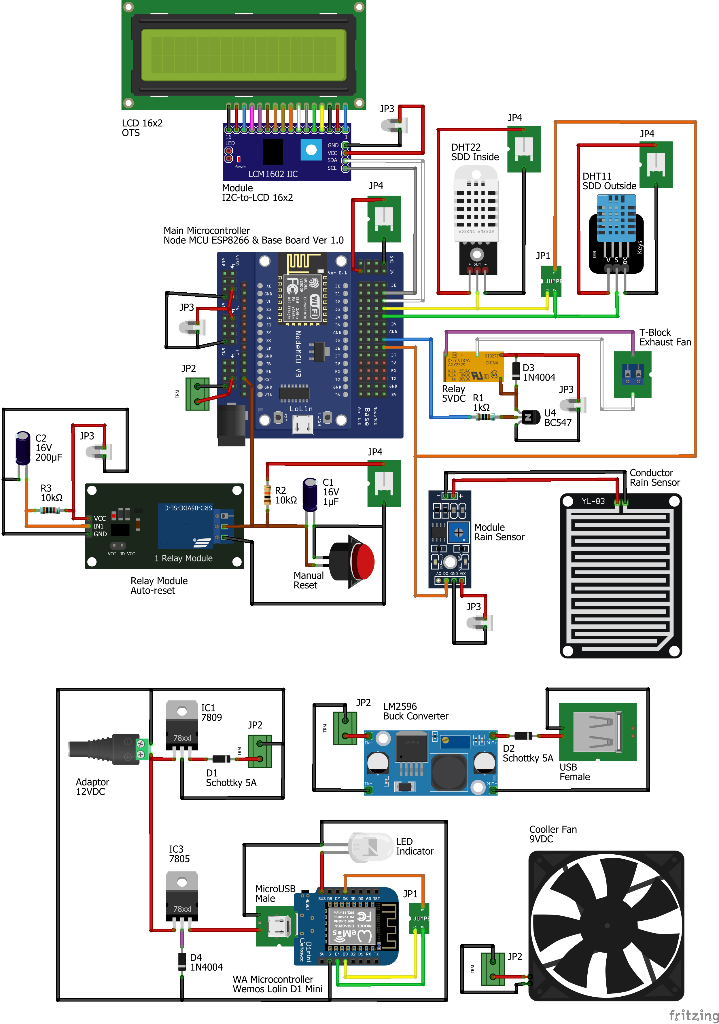
The wiring diagram includes data and power connections between components [22]. The power source used is a 12VDC adapter. The power output from the adapter is split into +9VDC and +5VDC. The main microcontroller, buck converter, and device fan use +9VDC. Meanwhile, the WA microcontroller, LCD 16x2, and rain sensor module use +5VDC. The wiring diagram can be found in Figure 5, and the equipment implementation can be seen in Figure 6.
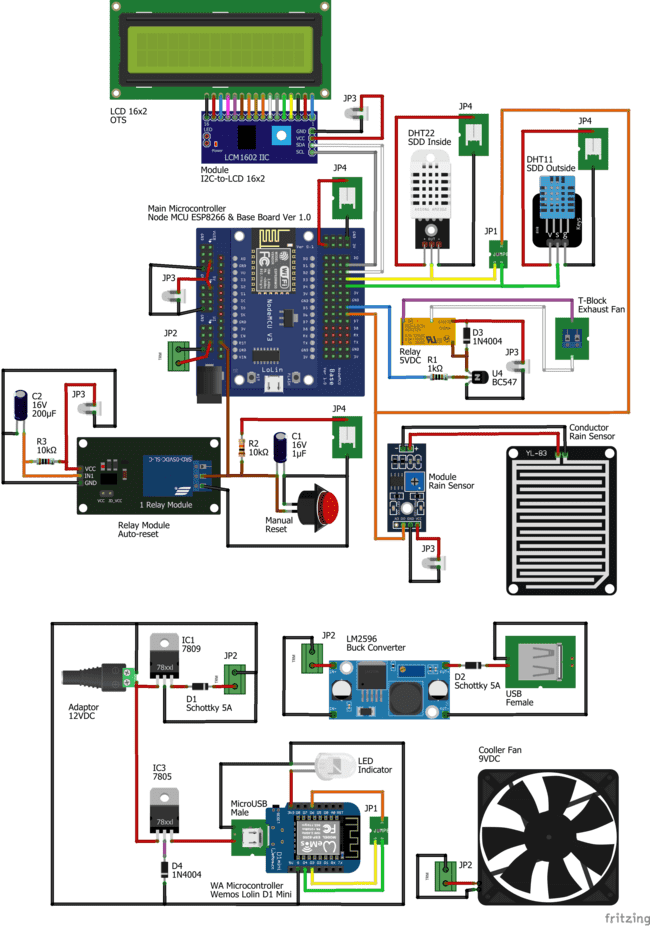
Figure 5. Diagram wiring
Table 1 explains the data and power connections of components linked to the main microcontroller. These components include the I2C-to-LCD module, rain sensor module, DHT22 sensor, and DHT11 sensor. For the DHT11 sensor, “g” indicates GND (Ground), “v” represents +VCC (Power supply), and “s” denotes data connection.
Table 1. The data and power connections linked to the main microcontroller are as follows
Main Microcontroller | Colour (Terminal) |
Base Board V1.0 | Module | Sensors |
Node MCU ESP8266 | I2C-to-LCD | Rain Sensors | DHT22 | DHT11 |
+5VDC / VUSB | Red (VCC) | Red (VCC) |
|
|
GND | Black (GND) | Black (GND) | Black (GND) | Black (g) |
+3VDC |
|
| Red (VCC) | Red (v) |
D1 | Grey (SCL) |
|
|
|
D2 | White (SDA) |
|
|
|
D3 |
|
| Kuning (OUT) |
|
D4 |
|
|
| Hijau (s) |
D6 |
| Orange (D0) |
|
|
Table 2 explains the data path of components and power supply connected to the microcontroller WA. These components include LED indicators, rain sensor modules, DHT22, and DHT11 sensors. Unlike the main microcontroller, the I2C-to-LCD module component is replaced with a LED indicator.
Table 2. The data path and power supply connected to microcontroller WA
Microcontroller WA | Colour (Terminal) |
Wemos Lolin
D1 Mini | Indicator | Module | Sensors |
LED | Rain Sensors | DHT22 | DHT11 |
+5VDC |
| Red (VCC) |
|
|
GND | Black (GND) | Black (GND) |
|
|
+3VDC | Red (VCC) |
|
|
|
D3 |
|
| Yellow (OUT) |
|
D4 |
|
|
| Green (s) |
D6 |
| Orange (D0) |
|
|
Table 3 explains the data path and power supply connections for components other than the main microcontroller or WA. These components include jumpers (JP1 to JP4), microUSB, T-Block, power jack, USB, auto-reset, and a fan. For microUSB and USB, the red line (OUT 7805 and the cathode of D2) is set to +5VDC. Additionally, the T-Block is connected to the SDD exhaust fan as an automation output.
Table 3. The data path and power supply connections, apart from the main microcontroller or WA
Component | Terminal |
Red | Black | Yellow | Green | Orange | Purple | White | Brown |
JP1 |
|
| OUT | S | D0 |
|
|
|
JP2 | +9VDC | GND |
|
|
|
|
|
|
JP3 | +5VDC | GND |
|
|
|
|
|
|
JP4 | +3VDC | GND |
|
|
|
|
|
|
MicroUSB | OUT 7805 | GND |
|
|
|
|
|
|
T-Block |
|
|
|
|
| NO | COM |
|
Power jack | +12VDC | GND |
|
|
|
|
|
|
USB | Cathode D2 | GND |
|
|
|
|
|
|
Auto-reset |
| GND |
|
|
|
|
| COM |
Fan | +9VDC | GND |
|
|
|
|
|
|
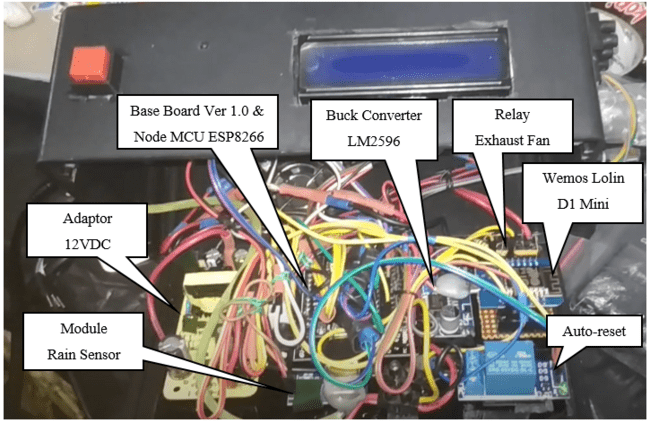
Figure 6. Tool implementation
- RESULTS AND DISCUSSION
The research conducted involves several stages, namely calibration, fan automation, weather detection, and comparison. Calibration includes the DHT11 and DHT22 sensors compared to the standard measuring instrument (Thermohygrometer) ThermoPro TP50. Relay automation is used for the SDD exhaust fan. The current weather conditions are updated as “Rain” or “Clear” on the SDD. Finally, the comparison includes observations of temperature and humidity inside and outside the SDD.
- Calibration
The calibration process is carried out to determine the comparison of measurement differences between the sensor values and the reference values from the standard measuring instrument [27]. The tolerance value or level of error should be less than 5% [28]. If the error value exceeds 5%, adjustments to the sensor values are necessary. This calibration involves the DHT11 and DHT22 sensors, as well as the standard measuring instrument (Thermohygrometer) ThermoPro TP50. Figure 7 displays the process of calibrating the sensors with ThermoPro.
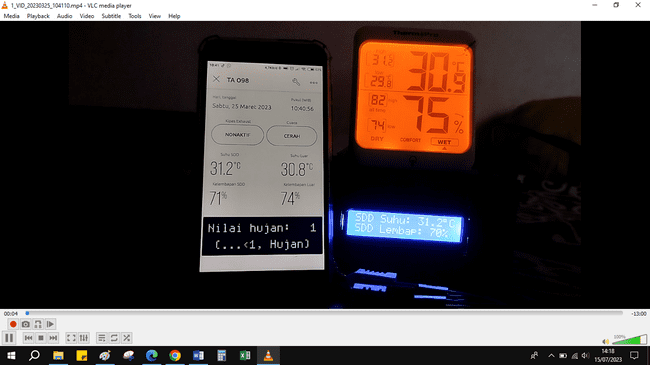
Figure 7. Sensor calibration process with ThermoPro. Information for figure, Nilai hujan is a description of the value of rain, hujan is a description of rain, suhu is a description of temperature, lembap is a description of humidity
Table 4 and Table 5 each explain the temperature measurements for DHT11 and DHT22 compared to ThermoPro. These measurements show that the average temperature difference of DHT22 compared to ThermoPro is 0.48°C with an error of 1.572%. On the other hand, for DHT11, the average temperature difference compared to ThermoPro is 0.22°C with an error of 0.721%.
Table 4. Temperature measurement using DHT11 and ThermoPro
No | ThermoPro (°C) | DHT11 (°C) | Error (%) |
1 | 30.80 | 30.80 | 0.000 |
2 | 30.70 | 30.80 | 0.326 |
3 | 30.60 | 30.80 | 0.654 |
4 | 30.50 | 30.70 | 0.656 |
5 | 30.50 | 30.20 | 0.984 |
6 | 30.50 | 30.20 | 0.984 |
7 | 30.50 | 30.20 | 0.984 |
8 | 30.50 | 30.20 | 0.984 |
9 | 30.50 | 30.20 | 0.984 |
10 | 30.40 | 30.20 | 0.658 |
Average | 0.721 |
Table 5. DHT22 and ThermoPro temperature measurement
No | ThermoPro (°C) | DHT22 (°C) | Error (%) |
1 | 30.80 | 31.20 | 1.299 |
2 | 30.70 | 31.10 | 1.303 |
3 | 30.60 | 31.00 | 1.307 |
4 | 30.50 | 31.00 | 1.639 |
5 | 30.50 | 31.00 | 1.639 |
6 | 30.50 | 31.00 | 1.639 |
7 | 30.50 | 31.00 | 1.639 |
8 | 30.50 | 31.00 | 1.639 |
9 | 30.50 | 31.00 | 1.639 |
10 | 30.40 | 31.00 | 1.974 |
Average | 1.572 |
Table 6 and Table 7 each explain the humidity measurements for DHT11 and DHT22 compared to ThermoPro. These measurements show that the average humidity difference of DHT22 compared to ThermoPro is 4% with an error of 5.223%. On the other hand, for DHT11, the average humidity difference compared to ThermoPro is 2% with an error of 3.214%.
Table 6. Humidity measurement DHT11 and ThermoPro
No | ThermoPro (%) | DHT11 (%) | Error (%) |
1 | 75 | 74 | 1.333 |
2 | 75 | 72 | 4.000 |
3 | 75 | 72 | 4.000 |
4 | 75 | 72 | 4.000 |
5 | 75 | 72 | 4.000 |
6 | 75 | 72 | 4.000 |
7 | 74 | 72 | 2.703 |
8 | 74 | 72 | 2.703 |
9 | 74 | 72 | 2.703 |
10 | 74 | 72 | 2.703 |
Average | 3.214 |
Tabel 7. Humidity measurement DHT22 and ThermoPro
No | ThermoPro (%) | DHT22 (%) | Error (%) |
1 | 75 | 70 | 6.667 |
2 | 75 | 70 | 6.667 |
3 | 75 | 71 | 5.333 |
4 | 75 | 71 | 5.333 |
5 | 75 | 71 | 5.333 |
6 | 75 | 71 | 5.333 |
7 | 74 | 71 | 4.054 |
8 | 74 | 71 | 4.054 |
9 | 74 | 71 | 4.054 |
10 | 74 | 70 | 5.405 |
Average | 5.223 |
Based on the calibration results, there are error values exceeding 5%. To adjust the humidity values based on the average difference between ThermoPro and the sensors in the program code, the humidity value for DHT22 is increased by 4, and for DHT11, it is increased by 2, as the average error is close to 5%. The program code adjustments can be found in Figure 8.
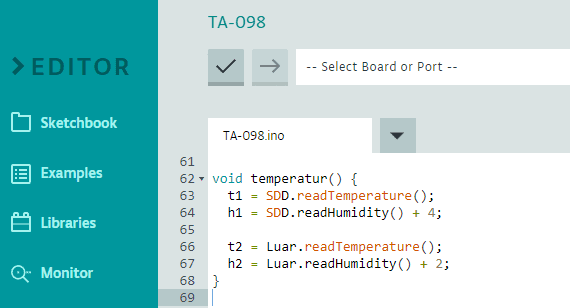
Figure 8. Program code adjustment after calibration
- Fan Automation and Weather Detection
The automation process is performed by a 5VDC relay connected to the main microcontroller, as shown in Figure 5. The SDD exhaust fan is connected to a T-Block, which is linked to the relay. When the temperature from DHT22 exceeds 40°C, the relay activates and turns on the fan. Conversely, the fan remains inactive when the temperature is below 40°C.
The monitoring of fan automation can be done through IoT (Internet of Things) or OTS (On-The-Spot) methods. An LCD 16x2 is used for OTS, while Blynk application and WhatsApp are used for IoT. There is a limitation in the WhatsApp application, where messages are sent every 30 minutes. The displays for WhatsApp and LCD 16x2 can be seen in Figure 9 and Figure 12, respectively.
Weather conditions can also be monitored through IoT and OTS. Figure 10 illustrates the Blynk display when the weather is clear, with the “Rain” value being 1. The Blynk display and the location photo during rainy weather can be observed in Figure 11 and Figure 13, respectively. Figure 10 and Figure 11 demonstrate that the temperature inside the SDD is higher than outside, both during clear and rainy conditions.
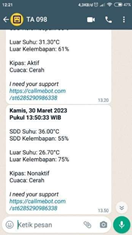
Figure 9. WhatsApp display. Information for figure, Kamis is a description of Thursday, Waktu is a description of the time display in the form of hours, Suhu is a description of temperature, Kelembapan is a description of humidity, Kipas is a description of the fan, Cuaca is a description of weather, Cerah is a description of sunny
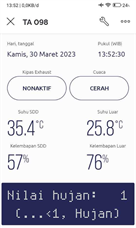
Figure 10. Blynk view when the weather is clear. Information for figure, Kamis is a description of Thursday, Waktu is a description of the time display in the form of hours, Nilai hujan is a description of the value of rain, hujan is a description of rain, suhu is a description of temperature, kelembapan is a description of humidity, cuaca is a description of weather, cerah is a description of sunny
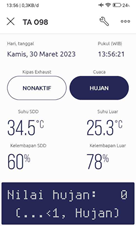
Figure 11. Blynk display in rainy weather. Information for figure, Kamis is a description of Thursday, Waktu is a description of the time display in the form of hours, Nilai hujan is a description of the value of rain, hujan is a description of rain, suhu is a description of temperature, kelembapan is a description of humidity, cuaca is a description of weather
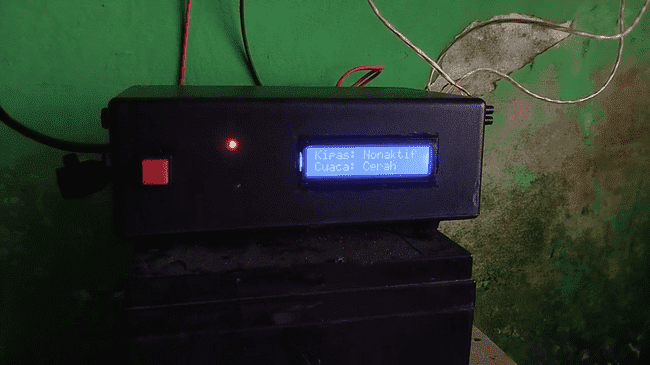
Figure 12. 16x2 LCD display. Information for figure, Kipas is a description of the fan, cuaca is a description of the weather, cerah is a description of sunny
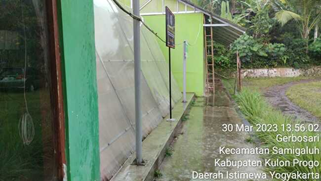


Figure 13. Photo location when the weather is rainy
The process of reading the rain sensor is determined by its conductor. When the conductor comes into contact with water, the “Rain” value is set to 0, and a “Rain” notification is sent. Conversely, the “Rain” value remains 1 when the weather is clear, and the conductor does not come into contact with water. The rain sensor's conductor and DHT11 are placed outside the SDD, while DHT22 is positioned inside the SDD. The internal part of the SDD is shown in Figure 14, and the positions of DHT11, DHT22, and the rain sensor's conductor can be seen in Figure 15, Figure 16, and Figure 17, respectively.
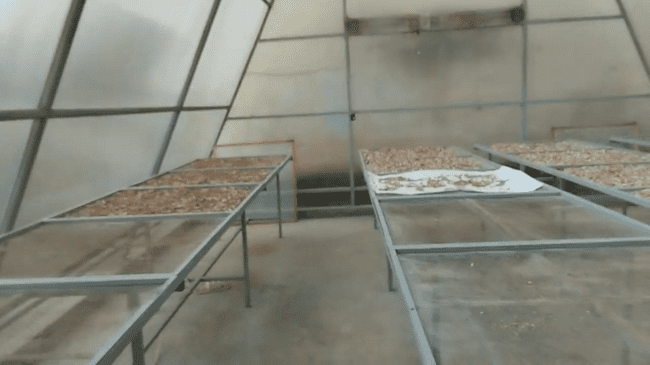


Figure 14. Photo of the inside of the SDD
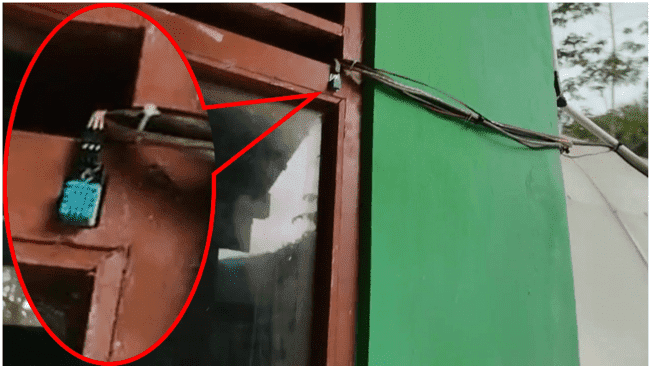
Figure 15. DHT11 position
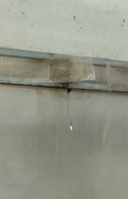
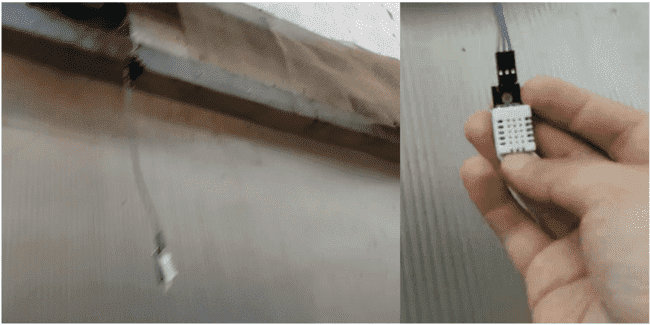

Figure 16. DHT22 position
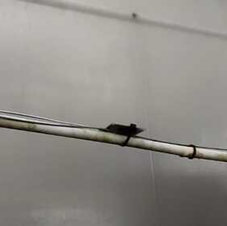
Figure 17. Conductor position
- Comparison
The comparison process involves comparing the temperature and humidity inside and outside the SDD to determine the time of peak temperature and the furthest difference between them. Figure 18 illustrates the comparison between the temperature inside and outside the SDD, while Figure 19 shows the comparison of humidity. Based on Figure 18, the peak temperature and the furthest difference occur at 09:00 AM Western Indonesia Time (WIB). Additionally, the figure demonstrates the consistent condition of higher temperatures inside the SDD compared to outside throughout the day.
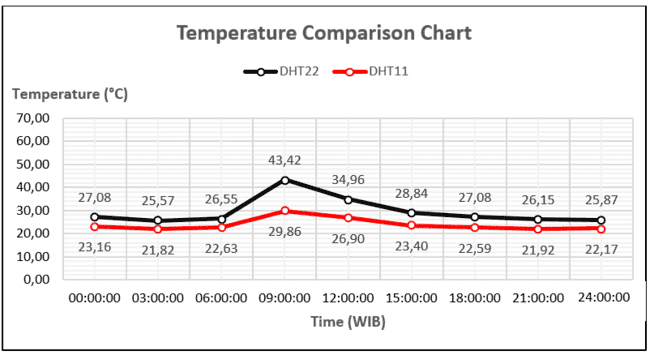
Figure 18. Temperature comparison chart
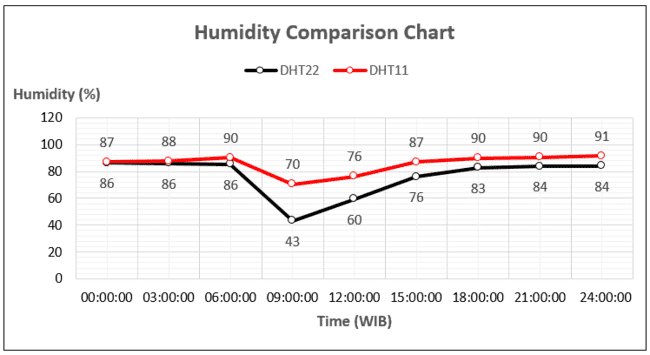
Figure 19. Humidity comparison graph
- CONCLUSION
Based on the conducted research, there is a correlation between weather, temperature, and humidity. Throughout the day, whether it is clear or rainy, the temperature inside the SDD is higher, and the humidity is lower compared to the temperature and humidity outside. The temperature error values for DHT22 and DHT11 with respect to ThermoPro are 1.572% and 0.721%, respectively. However, the humidity error values are different from the temperature, with an error of 5% for both DHT22 and DHT11 compared to ThermoPro, which indicates a need for program adjustments by adding values in the code. The peak temperature and the furthest difference between conditions inside and outside the SDD occur at 09:00 AM WIB. This information suggests that there are distinct differences in temperature and humidity between the interior and exterior of the SDD, regardless of whether it is clear or rainy.
REFERENCES
- L. Mutaali, “Study of the Development of Rural Areas Kulonprogo District (Locating a New Growth Center),” Tunas Geografi, vol. 9, no. 2, pp. 107-118, 2021, https://doi.org/10.24114/tgeo.v9i2.20156.
- N. Herdiani and S. Wijaya, “Community Empowerment for Self-sufficiency in Herbal Plants to Face The Covid-19 Pandemic,” Community Development Journal, vol. 5, no. 1, pp. 193-198, 2021, https://doi.org/10.33086/cdj.v5i1.1857.
- R. M. Yasi, R. S. Harsanti, and T. T. Larasati, “The Effect of Simplicia Drying Method on the Acquisition of Active Compound Levels of Grinting Grass Simplicia Extract (Cynodon dactylon (L.) Pers.),” Berkala Sainstek, vol. 10, no. 3, pp. 147-154, 2022, https://doi.org/10.19184/bst.v10i3.32309.
- J. E. Simbolon, S. Isdadiyanto, and A. J. Sitasiwi, “The Effect of Nanochitosan Preparation of Neem Leaf (Azadirachta indica) Ethanol Extract on the Liver Structure of White Rats (Rattus norvegicus),” International Journal of Health, Education & Social (IJHES), vol. 5, no. 6, pp. 21-31, 2022, https://doi.org/10.1234/ijhes.v5i6.237.
- S. Gorjian, R. Singh, A. Shukla, and A. R. Mazhar, “On-farm applications of solar PV systems,” in Photovoltaic solar energy conversion, pp. 147-190, 2020, https://doi.org/10.1016/B978-0-12-819610-6.00006-5.
- F. E. Gunawan et al., “Design and energy assessment of a new hybrid solar drying dome - Enabling Low-Cost, Independent and Smart Solar Dryer for Indonesia Agriculture 4.0,” in IOP Conference Series: Earth and Environmental Science, vol. 998, no. 1, p. 012052, 2022, https://doi.org/10.1088/1755-1315/998/1/012052.
- L. I. Ru, Z. Shu-ying, M. A. Deng-feng, and Z. H. I. Yong-feng, “Design of Raindrop detector based on Arduino,” in 2021 6th International Conference on Intelligent Computing and Signal Processing (ICSP), pp. 1145–1148, 2021, https://doi.org/10.1109/ICSP51882.2021.9408798.
- M. Y. Hew, A. M. Andrew, Y. Z. Q. Faith, Y. Y. Low, and M. K. Y. Natasha, “Automated clothesline retrieval system using LDR and raindrop sensors,” Engineering Technology International Conference (ETIC 2022), 2022, pp. 414-421, 2020, https://doi.org/10.1049/icp.2022.2652.
- S. A. Akbar, D. B. Kalbuadi, and A. Yudhana, “Online Monitoring Kualitas Air Waduk Berbasis Thingspeak,” Transmisi, vol. 21, no. 4, hal. 109–115, 2019, https://doi.org/10.14710/transmisi.21.4.109-115.
- A. S. Daghal, A. F. Athab, and G. M. Hatem, “Social Media Apps Controls Communication Devices Based on IoT,” in 2022 Muthanna International Conference on Engineering Science and Technology (MICEST), pp. 101–105, 2022, https://doi.org/10.1109/MICEST54286.2022.9790160.
- S. Wibawa dan M. Alaydrus, “Reliability Analysis of Wireless 802.11 Networks with Reliability Block Diagram,” in Proceedings of 2019 4th International Conference on Informatics and Computing, ICIC 2019, pp. 1–4, 2019, https://doi.org/10.1109/ICIC47613.2019.8985751.
- W. Yue, X. Wang, D. Chen, Z. Jiang, S. Sha, and P. Lv, “The Recognition and Information Extraction of Grid Wiring Diagram Based on Convolutional Neural Network,” in 2020 International Conference on Computer Vision, Image and Deep Learning (CVIDL), pp. 145–150, 2020, https://doi.org/10.1109/CVIDL51233.2020.00035.
- A. Bhattacharya, S. Roy, N. Sarkar, S. Malakar, and R. Sarkar, “Circuit Component Detection in Offline Handdrawn Electrical/Electronic Circuit Diagram,” in 2020 IEEE Calcutta Conference (CALCON), pp. 80–84, 2020, https://doi.org/10.1109/CALCON49167.2020.9106527.
- R. Siskandar, S. H. Santosa, W. Wiyoto, B. R. Kusumah, and A. P. Hidayat, “Control and automation: Insmoaf (Integrated Smart Modern Agriculture and Fisheries) on the greenhouse model,” Jurnal Ilmu Pertanian Indonesia, vol. 27, no. 1, pp. 141-152, 2022, https://doi.org/10.18343/jipi.27.1.141.
- F. I. Rukmana, Akmaliyah, E. Mulyana, A. Kusnawan, L. Kamelia, and W. Darmalaksana, “All-in-One Application For Smart Home System Base on Telegram Controlled,” 2020 6th International Conference on Wireless and Telematics (ICWT), pp. 1-4, 2020, https://doi.org/10.1109/ICWT50448.2020.9243631.
- G. M. Debele and X. Qian, “Automatic Room Temperature Control System Using Arduino UNO R3 and DHT11 Sensor,” 2020 17th International Computer Conference on Wavelet Active Media Technology and Information Processing (ICCWAMTIP), pp. 428-432, 2020, https://doi.org/10.1109/ICCWAMTIP51612.2020.9317307.
- S. G. E. Brucal, J. B. Colobong, D. B. De Guzman, J. N. M. De Leon, L. A. Samaniego, and E. D. Yong, “Papaya Maturity Classification in MATLAB Platform using Lab Method and DHT11 Sensor,” 2021 Fifth World Conference on Smart Trends in Systems Security and Sustainability (WorldS4), pp. 171-175, 2021, https://doi.org/10.1109/WorldS451998.2021.9514053.
- F. Margret Sharmila, P. Suryaganesh, M. Abishek, and U. Benny, “Iot Based Smart Window using Sensor Dht11,” 2019 5th International Conference on Advanced Computing & Communication Systems (ICACCS), pp. 782-784, 2019, https://doi.org/10.1109/ICACCS.2019.8728426.
- A. Faroqi, M. R. Efendi, D. T. Ismail, and W. Darmalaksana, “Design of Arduino Uno Based Duck Egg Hatching Machine With Sensor DHT22 and PIR Sensor,” 2020 6th International Conference on Wireless and Telematics (ICWT), pp. 1-4, 2020, https://doi.org/10.1109/ICWT50448.2020.9243640.
- P. Bhadani and V. Vashisht, “Soil Moisture, Temperature and Humidity Measurement Using Arduino,” 2019 9th International Conference on Cloud Computing, Data Science & Engineering (Confluence), pp. 567-571, 2019, https://doi.org/10.1109/CONFLUENCE.2019.8776973.
- Y. A. Ahmad, T. S. Gunawan, H. Mansor, B. A. Hamida, A. F. Hishamudin, and F. Arifin, “On the Evaluation of DHT22 Temperature Sensor for IoT Application,” 2021 8th International Conference on Computer and Communication Engineering (ICCCE), pp. 131-134, 2021, https://doi.org/10.1109/ICCCE50029.2021.9467147.
- Y. Zhang, W. Li, and M. Lexuan, “Optimization and improvement of ac resistance calculation method for multi-phase parallel-wiring cables,” Chinese Journal of Aeronautics, vol. 35, no. 3, pp. 356-366, 2022, https://doi.org/10.1016/j.cja.2021.07.007.
- G. Verma, P. Mittal, and S. Farheen, “Real Time Weather Prediction System Using IOT and Machine Learning,” 2020 6th International Conference on Signal Processing and Communication (ICSC), pp. 322-324, 2020, https://doi.org/10.1109/ICSC48311.2020.9182766.
- V. Gaikwad, P. Joshi, Y. Mudaliar, A. Naik, A. Gudal, and S. Bhandari, “Optimizing Power Consumption for Solar Powered Rechargeable Lithium Ion (Li-ion) Battery Operated IoT Based Sensor Node Using WeMos D1 Mini,” 2020 International Conference on Emerging Smart Computing and Informatics (ESCI), pp. 148-152, 2020, https://doi.org/10.1109/ESCI48226.2020.9167575.
- C. T. Kalaivani, G. G. S. S. Reddy, D. J. Reddy, and G. Rajasekhar, “Environmental Monitoring and Control System for Greenhouse with Node MCU and GSM Using IoT Devices,” 2022 8th International Conference on Smart Structures and Systems (ICSSS), pp. 1-4, 2022, https://doi.org/10.1109/ICSSS54381.2022.9782164.
- M. S. Roobini, P. Ajitha, A. Sivasangari, R. M. Gomathi, T. Anandhi, and Babu, “Moisture based Irrigation System using Node MCU and REES52 Sensor,” 2022 3rd International Conference on Electronics and Sustainable Communication Systems (ICESC), pp. 1027-1027, 2022, https://doi.org/10.1109/ICESC54411.2022.9885428.
- M. S. Novelan and M. Amin, “Monitoring System for Temperature and Humidity Measurements with DHT11 Sensor Using NodeMCU,” International Journal of Innovative Science and Research Technology, vol. 5, no. 10, pp. 123-128, 2020, https://www.ijisrt.com/monitoring-system-for-temperature-and-humidity-measurement-with-dht11-sensor-using-nodemcu.
- M. M. Islam, A. Rahaman, and M. R. Islam, “Development of smart healthcare monitoring system in IoT environment,” SN computer science, vol. 1, pp. 1-11, 2020, https://doi.org/10.1007/s42979-020-00195-y.
AUTHOR BIOGRAPHY

| Dzakarasma Tazakka Ma’arij is a student of the Department of Electrical Engineering, Faculty of Industrial Technology, Universitas Ahmad Dahlan, Yogyakarta, Indonesia
|
|
|

| Anton Yudhana completed his undergraduate education in the Department of Electrical Engineering at Institut Teknologi Surabaya, completed his master's education in the Department of Electrical Engineering at Universitas Gadjah Mada, completed his doctoral education in the Department of Electrical Engineering at the Universitas Teknologi Malaysia. Currently is a permanent lecturer in the Department of Electrical Engineering at Universitas Ahmad Dahlan. His research areas are high frequency and radio communication. |
Temperature and Humidity Monitoring System in Internet of Things-based Solar Dryer Dome
(Dzakarasma Tazakka Ma’arij)