Buletin Ilmiah Sarjana Teknik Elektro ISSN: 2685-9572
Detection of Fuel Purity Using the TCS3200 Sensor Using the Euclidean Distance Function
Muhamad Daffa Al Fitra, Abdul Fadlil
Department of Electrical Engineering, Universitas Ahmad Dahlan, Yogyakarta, Indonesia
ARTICLE INFORMATION |
| ABSTRACT |
Article History: Submitted 06 May 2023 Revised 20 June 2023 Accepted 25 July 2023 |
| 
Petroleum is oil produced by nature. It widely consumed by two-wheeled and four-wheeled vehicles. This research was conducted in order to know the RGB value of each fuel oil. This study aims to examine the purity of each fuel oil. Calculations in this study were carried out using the Euclidean Distance function aiming to find accuracy from the similarity of the average value and standard deviation of each fuel oil. In this study, detecting the purity of fuel oil using the TCS3200 sensor using the Arduino Uno as microcontroller and for output using I2C LCD 16x2. Before detecting fuel oil, sensor calibration is carried out for each fuel oil. After performing the calibration, 30 data collected. Data processing was carried out after the data was obtained, a search was carried out for the average and standard deviation of the RGB values for each fuel oil. After obtaining the values of the mean and standard deviation, we recalculate using the Euclidean Distance function because we get the similarity of the values of the mean and standard deviation. In the calculation of the accuracy of the Euclidean Distance function, it is found that the matching value of Pertamax is 25, Pertamax Turbo is 21, and Dexlite is 28. In this calculation, an accuracy of 82% is obtained. |
Keywords: RGB; Fuel Oil; Pertamax; Pertamax Turbo; Dexlite; Purity; TCS3200; Euclidean Distance |
Corresponding Author: Abdul Fadlil, Department of Electrical Engineering, Universitas Ahmad Dahlan, Yogyakarta, Indonesia. Email: fadlil@mti.uad.ac.id |
This work is licensed under a Creative Commons Attribution-Share Alike 4.0 
|
Document Citation: M. D. A. Fitra and A. Fadlil, “Detection of Fuel Purity Using the TCS3200 Sensor Using the Euclidean Distance Function,” Buletin Ilmiah Sarjana Teknik Elektro, vol. 5, no. 3, pp. 312-322, 2023, DOI: 10.12928/biste.v5i3.8260 |
- INTRODUCTION
Petroleum is one of the non-renewable natural resources most interested in in Indonesia, the use of petroleum as fuel is one of the big reasons for the great influence of petroleum because in Indonesia itself on average they still use vehicles that use fuel oil in the form of gasoline. Fuel oil is widely used in two, three and four-wheeled vehicles called gasoline or gasoline (US) or petrol (UK). In simple terms, gasoline is composed of straight chain hydrocarbons, starting from  (heptane) to
  , straight chains because gasoline is made of molecules consisting of hydrogen and carbon which bind together to form straight chains [1]–[4].
The need for fuel oil continues to increase along with the increase in population, motorized vehicles and industry. The increasing need for fuel oil is used by some people to make a profit by selling mixed fuel oil at the same price set by the government [5]–[6]. The more mixed ingredients that are put into the fuel, the lower the calorific value of the fuel will be even greater [7].
From this problem, this research was conducted by identifying the purity of fuel oil with a microcontroller-based tool in the form of Arduino Uno which functions as the brain of the tool to control the TCS300 GY-31 sensor or RGB (Red, Green, Blue) sensor so that you can judge from the color of the material tested fuel oil. The TCS3200 and TCS3210 programmable color light-to-frequency converters incorporate a configurable silicon photodiode and a current-to-frequency converter on a single monolithic CMOS integrated circuit. The output is a square wave (50% duty cycle) with a frequency directly proportional to the light intensity [8]–[10].
In this study used fuel oil in the form of Pertalite. Pertalite is now mostly consumed by the public because of its affordable price and includes subsidized fuel oil from the government. Now we find many street vendors who sell fuel to remote villages and most of the traders use pumping machines such as at gas stations or use 1 liter bottles, therefore it is necessary to conduct research to detect the purity of fuel oil using sensors. TCS300 on fuel oil sold by street vendors [11]–[14].
- METHODS
This study intends to determine the level of purity of the fuel oil used in this study, namely Pertamax, Pertamax Turbo, and Dexlite. What was done in this study was to find the average value and standard deviation of the fuel used. In this study using the Eulicdean Distance function method to find the similarity value of the average value and standard deviation for each BBM.
- Bock Diagram
The block diagram Figure 1 is a block diagram of the Fuel Purity Detection system Using the TCS3200 Sensor using Pertamax, Pertamax Turbo and Dexlite fuel oil. Next, the fuel is placed in the glass that has been prepared, then the TCS3200 sensor will read the RGB values obtained, then processed using Arduino Uno and the results obtained will be displayed on the I2C 16x2 LCD and after the desired data, proceed with data processing using Microsoft Excel and processed using the EulicDean Distance. Block Diagram image can be seen in Figure 1.
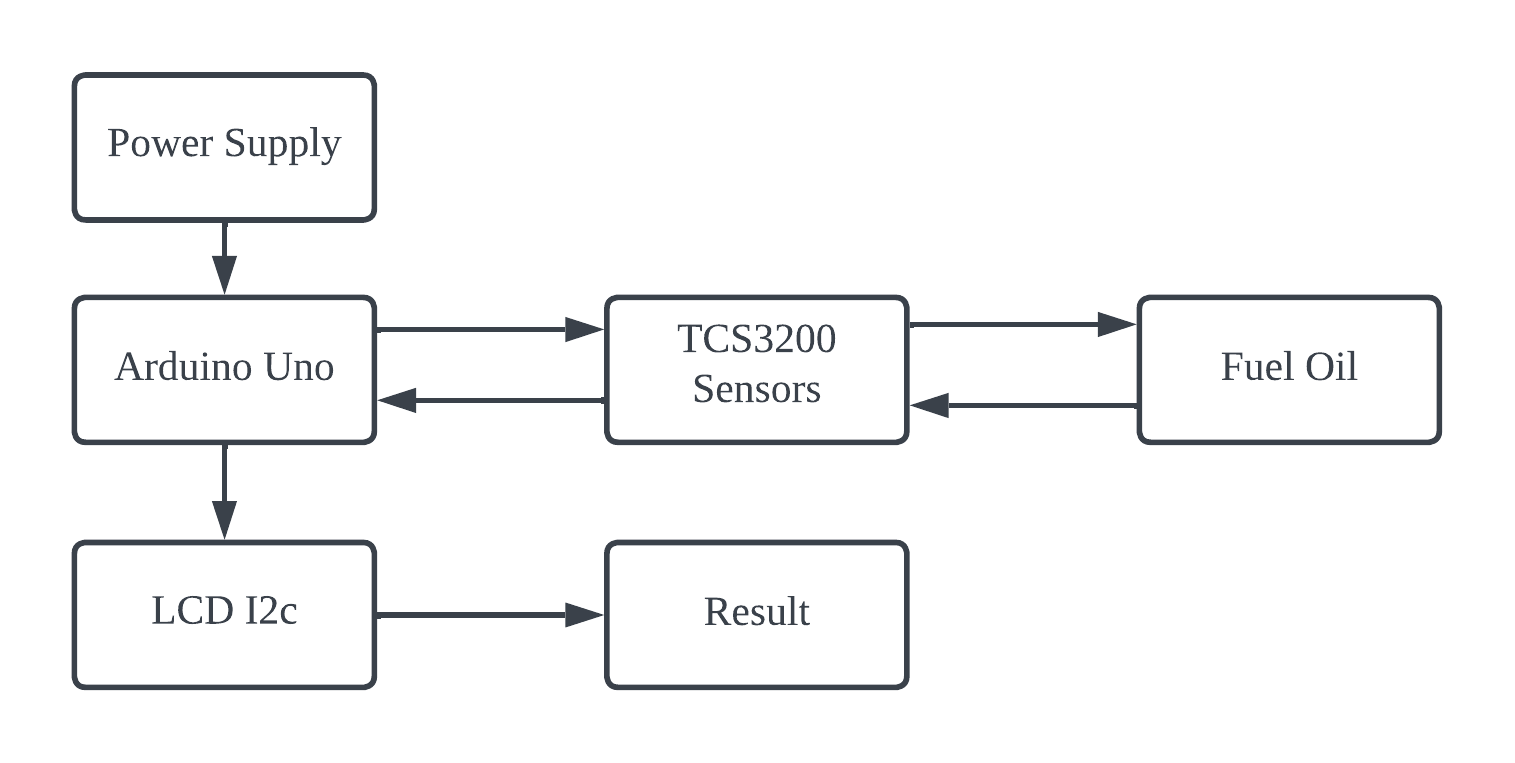
Figure 1. Fuel purity detection system block diagram
- Flowchart
The block diagram Figure 1 is a block diagram of the Fuel Purity Detection system Using the TCS3200 Sensor using Pertamax, Pertamax Turbo and Dexlite fuel oil. Next, the fuel is placed in the glass that has been prepared, then the TCS3200 sensor will read the RGB values obtained, then processed using Arduino Uno and the results obtained will be displayed on the I2C 16x2 LCD and after the desired data, proceed with data processing using Microsoft Excel and processed using the EulicDean Distance. Flowchart image can be seen in Figure 2.
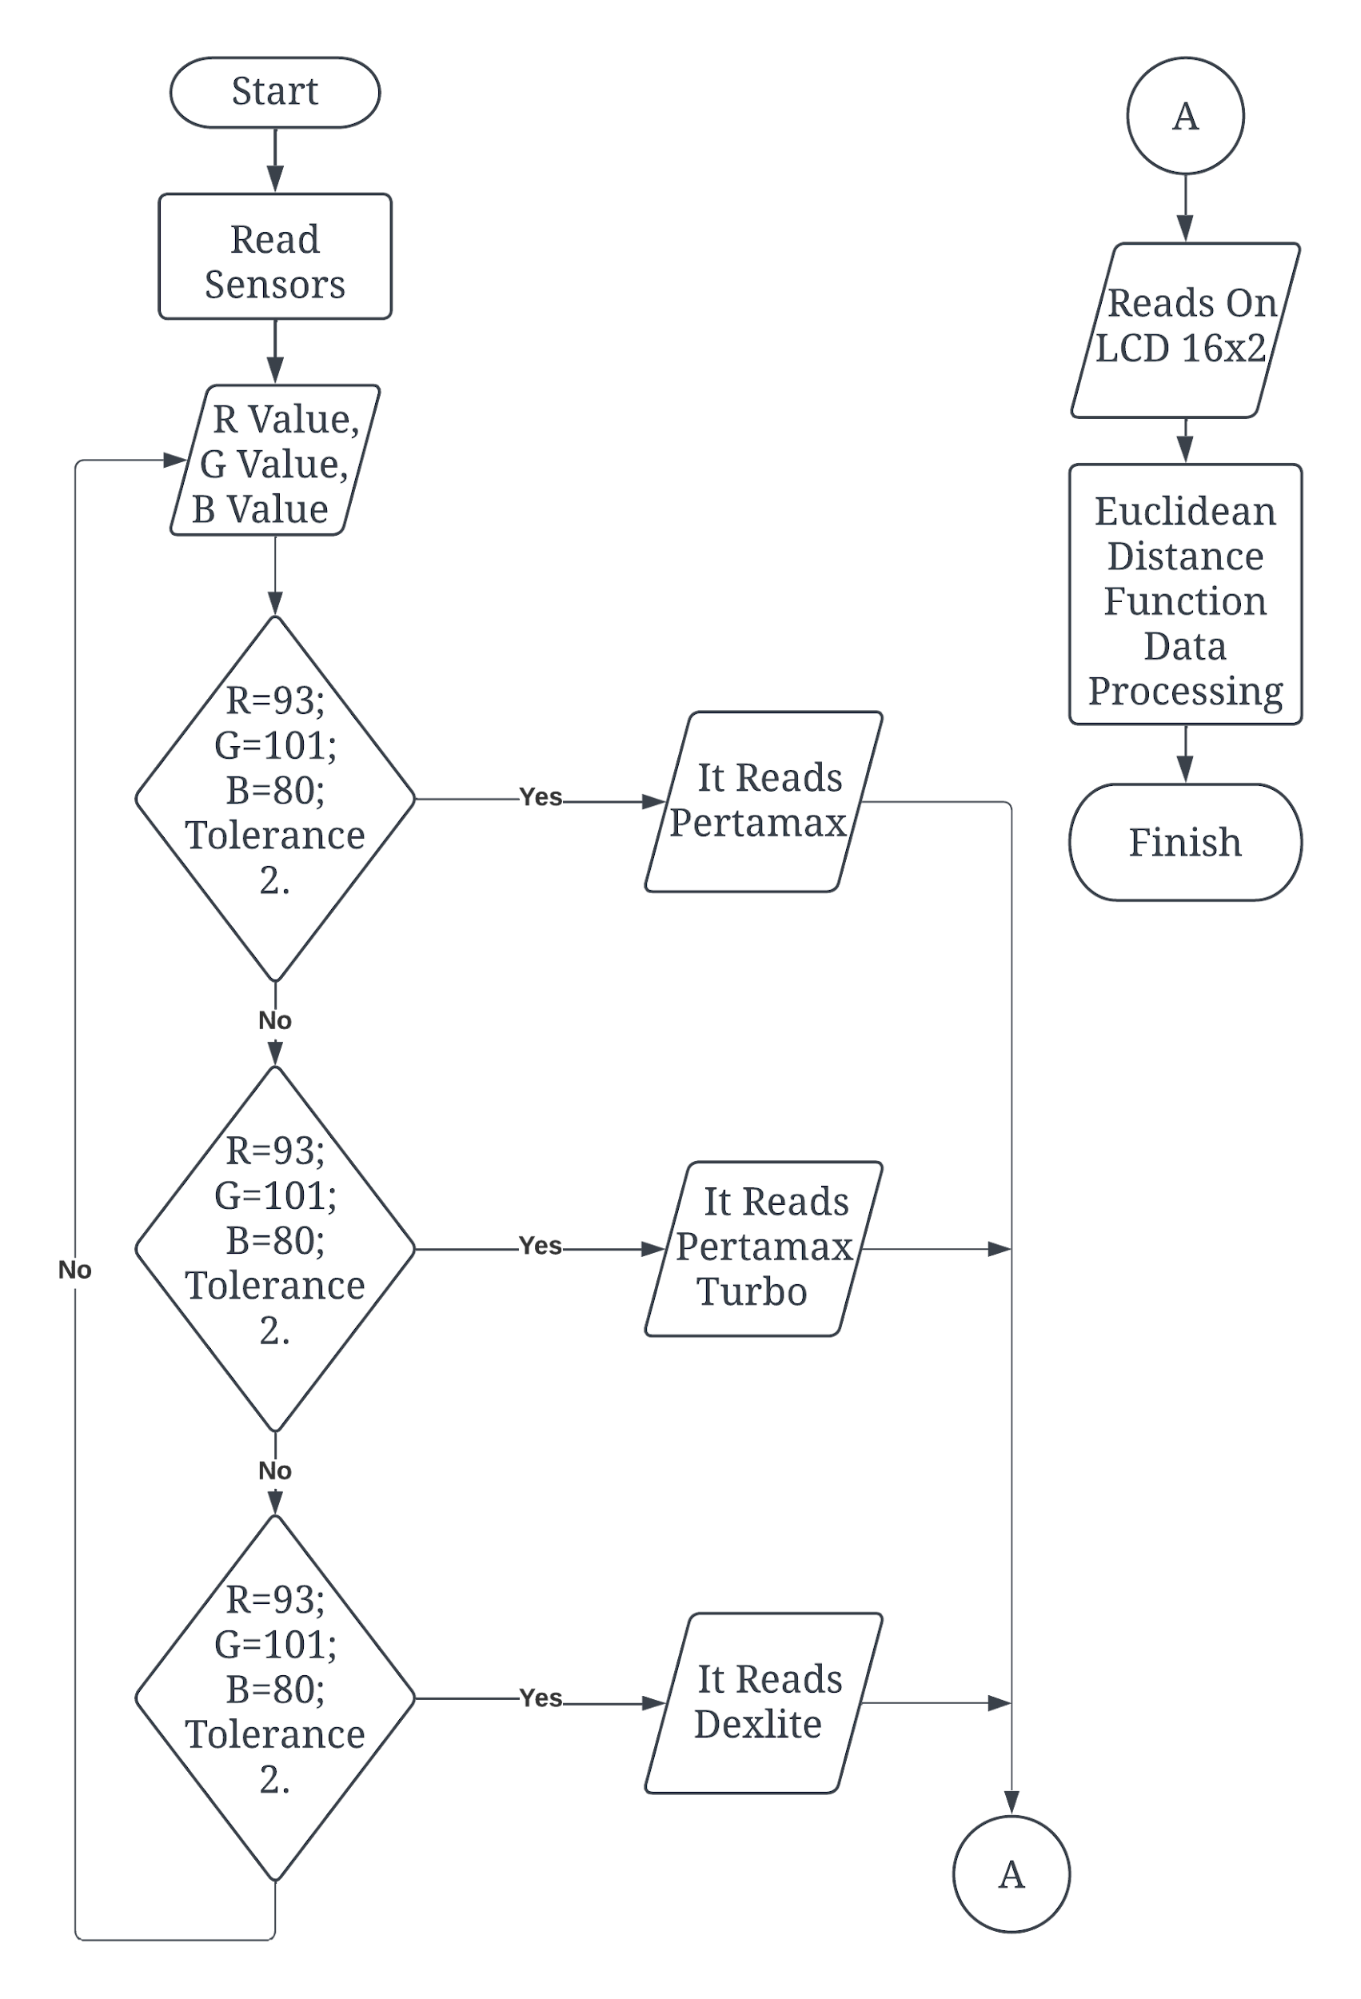
Figure 2. Fuel purity detection system flowchart
- Statistical calculation
In this study, calculations were made on the RGB values for each fuel oil used. The following is the equation used in this study. Average calculation (Mean).
- The equation for calculating the average value is shown in equation (1) [7].
| 
| (1) |
 is the calculated average and
  is the number of values from the first to the nth data.
- Variance Calculation (Variance)
The variance is the mean squared deviation from the mean or the mean squared deviation. The equation for calculating the average value is shown in equation (2).
| 
| (2) |
 is the calculation of variance,
  is Value data, is the average count (Means) and
  is the amount of data.
- Standard Deviation (Standard Deviation)
The standard deviation is the square root of the mean, the deviation from the mean, or the root of the mean squared deviation. The equation for calculating the average value is shown in equation (3).
| 
| (3) |
is the calculation of variance,  is Value data,
  is the Average value and is the amount of data.
- Eulicdean Distance Function Calculation Method
In this study, a method is used to calculate the similarity of values generated by the sensor for the method used is the K-NN algorithm, namely the Euclidean distance function. The K-NN algorithm is a method for classifying materials or objects that have past data and have very close distances between values. When the unknown label is inputted, K-Nearest Neighbor looks for the k data value that is closest to the query data in n-dimensional space. The distance between query data and learning data is calculated by measuring the distance between points representing query data and all points representing learning data using the Euclidean Distance formula [9]. The equation for calculating the Euclidean Distance method can be seen in equation (4) [5].
| 
| (4) |
 is the distance between X and Y, is Data center cluster,
  is Data on attribute,
  is cluster data, is the amount of data,
  is the data at the center of the i-th cluster and
  is data on each data to .
- Research Tools and Materials
In this study the detection of fuel purity uses components and software that are useful for detecting fuel purity. The following are the components and software used in this study.
- Arduino Uno
Arduino UNO is a microcontroller board based on ATmega328. The Arduino has 14 input/output pins, 6 of which can be used as PWM outputs, 6 analog inputs, a 16 MHz crystal oscillator, a USB connection, a power jack, an ICSP header, and a reset button. Arduino UNO can download supports microcontroller; can be connected to a computer using a USB cable and can be supplied with an AC to DC adapter or battery to get started [8]. The Arduino Uno image can be seen in Figure 3.
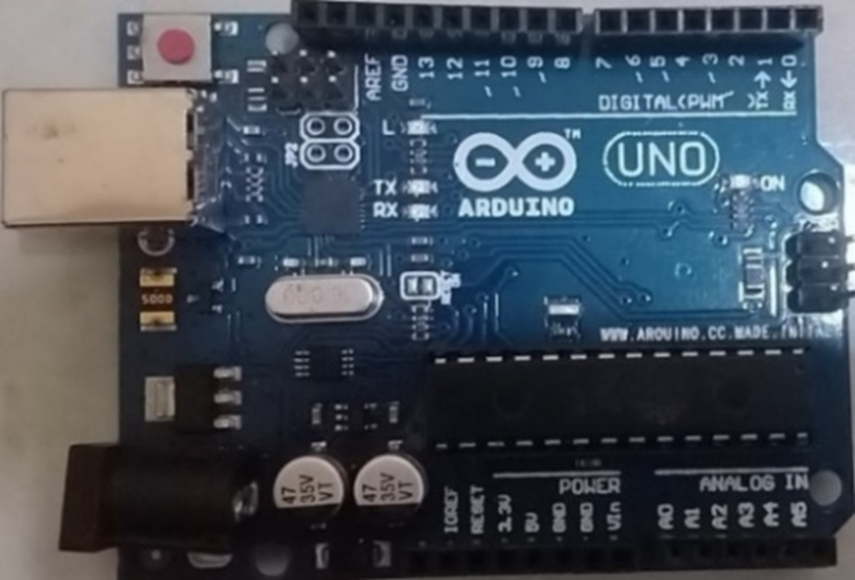
Figure 3. Arduino Uno
In Figure 3 this study uses Arduino Uno because it has 14 digital input/output pins (6 of which can be used as PWM outputs), 6 analog inputs, 16 MHz ceramic resonator (CSTCE16M0V53-R0), USB connection, power input, header ICSP, and reset button.
- TCS3200 Sensors
The TCS3200 light IC sensor has a high return rate, and has the ability to collect up to 25 data alerts at once as shown in Figure 4. Furthermore, this sensor has 10 terminals namely S0, S1, S2, S3, OUT, VDD, GND, OE, LED, GND. The functions of the 10 terminals are as follows:
a. S0 and S1 function as selector switches to switch the high frequency output.
b. S2 and S3 function as switch selectors of 4 diodes.
c. VDD serves as a voltage supply.
d. GND serves as the ground of the supply voltage.
e. OE functions as a frequency input with a weak scale.
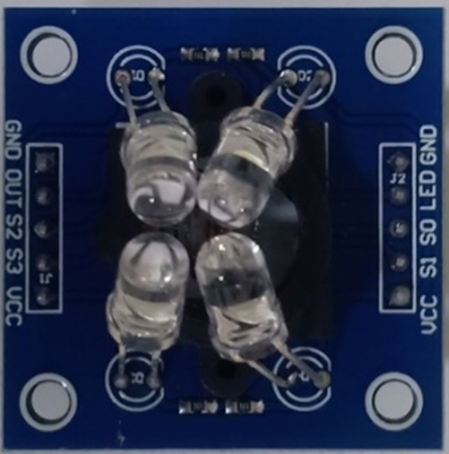
Figure 4. TCS3200 color sensor
In Figure 4 is the TCS3200 Sensor. This sensor is a converter that is programmed to give a warning about a certain frequency, which is derived from the photodiode, silicon, and current-to-frequency converter from a single monolithic CMOS IC. The sensor in question is a constant temperature (50 percent duty cycle) with a frequency that correlates with Light intensity [15]–[17]. The TCS3200 GY-31 sensor has an oscillator that can be used to measure square pulses and can be used to measure identical square pulses with detected warnings, the output frequency range values are at 2 kHz – 500 kHz, the TCS3200 GY-31 color sensor configuration can be seen on Table 1.
Table 1. TCS3200 GY-31 color sensor pin configuration
Name | PIN | I/O | Information |
GND | 4 | - | As a ground on the power supply |
OE | 3 | I | Output enable, as input for low scale output frequency |
OUT | 6 | O | As frequency output |
S0,S1 | 1,2 | I | As a selector switch on the high-scale output frequency |
S2,S3 | 7,8 | I | As a selector switch 4 groups of diodes |
Vcc | 5 | - | Power Supply |
As can be seen in Table 1 there are various pins and the uses of various types of sensors. The GND pin is the ground of the power supply, the OE pin is the input of the low-scale output frequency, the OUT pin is the output frequency that is read by the sensor, pins S0 and S1 as a high-scale output frequency selection switch, pins S2 and S3 as a selector switch for 4 groups of diodes and the Vcc pin as a supply voltage of 5V. Next, for an example of the RGB color composition value, see Table 2.
Table 2. Color decimal value
Color | Composition |
Red | Green | Blue |
Black | 0 | 0 | 0 |
White | 255 | 255 | 255 |
Red | 255 | 0 | 0 |
Green | 0 | 255 | 0 |
Blue | 0 | 0 | 255 |
Yellow | 255 | 255 | 0 |
Cyan | 0 | 255 | 255 |
Magenta | 255 | 0 | 255 |
In Table 2 there are color values on this sensor in the form of Red, Blue, Green. Each of these colors has a different color value, for red it has a decimal value of (255, 0, 0) for blue (0, 0, 255) and for green (0, 255, 0).
- How the TCS3200 Sensor Works
The TCS3200 GY-31 warning sensor is one of the highest quality with a given frequency. The 8x8 photodiodes used in this sensor are 64 photodiodes, each with 4 groups for warning lights, and a warning light with an LED on it can be used to illuminate the photodiodes. Wave warning (spectrum warning) of objects and LED light is connected to the microcontroller to provide warning information detected by the sensor. S2 and S3 function as sources of microcontroller information [18]. Using the mode for photodiode can be seen in Table 3.
Table 3. Photodiode grouping mode selection
S2 | S3 | Photodiode |
0 | 0 | Red |
0 | 1 | Blue |
1 | 0 | - |
1 | 1 | Green |
Table 3 shows the selection of Photodiode grouping modes for each pin on the sensor. Then the sensor will convert the current to a frequency that changes the photodiode reading into a square wave with a frequency proportional to the intensity of the selected color light, switches S0 and S1 will be active. The output is a square wave (50% duty cycle) with a frequency directly proportional to the light intensity, the output frequency range is 2 kHz-500 kHz [12]. The output frequency scale setting on the TCS3200 GY-31 can be seen in Table 4.
Table 4. Photodiode grouping mode selection
S0 | S2 | Output Frequency Scale |
LOW | LOW | Power Down |
LOW | HIGH | 2% |
HIGH | LOW | 20% |
HIGH | HIGH | 100% |
- LCD 16x2 I2C
The LCD circuit on this device is connected to the Inter Integrated Circuit module or often called I2C, which is a two-way serial communication standard using two specially designed channels for sending and receiving data [19]. The I2C microcontroller consists of SCL (Serial Clock) and SDA (Serial Data) channels which carry data information between the I2C and the controller [20]. Devices connected to the I2C Bus microcontroller can be operated as Master and Slave. The master is a device that starts data transfer on the I2C Bus by forming a Start signal, ends data transfer by forming a Stop signal, and generates a clock signal. The following is a 16x2 LCD circuit with an I2C Module on an Arduino microcontroller circuit [4]. Can be seen in Figure 5.
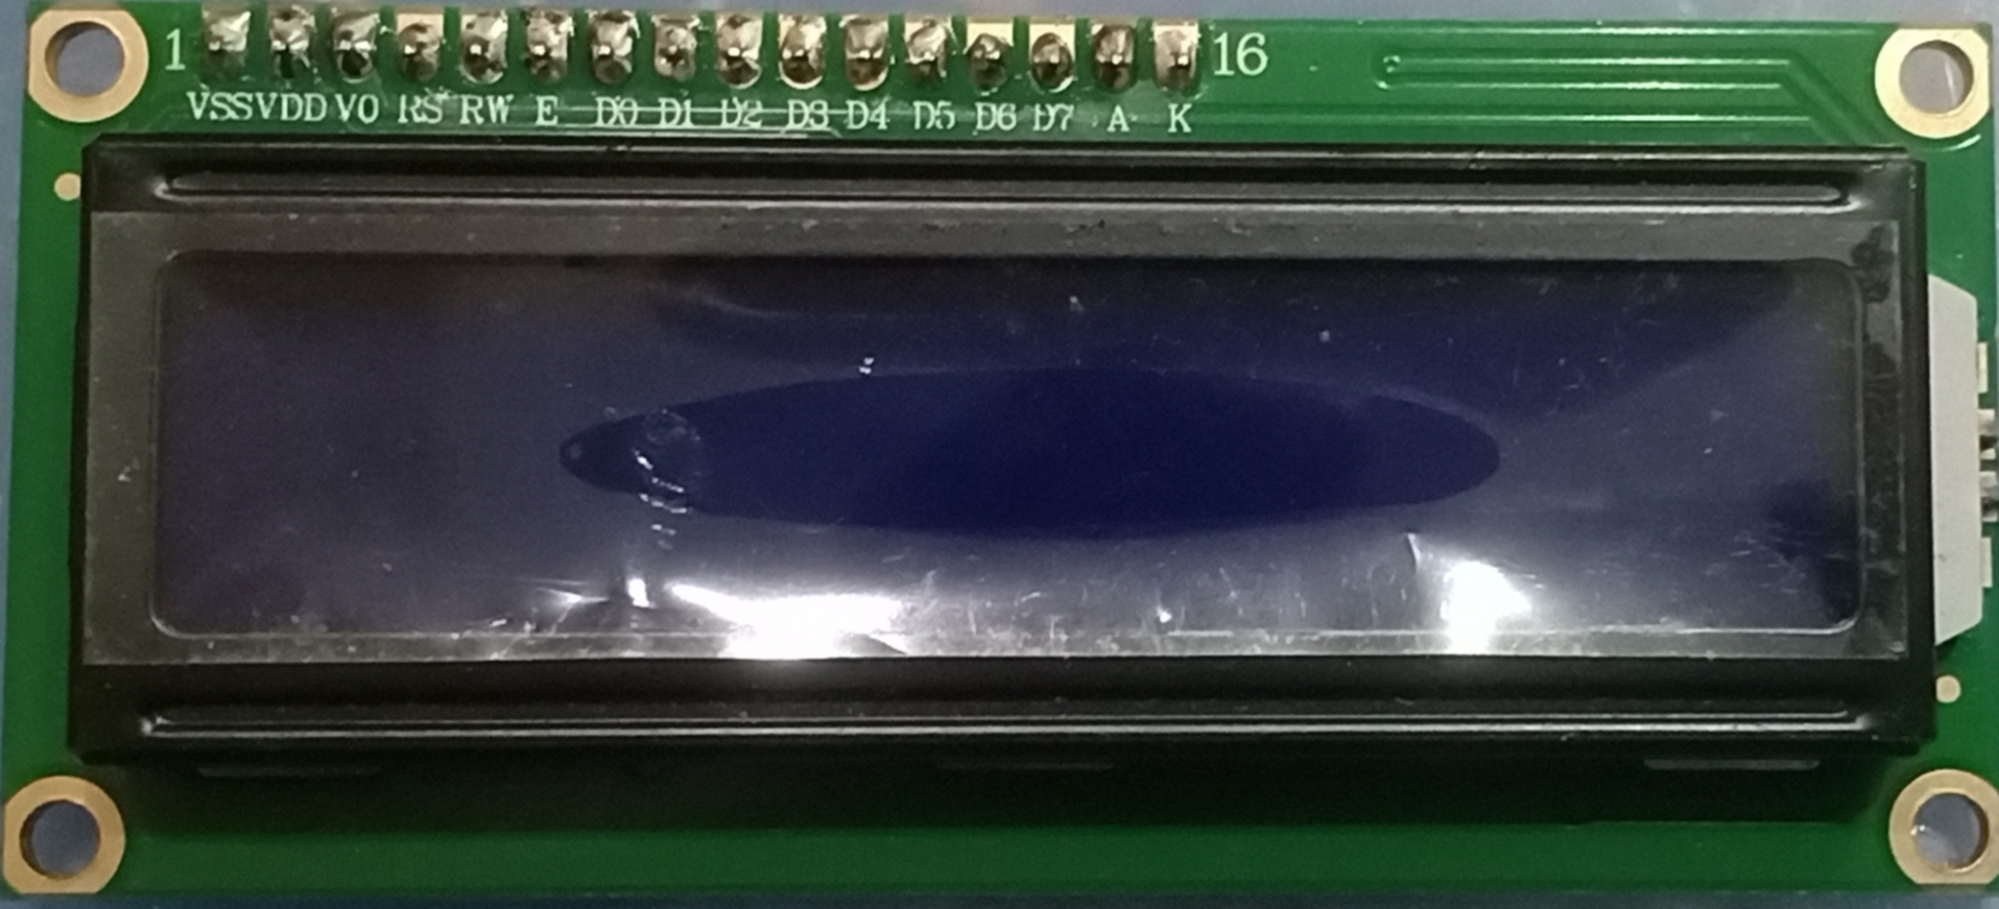
Figure 5. LCD I2C
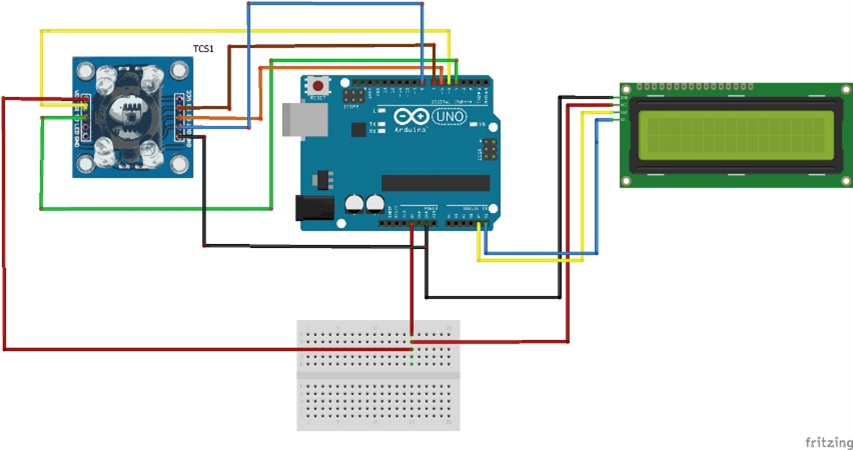
- Hardware Design
The hardware design then designs the cabling of the device system which is useful for describing the installation and assembly of components. In this design, Arduino Uno is used as a microcontroller which gets a 2V supply from an adapter. Can be seen in Figure 6 Hardware that has been made.
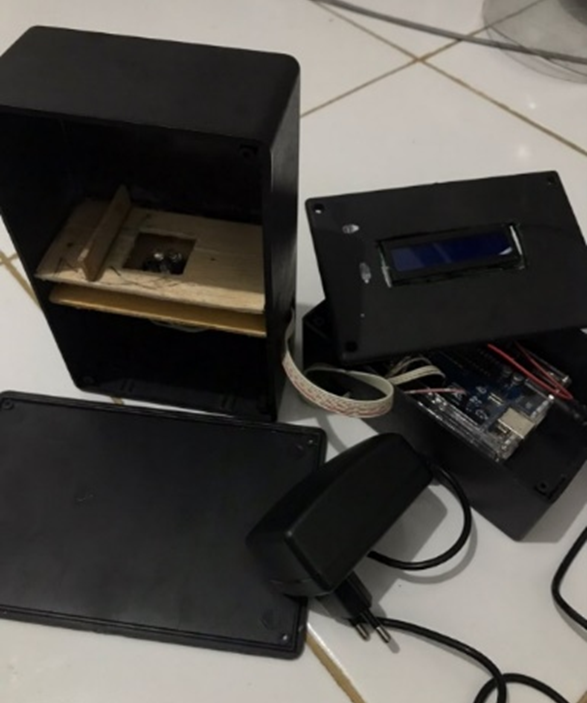
Figure 6. Fuel purity detection hardware
- RESULT AND DISCUSSION
In this study, the detection of fuel oil purity in the form of Pertamax, Pertamax Turbo, and Dexlite was carried out. In this research, we searched for the value of each RGB and then processed it through Microsoft Excel by calculating the average and standard deviation of each RGB value. Furthermore, after obtaining the average value and standard deviation, a calculation is carried out to find the similarity value using the Eulicdean Distance function method.
- TCS3200 Sensor Test Results on Pertamax Fuel Oil
The first test was carried out on BBM Pertamax by taking RGB values of 30 data. The Table 5 is the tests of TCS3200 sensor on Pertamax fuel oil.
Table 5. The results of the average value of the RGB value on Pertamax fuel oil
| Total Value | Average | Standard Deviation |
R (Red) | 2701 | 90.03 | 1.35 |
G (Green) | 2987 | 99.57 | 1.89 |
B (Blue) | 2345 | 78.17 | 2.34 |
Based on Table 5 the calculations that have been made on fuel oil in the form of Pertamax at a value of R = 92.33; G = 99.90; and B = 78.90. As for the standard deviation values of R=2.69; G=2.21; and B=1.97.
- TCS3200 Sensor Test Results on Pertamax Turbo Fuel Oil Turbo
The first test was carried out on fuel oil Pertamax by taking RGB values of 30 data. The Table 6 is the tests of TCS3200 sensor on Pertamax Turbo fuel oil.
Table 6. Testing of the TCS3200 sensor for Pertamax Turbo BBM
| Total Value | Average | Standard Deviation |
R (Red) | 2701 | 90.03 | 1.35 |
G (Green) | 2987 | 99.57 | 1.89 |
B (Blue) | 2345 | 78.17 | 2.34 |
Based on Table 6 the calculations that have been made on fuel oil in the form of Pertamax Turbo at values of R = 90.03, G = 99.56 and B = 7.16. As for the standard deviation values of R =1.35, G =1.89 and B = 2.33.
- TCS3200 Sensor Test Results on Dexlite Fuel Oil
The first test was carried out on Pertamax fuel oil by taking RGB values of 30 data. The Table 7 is the tests of TCS3200 sensor on Dexlite fuel oil.
Based on Table 7 the calculations that have been carried out on fuel oil in the form of Dexlite obtained an average value of R = 91.46, G = 99.76 and B = 81.80. As for the standard deviation values of R = 1.20, G = 1.11 and B = 1.24.
Table 7. Testing the TCS3200 sensor on BBM Dexlite
| Total Value | Average | Standard Deviation |
R (Red) | 2744 | 91.47 | 1.20 |
G (Green) | 2993 | 99.77 | 1.12 |
B (Blue) | 2454 | 81.80 | 1.25 |
In testing the fuel using the TCS3200 sensor on Pertamax, Pertamax Turbo and Dexlite fuels, the average value and standard deviation of each RGB value for the fuel oil tested were obtained. In Table 8 the average value and standard deviation of each fuel oil.
Table 8. The average value and standard deviation of fuel oil
Pertamax | Pertamax Turbo | Dexlite |

| 
| 
|
|
|
|
|
|
|
92.33 ± 2.70 | 99.90 ± 2.21 | 78.90 ± 1.97 | 90.03 ± 1.35 | 99.57 ± 1.89 | 78.18 ± 2.34 | 91.47 ± 1.20 | 99.47 ± 1.12 | 81.80 ± 1.25 |
In Table 8 is the result of the average value and standard deviation of the RGB values for each fuel oil used in this study. In this calculation, the average value and standard deviation are almost close to each fuel oil. In this calculation, a re-calculation is carried out to find the similarity value using the eulicdean distance function to find the accuracy of the similarity of the RGB values of each fuel oil.
- Similarity Testing
Accuracy calculations are carried out on data that has previously been obtained because the values of the average and standard deviation obtained from the fuel oil tested are almost the same and close. So, from the data obtained to get accurate results, calculations are made to look for accuracy using the Euclidean distance function method. Can be seen in Table 9 the results of the fuel data that has been obtained.
Table 9. The results of the Pertamax fuel similarity test
Pertamax |
Suitable | Not Suitable |
25 | 5 |
It can be seen in Table 9 data from fuel oil in the form of Pertamax is recalculated using the Eulicdean distance function method. There is a Match/Not match value in the final result of 25 Matching results and 5 unsuitable results. For values that do not match, it tends to be on Pertamax turbo fuel because the average value and standard deviation of the two fuel oils are very close.
Based on the data analysis above, an analysis of Pertamax has been carried out, followed by an analysis of data calculations from Pertamax Turbo fuel oil. It can be seen in Table 10 data analysis from Pertamax Turbo fuel oil.
Table 10. The results of the similarity test on Pertamax Turbo fuel oil
Pertamax Turbo |
Suitable | Not Suitable |
21 | 9 |
Based on Table 10 an analysis of the RGB values obtained in the Pertamax Turbo fuel oil test, it is found that Pertamax Turbo is similar to Pertamax fuel oil, because the average and standard deviation values for Pertamax fuel oil are smaller than the average and standard values. deviation from first max turbo. In this analysis, a suitable value of 21 was obtained and an unsuitable value of 9.
After testing the Eulicdean Distance Function analysis on Pertamax Turbo fuel oil, a Eulicdean Distance Function analysis test was carried out on Dexlite fuel oil. It can be seen in Table 11 the data analysis of the Eulicdean distance function on dexlite fuel oil.
Based on Table 11 obtained a match of 28 and a mismatch of 2. In this analysis there is a match for the fuel oil in the form of Pertamax and Pertamax Turbo because the average value and standard deviation of Dexlite fuel oil are smaller than Pertamax fuel oil and Pertamax Turbo. The Dexlite fuel oil is less compatible than Pertamax and Pertamax Turbo because the average and standard deviation values obtained by Dexlite fuel oil tend to be smaller.
Table 11. Dexlite BBM similarity test results
Dexlite |
Suitable | Not Suitable |
21 | 9 |
- Eulicdean Distance Function Calculation
In this research, data processing has been carried out using the Eulicdean function which aims to find similarities in the RGB values of Pertamax, Pertamax Turbo, and Dexlite fuels. Can be seen in Table 12 the calculation of the suitability obtained from the fuel used.
Table 12. Fuel purity detection system test results
Fuel Oil | Pertamax | Pertamax Turbo | Dexlite |
Pertamax | 25 | 5 | 0 |
Pertamax Turbo | 9 | 21 | 0 |
Dexlite | 1 | 1 | 28 |
Accuracy (%) = (Number of matches/Amount of Test Data) x 100% | 82% |
It can be seen in Table 12 that it is explained below that the match for Pertamax fuel oil is 25 and the mismatch is 5. For Pertamax Turbo fuel, the match is 21 and the mismatch is 9 which tends to be Pertamax oil. For the last fuel in the form of Dexlite, it gets a match of 28 and a mismatch of 2. After being calculated using the Eulicdean Distance function, the accuracy of the three fuel oils is 82%.
- Data on Pertamax and Pertamax Turbo Mixed Fuel Oils
In this research, the RGB value was searched for mixed fuel oil with a mixture of 0% to 100% with a total of 100 ml. The fuel oil used in this mixture is Pertamax and Pertamax Turbo. Can be seen in Table 13 is a mixture of Pertamax 0% and Pertamax Turbo 100%.
Table 13. Mixed data for Pertamax 0% Fuel Oil and 100% Pertamax Turbo
| Total Value | Average |
R (Red) | 2701 | 90.03 |
G (Green) | 2987 | 99.57 |
B (Blue) | 2345 | 78.17 |
In Table 13 are the results of sensor readings on 0% Pertamax Turbo and 100% Pertamax Turbo fuel oil. In this mixed fuel, the average value of the RGB value is R = 90.03, G = 99.56 and B = 78.16. After testing the fuel oil mixture of Pertamax 0% and Pertamax Turbo 100%, it is continued by testing data from the fuel oil mixture Pertamax 20% and Pertamax Turbo 80%. In the test carried out by taking 30 data can be seen in Table 14.
Table 14. Mixed data for Pertamax 20% Fuel Oil and 80% Pertamax Turbo
| Total Value | Average |
R (Red) | 2522 | 84.06667 |
G (Green) | 2731 | 91.03333 |
B (Blue) | 2212 | 73.73333 |
In Table 14 after obtaining data on the mixture of Pertamax 20% and Pertamax Turbo 80% fuel oil, the average value of the RGB value obtained is R = 84.06, G = 91.03 and B = 73.73. After testing the fuel oil mixture of Pertamax 20% and Pertamax Turbo 80%, it is continued by testing data from the fuel oil mixture Pertamax 40% and Pertamax Turbo 60%. In the test carried out by taking 30 data can be seen in Table 15.
Based on calculations that have been made on fuel oil in the form of Pertamax Turbo at a value of R = 88.46, G = 96.03 and B = 76.73. After testing the fuel oil mixture of Pertamax 20% and Pertamax Turbo 80%, it is continued by testing data from the fuel oil mixture Pertamax 50% and Pertamax Turbo 50%. In the test carried out by taking 30 data can be seen in Table 16.
Table 15. Mixed data of Pertamax 40% Fuel Oil and 60% Pertamax Turbo
| Total Value | Average |
R (Red) | 2654 | 88.46667 |
G (Green) | 2881 | 96.03333 |
B (Blue) | 2329 | 77.63333 |
Based on calculations that have been made on fuel oil in the form of Pertamax Turbo at a value of R = 88.46, G = 95.56 and B = 77.2. After testing the fuel oil mixture of Pertamax 20% and Pertamax Turbo 80%, it is continued by testing data from the fuel oil mixture Pertamax 60% and Pertamax Turbo 40%. In the test carried out by taking 30 data can be seen in Table 16.
Table 16. Mixed Data of Pertamax 50% BBM and 50% Pertamax Turbo
| Total Value | Average |
R (Red) | 2654 | 88.46667 |
G (Green) | 2867 | 95.56667 |
B (Blue) | 2316 | 77.2 |
- CONCLUSIONS
Data processing uses the Eulicdean Distance function by looking for a match of each fuel oil in the form of Pertamax, Pertalite, Pertamax Turbo with the match obtained by the prototype made at 82% of the three fuel oils.
ACKNOWLEDGEMENT
The author would like to thank everyone who helped in this writing, all assistance in the form of accompanying in writing and so forth.
REFERENCES
[1] Y. J Kuo, A. Maneengam, C. P. The, N. B. An, A. A. Nassani, M. Haffar, and A. Qadus, "Fresh evidence on environmental quality measures using natural resources, renewable energy, non-renewable energy and economic growth for 10 Asian nations from CS-ARDL technique," Fuel, vol. 320, no. 123914, 2022, https://doi.org/10.1016/j.fuel.2022.123914.
[2] H. Wang, B. Yang, Q. Zhang, and W.Zhu "Catalytic routes for the conversion of lignocellulosic biomass to aviation fuel range hydrocarbons," Renewable and Sustainable Energy Reviews, vol. 120, no. 109612, 2020, https://doi.org/10.1016/j.rser.2019.109612.
[3] I. Vinoth Kanna, M. Arulprakasajothi, and S. Eliyas, "A detailed study of IC engines and a novel discussion with comprehensive view of alternative fuels used in petrol and diesel engines," International Journal of Ambient Energy, vol. 42, no. 15, pp. 1794-1802, 2021, https://doi.org/10.1080/01430750.2019.1614994.
[4] S. Kartik, H. K. Balsora, M. Sharma, A. Saptoro, R. K. Jain, J. B. Joshi, and A. Sharma, "Valorization of plastic wastes for production of fuels and value-added chemicals through pyrolysis–A review," Thermal Science and Engineering Progress, vol. 32, no. 101316, 2022, https://doi.org/10.1080/01430750.2019.1614994.
[5] B. Lin and W. Wu, "The impact of electric vehicle penetration: A recursive dynamic CGE analysis of China," Energy economics, vol. 94, no. 105086, 2021, https://doi.org/10.1016/j.eneco.2020.105086.
[6] N. O. Kapustin and D. A. Grushevenko, "Long-term electric vehicles outlook and their potential impact on electric grid," Energy Policy, vol. 137, no. 111103, 2020, https://doi.org/10.1016/j.enpol.2019.111103.
[7] F. Khan, Y. Ali, and A. U. Khan, "Sustainable hybrid electric vehicle selection in the context of a developing country," Air Quality, Atmosphere & Health, vol. 13, pp. 489-499, 2020, https://doi.org/10.1007/s11869-020-00812-y.
[8] D. Chen, K. Cen, F. Chen, and Y. Zhang, "Solar pyrolysis of cotton stalks: Combined effects of torrefaction pretreatment and HZSM-5 zeolite on the bio-fuels upgradation," Energy Conversion and Management, vol. 261, no. 115640, 2022, https://doi.org/10.1016/j.enconman.2022.115640.
[9] R. A. Martínez-Ciro, F. E. López-Giraldo, A. F. Betancur-Perez, and J. M. Luna-Rivera, "Design and implementation of a multi-colour visible light communication system based on a light-to-frequency receiver," In Photonics, vol. 6, no. 2, p. 42, 2019, https://doi.org/10.3390/photonics6020042.
[10] H. Singh, G. Singh, D. K. Mahajan, N. Kaur, and N. Singh, "A low-cost device for rapid ‘color to concentration’quantification of cyanide in real samples using paper-based sensing chip," Sensors and Actuators B: Chemical, vol. 322, no. 128622, 2020, https://doi.org/10.1016/j.snb.2020.128622.
[11] B. F. R. Al Fajrin, A. Z. Jinan, P. S. Auliyah, A. F. Wulandari, and N.Tambunan, "The Impact of the Drastic Increase in Fuel Oil (Bbm) Prices," Journal of Social Research, vol. 2, no. 3, pp. 640-645, 2023, https://doi.org/10.55324/josr.v2i3.709.
[12] C. Erdogdu and K. Y. Arslanli, "Analysis of the factors affecting petrol station values in Turkey," Journal of Property Research, pp. 1-22, 2023, https://doi.org/10.1080/09599916.2023.2199758.
[13] G. Hilson and Y. Hu, "Changing priorities, shifting narratives: remapping rural livelihoods in Africa's artisanal and small-scale mining sector," Journal of Rural Studies, vol. 92, pp. 93-108, 2022, https://doi.org/10.1016/j.jrurstud.2022.03.010.
[14] S. P. Sigué and A. D. Biboum, "Franchising in the Gasoline Retail Industry in Cameroon: A Strategic Perspective," Business in Africa in the Era of Digital Technology: Essays in Honour of Professor William Darley, pp. 103-119, 2021, https://doi.org/10.1007/978-3-030-70538-1_7.
[15] K. M. C. Babu and P. A. Harsha Vardhini, "Design and Development of Cost Effective Arduino based Object Sorting System," 2020 International Conference on Smart Electronics and Communication (ICOSEC), pp. 913-918, 2020, https://doi.org/10.1109/ICOSEC49089.2020.9215269.
[16] A. R. Mohd Khairudin, M. H. Abdul Karim, A. A. Samah, D. Irwansyah, M. Y. Yakob, and N. M. Zian, "Development of Colour Sorting Robotic Arm Using TCS3200 Sensor," 2021 IEEE 9th Conference on Systems, Process and Control (ICSPC 2021), pp. 108-113, 2021, https://doi.org/10.1109/ICSPC53359.2021.9689114.
[17] R. Y. Dhawale and N. L. Gavankar, "Lane Detection and Lane Departure Warning System using Color Detection Sensor," 2019 2nd International Conference on Intelligent Computing, Instrumentation and Control Technologies (ICICICT), pp. 830-834, 2019, https://doi.org/10.1109/ICICICT46008.2019.8993254.
[18] F. H. Altaf Hussain, V. K. Shukla, and A. Tripathi, "Sorting of Objects from Conveyer Belt through Colour Detection and Audrino UNO," 2021 International Conference on Communication information and Computing Technology (ICCICT), pp. 1-5, 2021, https://doi.org/10.1109/ICCICT50803.2021.9510037.
[19] H. Kareem and D. Dunaev, "The Working Principles of ESP32 and Analytical Comparison of using Low-Cost Microcontroller Modules in Embedded Systems Design," 2021 4th International Conference on Circuits, Systems and Simulation (ICCSS), pp. 130-135, 2021, https://doi.org/10.1109/ICCSS51193.2021.9464217.
[20] I. G. M. N. Desnanjaya and I. G. I. Sudipa, "The Control System of Kulkul Bali Based on Microcontroller," 2019 5th International Conference on New Media Studies (CONMEDIA), pp. 244-250, 2019, https://doi.org/10.1109/CONMEDIA46929.2019.8981841.
AUTHOR BIOGRAPHY

| Muhamad Daffa Al Fitra is completed his undergraduate education at the Ahmad Dahlan University electrical engineering study program in 2023. |
|
|

| Abdul Fadlil is received the B.Eng. in Physic – Electrical & Insrumentation and M.Eng. in Electrical Engineering from Universitas Gadjah Mada in 1992 and 2000, respectively. He also received his Ph.D. in Electrical Engineering from Universiti Teknologi Malaysia in 2006. He is currently as Associate Professor with the Electrical Engineering Department, Universitas Ahmad Dahlan (UAD), Yogyakarta, Indonesia. His current research interests include pattern recognition, image processing, and artificial intelligence.
|
|
|
Detection of Fuel Purity Using the TCS3200 Sensor Using the Euclidean Distance Function
(Muhamad Daffa Al Fitra)