Buletin Ilmiah Sarjana Teknik Elektro ISSN: 2685-9572
Guava Fruit Detection and Classification Using Mask Region-Based Convolutional Neural Network
Bayu Alif Farisqi, Adhi Prahara
Department of Informatics, Universitas Ahmad Dahlan, Yogyakarta, Indonesia
ARTICLE INFORMATION |
| ABSTRACT |
Article History: Submitted 12 December 2022 Revised 20 January 2023 Accepted 25 January 2023
|
| 
Guava has various types and each type has different nutritional content, shapes, and colors. It is often difficult for some people to recognize guava correctly with so many varieties of guava on the market. In industry, the classification and segmentation of guava fruit is the first important step in measuring the guava fruit quality. The quality inspection of guava fruit is usually still done manually by observing the size, shape, and color which is prone to mistakes due to human error. Therefore, a method was proposed to detect and classify guava fruit automatically using computer vision technology. This research implements a Mask Region-Based Convolutional Neural Network (Mask R-CNN) which is an extension of Faster R-CNN by adding a branch that is used to predict the segmentation mask in each region of interest in parallel with classification and bounding box regression. The system classifies guava fruit into each category, determines the position of each fruit, and marks the region of each fruit. These outputs can be used for further analysis such as quality inspection. The performance evaluation of guava detection and classification using the Mask R-CNN method achieves an mAR score of 88%, an mAP score of 90%, and an F1-Score of 89%. It can be concluded that the proposed method performs well in detecting and classifying guava fruit. |
Keywords: Mask R-CNN; Classification; Detection; Guava fruit; Computer vision
|
Corresponding Author: Adhi Prahara, Department of Informatics, Universitas Ahmad Dahlan, Yogyakarta, Indonesia. Email: adhi.prahara@tif.uad.ac.id |
|
This work is licensed under a Creative Commons Attribution-Share Alike 4.0 
|
|
Citation Document: B. A. Farisqi and A. Prahara, “Guava Fruit Detection and Classification Using Mask Region-Based Convolutional Neural Network,” Buletin Ilmiah Sarjana Teknik Elektro, vol. 4, no. 3, pp. 186-193, 2022, DOI: 10.12928/biste.v4i3.7412. |
- INTRODUCTION
One of the edible and popular fruits in Indonesia is the Guava fruit. Guava is a fruit originating from countries in Central America such as Brazil, Venezuela, Colombia, and Mexico. Guava production over the last 3 years has increased dramatically because of the high market demand. The data obtained from the Badan Pusat Statistik Indonesia (BPS) shows that Guava fruit production in 2019 was 239,407 tons and in 2020 was 396,268 tons, an increase of 60%. Guava has a delicious taste and rich nutritional content such as vitamin C, vitamin A, antioxidants, and other nutrients. It provides various benefits such as preventing diarrhea, metabolic disorders, diabetes, and obesity [1]. Each type of guava has different nutritional contents and benefits [2]. Currently, the easiest way to recognize the type of guava fruit is based on its shape, size, and color. However, it is often difficult for some people to recognize guava correctly with so many varieties of guava on the market. This can happen due to the different perceptions of several factors when selecting guava fruit. So sometimes buyers don’t know the type of guava they want to buy. The quality inspection of guava fruit is usually still done manually by observing the size, shape, and color which is prone to mistakes due to human error. Based on the description of the problems, a solution can be proposed by utilizing computer vision technology.
Computer vision has been widely implemented for fruit classification [3]–[9] and detection [10]–[14]. Some reviews about fruit classification [15], [16] show that computer vision methods have high performance when applied to this task. The methods can be divided into machine learning approaches [3], [5], [7] or modern deep learning approaches [4], [6], [8]–[14]. In this research, a method to detect and classify guava fruit was proposed using the Region based Convolutional Neural Network (R-CNN), which is the Mask R-CNN model [17]. R-CNN [18] is based on a CNN [11] and has been widely used in object detection [19]–[21]. The concept of the R-CNN model is explained in the following steps. In the first step, the region proposal method (RPN) is used to look for parts of the image that may be an object. In the second step, each part is used as input for CNN. And lastly, each feature generated by CNN becomes the input for SVM and linear regressors. The R-CNN model is improved into a Fast R-CNN [22] and then to a Faster R-CNN [23] that is faster in terms of computing. Then after faster R-CNN, there is the Mask R-CNN method [17] which is an extension of Faster R-CNN by adding branches that are used to predict the segmentation mask in each region of interest in parallel with classification and bounding box regression.
The benefit of using Mask R-CNN is shown in its complete solution for computer vision tasks where classification, detection, and segmentation are performed in one architecture. It also has been implemented for fruit detection [10], [11] and achieves a good result. Yu et al. introduced the use of the Mask R-CNN method in detecting strawberries [10]. The research was conducted by combining ResNet50 as a backbone network with Feature Pyramid Network (FPN) architecture for feature extraction. In their study, the RPN was thoroughly trained to make regional proposals for each feature map. The results showed 95.78% of precision and 89.85% of intersection over union (IoU). The prediction results of 573 ripe fruit-picking points show that the average error is around 1.2. This method increases universality and resilience in non-structural environments. Ganesh et al. implemented the Mask R-CNN method in detecting and segmenting orange fruits [11]. A deep learning approach consisting of HSV images and RGB images taken from an orange orchard with natural lighting. This study compares the results using RGB images with RGB + HSV. The results show that adding HSV data will increase the precision to 0.975. These results show that the presence of HSV data with RGB images can significantly reduce the positive rate error, namely increasing the precision score and increasing the mask segmentation performance.
In this research, a method was proposed to classify and perform segmentation of guava fruit using Mask R-CNN. The contribution of this research is shown in the use of the Mask R-CNN model that produces output for classification, detection, and segmentation in a single architecture. The proposed method can determine the type of guava fruit, locate the position of each guava fruit, and mark the segmented region of each guava fruit found in the image even in the wild where guava fruit is captured hanging in their trees. The result of this step can be used later for guava quality inspection. The rest of the paper is explained as follows. Section 1 introduces the background problems and related works, section 2 presents the proposed method, section 3 presents the result and discussion and finally, section 4 presents the conclusion of this work.
- METHODS
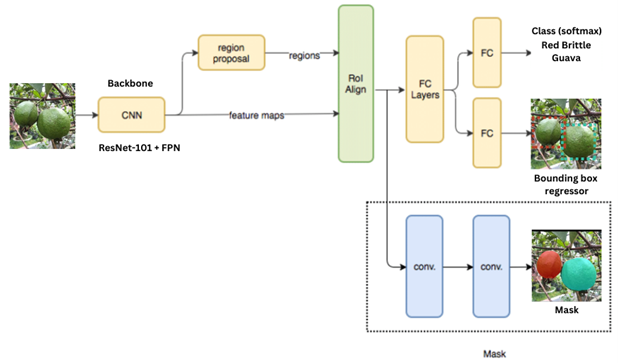
The general step of the proposed guava fruit classification and segmentation method is shown in Figure 1. Based on Figure 1, the proposed method uses the Mask R-CNN model to detect, classify and perform segmentation of guava fruit image. In the preprocessing step, the dataset which is guava fruit images are resized and normalized. The image is fed into a CNN model namely ResNet101 [24] as the backbone followed by FPN. This process produces feature maps to construct region proposals via Region Proposal Network (RPN). The ROI then aligned and branched to convolutional networks to produce the mask for segmentation and to fully connected layers to classify the image and construct the bounding box for detection. The outputs of this network are masks for segmentation, bounding box coordinates for detection, and fruit categories.
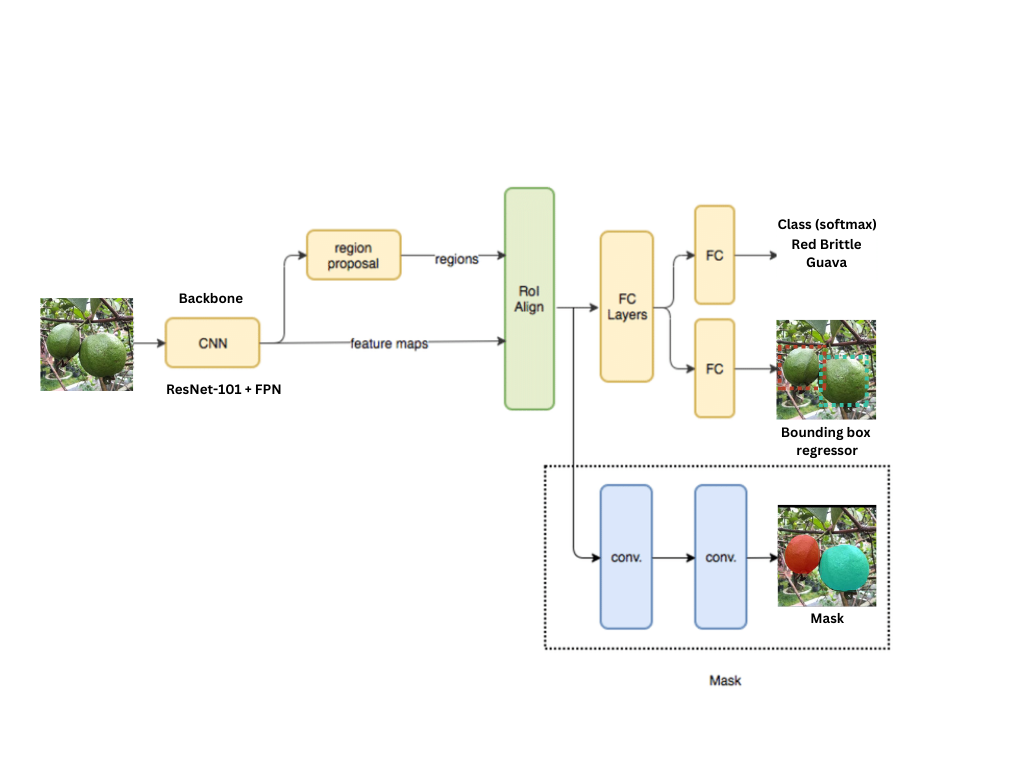
Figure 1. The proposed detection and classification method using Mask R-CNN.
Mask R-CNN is based on CNN architecture. CNN is a deep learning algorithm developed from the Multi-Layer Perceptron (MLP). This MLP algorithm is used to process two-dimensional data. CNN algorithm consists of several layers, including an input layer, an output layer, and several hidden layers. This hidden layer is filled with convolutional layers, fully connected layers, and pooling layers. The convolutional layer is the main block of CNN in which some filters are learned by performing convolution operations which have the aim of extracting features and studying feature representations from the input layer. The pooling layer has the function of reducing the spatial size of the convolution features. The pooling layer has two types, namely max-pooling which returns the maximum value, and average pooling which returns the average value of the image covered by the kernel. A fully connected layer is used to perform transformations on the data dimensions to be able to classify data linearly. In this research, ResNet-101 [24] is used as the backbone for the Mask R-CNN. The architecture of ResNet-101 is shown in Figure 2. Based on Figure 2, ResNet-101 has deep layers with residual connections. Although ResNet-101 has deeper layers, the complexity is smaller, for example, compare to VGG16 [25]. The deeper layer will extract richer features representation and with low complexity, the computation will be faster.
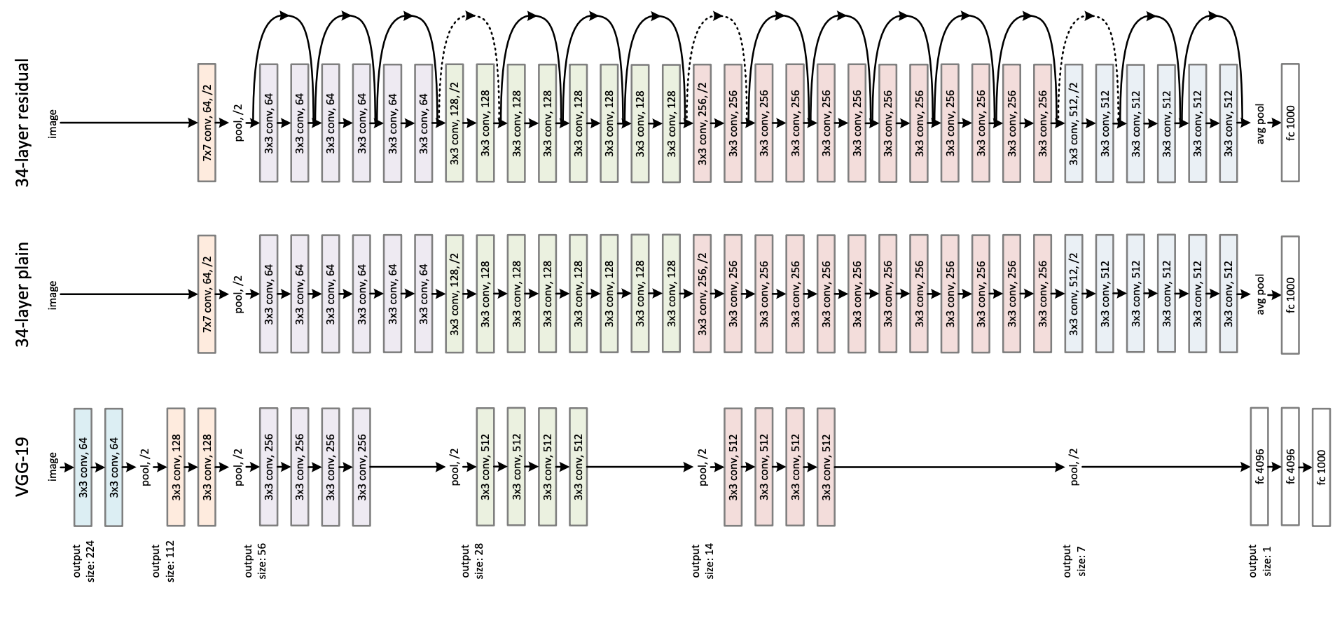
Figure 2. ResNet-101 architecture [24].
Mask R-CNN [17] is a model created through the development of a Faster R-CNN [23], in a simple concept this Mask R-CNN is a Faster R-CNN algorithm that has two outputs for each candidate object, bounding box offset, and class label. The Mask R-CNN can detect objects in an image and at the same time perform mask segmentation. Instance segmentation is almost the same as object detection, where each object is detected one by one and then combined with semantic segmentation so that each object's location, class, and pixel can be distinguished. Mask R-CNN applies multiple backbone architecture in extracting features. Backbones that can be used for Mask R-CNN are ResNet and FPN. The RPN process produces a Region of Interest (RoI) to become an input for the instance detection and segmentation network. More details can be seen in [17]. Several hyperparameters can be set when conducting Mask R-CNN training including epochs, steps per epoch, step validation, the CNN backbone, the number of classes, network architecture, the image dimension, RPN, Non-Maximum Suppression (NMS) threshold, and mean pixel of the training dataset.
The Mask R-CNN is divided into 3 parts, namely features extraction network, regions proposal network, and instance detection and segmentation networks. Feature extraction is used to extract the information contained in the image. In addition, feature extraction also aims to present the information that has been taken into a lower-dimensional space, so the classification process will be easier. The Mask R-CNN algorithm architecture combines ResNet101 and FPN (Feature Pyramid Network) in generating ROI features when performing feature extraction. FPN is a basic component in a recognition system that aims to detect objects at different scales using the same image. There are two ways of processing information carried out by FPN, namely bottom-up and top-down. ResNet is used to extract bottom-up data processing. The higher spatial dimension will increase the semantic value. The top-down processing will increase the resolution of the semantic layer but the object location is not precise. FPN will add lateral connections between reconstructed layers and appropriate map features to help detectors predict the locations. Lateral connection is an addition and convolution operation between the two corresponding labels of the two pathways. Finally, the outputs of Mask R-CNN are generated from the convolutional layers that produce a mask for segmentation and from the fully connected layer that produces a classification label and bounding box of object position.
- RESULT AND DISCUSSION
The proposed method is run on GPU provided by Google Colab, written in Python with TensorFlow, OpenCV, and Scikit-Learn libraries. In this section, the dataset, the experiment, and the performance evaluation results will be discussed in detail.
3.1. Dataset
The data that will be used in this research is image data consisting of 4 types of popular guava in Indonesia, namely crystal guava (jambu biji kristal), Bangkok guava (jambu biji Bangkok), red breadfruit guava (jambu biji sukun merah), and red brittle guava (jambu biji getas merah). This image data is mainly obtained by taking directly guava fruits in a uniform background using a camera that has a 12 MP resolution and some additional images are downloaded from the internet. The number of image data that has been collected is 880 images which will be divided into training and validation data with a 70%:30% ratio respectively [26]. In addition to training and validation data, researchers also collect data for testing. The results of data collection that will be used for training, validation, and testing can be seen in Table 1.
Table 1. The guava fruit dataset
Type of data | Number of class | Extension | Total data |
Training Data | 4 | .jpg | 616 |
Validation Data | 4 | .jpg | 264 |
Testing Data | 4 | .jpg | 200 |
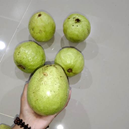
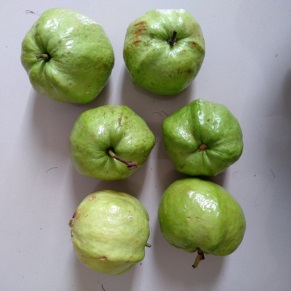
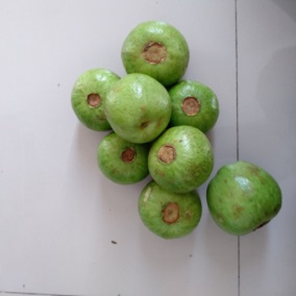
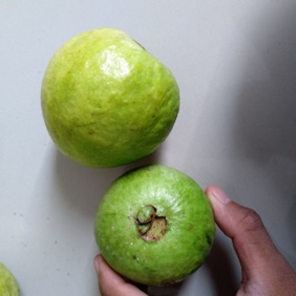
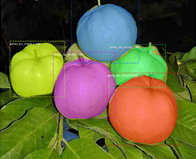
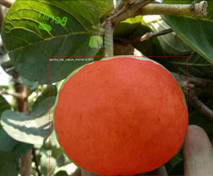
Based on Table 1, 616 images will be used for training where there are four classes of guava fruit. To validate the model, a total of 264 images are used. After the model is trained and achieves high performance, the trained model is tested on 200 new data. Figure 3 shows the sample of the guava fruit images used in this research where 3(a) is the Bangkok guava, 3(b) is the crystal guava, 3(c) is the red breadfruit guava, and 3(d) is the red brittle guava.
| 
| 
| 
|
(a) Bangkok guava | (b) Crystal guava | (c) Red breadfruit guava | (d) Red brittle guava |
Figure 3. Sample of fruit images
3.2. The Training Process
The training process using 100 epochs lasted for 3 hours 6 minutes 3 seconds. In the training process of this model, each step will produce a loss function value, bounding box loss, mask loss, and validation loss. This loss value continues to fall with the increasing number of steps. For more details regarding the loss score for all epochs during the training process, see Figures 4(a), 4(b), and 4(c) which are the graph of the loss score, bounding box loss, and mask loss respectively obtained from the training and validation process. The orange line is the result of the training while the blue line is the result of the validation. On each graph we can see that the loss has decreased during the training, this indicates that the output generated by the model is closer to the correct prediction as the epoch increase.
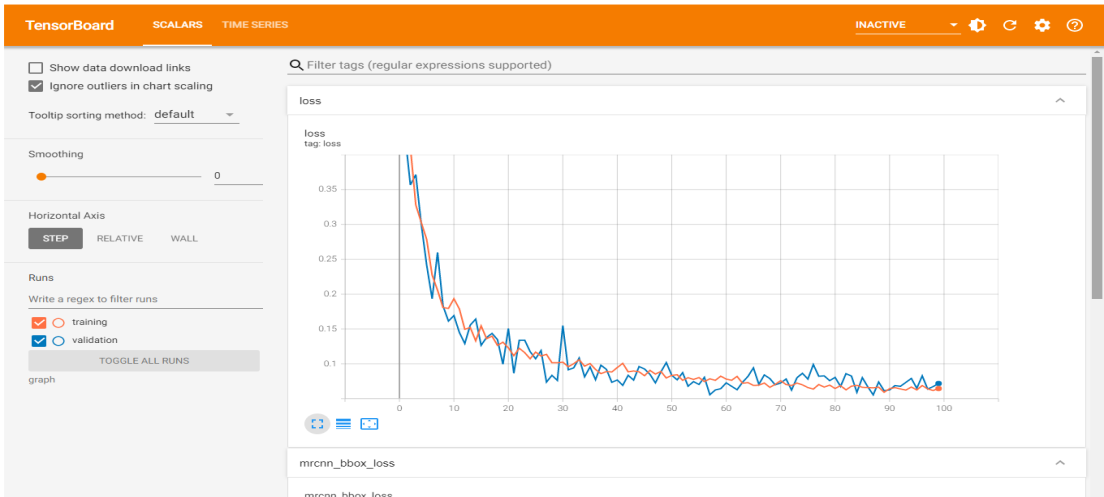
(a) Loss during training (orange line) and validation (blue line)
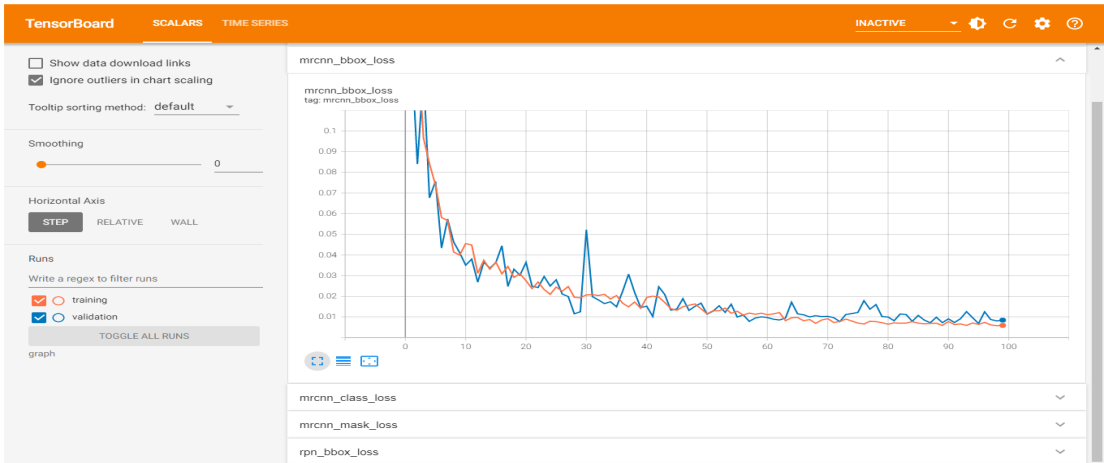
(b) Bounding box loss during training (orange line) and validation (blue line)
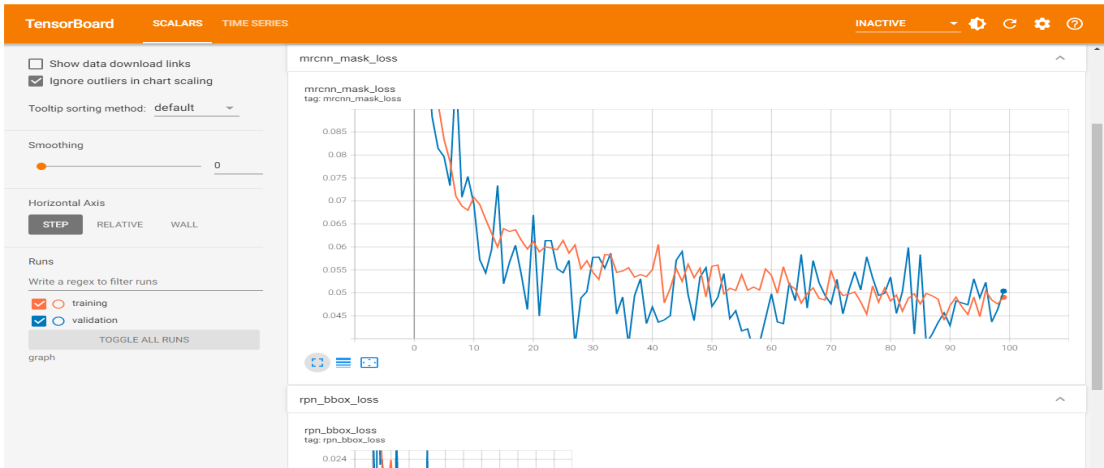
(c) Mask loss during training (orange line) and validation (blue line)
Figure 4. Graph of loss during training and validation.
3.3. Performance Evaluation
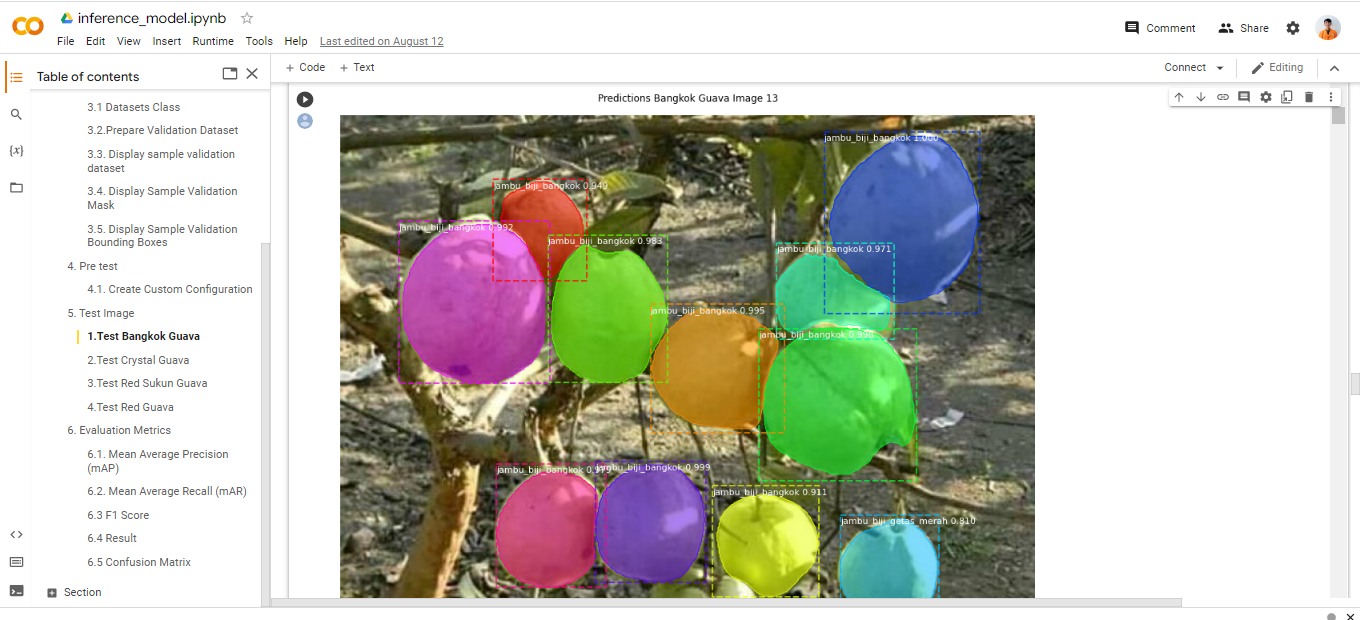
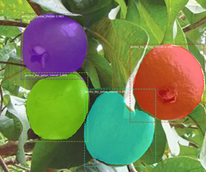
The performance evaluation is conducted by testing the trained model to detect and segment Bangkok guava, red breadfruit guava, crystal guava, and red brittle guava on 200 images with 50 images for each type of guava. The test data mainly consists of guava captured in the wild or still hanging on the tree. Table 2 shows the classification, detection, and segmentation result from test data.
Table 2. The classification, detection, and segmentation result
Guava Type | Input Image | Result |
Bangkok Guava | 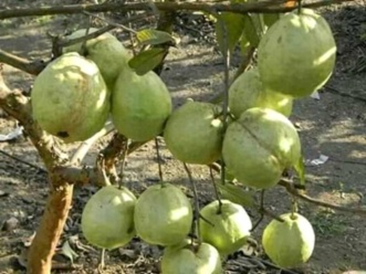
| 
|
Crystal Guava | 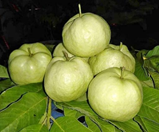
| 
|
Red Breadfruit Guava | 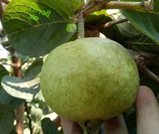
| 
|
Red Brittle Guava | 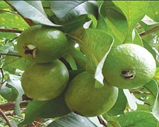
| 
|
A confusion matrix is usually used to measure accuracy based only on true positive, false positive, true negative, and false negative. However when it comes to detection or segmentation, these metrics are not representative, and even in classification, accuracy is not always the metric that will yield the best model. In this research, mean average precision (mAP), mean average recall (mAR), and F1-score is used to measure the performance of the proposed method. Average precision (AP) is the most frequently used metric in object detection tasks. The easiest way to calculate AP is to calculate the AUC (Area under Curve) of the Precision-Recall curve. In practice, AP is the average precision across all recall values between 0 and 1. For multi-object detection tasks, AP will be averaged to produce a final value called Mean Average Precision (mAP). Similar to AP, average recall (AR) is also a numerical metric that can be used to compare the performance of detection tasks. For multi-object detection, mean average recall (mAR) is used by averaging the AR of k-classes. From the experiment results, the model gets an mAP score of 0.90, an mAR score of 0.88, and an F1 score of 0.89. Thus, it can be concluded that the proposed method performs well in guava fruit detection, classification, and segmentation.
- CONCLUSIONS
The method used in this research is the Mask Region-Based Convolutional Neural Network (Mask R-CNN) which can be used for object detection and segmentation. The objects used in this study were 4 types of popular guava fruit in Indonesia namely Bangkok guava, crystal guava, red breadfruit guava, and brittle red guava. The dataset is guava fruit images that are divided into 616 training data, 264 validation data, and 200 test data. After configuring the hyperparameter and training the Mask R-CNN model, the performance evaluation on test data shows a mean Average Precision score of 0.90, a mean Average Recall score of 0.88, and an F1 Score of 0.89. It can be concluded that the proposed method is capable of detecting, classifying, and segmenting 4 types of guava quite well. The failure of object detection in the test data is caused by several factors such as poor photo quality, light intensity, and also the distance of the camera which causes the object to become small so that it cannot be recognized by the system. For future works, the proposed method will be trained for more classes of guava and add the quality category to the classification branch.
REFERENCES
[1] R. Upadhyay, J. F. P. Dass, A. K. Chauhan, P. Yadav, M. Singh, and R. B. Singh, “Chapter 21 - Guava Enriched Functional Foods: Therapeutic Potentials and Technological Challenges,” in The Role of Functional Food Security in Global Health, R. B. Singh, R. R. Watson, and T. Takahashi, Eds. Academic Press, pp. 365–378, 2019, https://doi.org/10.1016/B978-0-12-813148-0.00021-9.
[2] Y. Suwanwong and S. Boonpangrak, “Phytochemical contents, antioxidant activity, and anticancer activity of three common guava cultivars in Thailand,” Eur. J. Integr. Med., vol. 42, p. 101290, 2021, https://doi.org/10.1016/j.eujim.2021.101290.
[3] A. Prabhu, A. K. K, A. Abhiram, and B. R. Pushpa, “Mango Fruit Classification using Computer Vision System,” in 2022 4th International Conference on Inventive Research in Computing Applications (ICIRCA), pp. 1797–1802, 2022, https://doi.org/10.1109/ICIRCA54612.2022.9985773.
[4] H. Altaheri, M. Alsulaiman, and G. Muhammad, “Date Fruit Classification for Robotic Harvesting in a Natural Environment Using Deep Learning,” IEEE Access, vol. 7, pp. 117115–117133, 2019, https://doi.org/10.1109/ACCESS.2019.2936536.
[5] Y. Zhang and L. Wu, “Classification of Fruits Using Computer Vision and a Multiclass Support Vector Machine,” Sensors, vol. 12, no. 9, pp. 12489–12505, 2012, https://doi.org/10.3390/s120912489.
[6] J. L. Rojas-Aranda, J. I. Nunez-Varela, J. C. Cuevas-Tello, and G. Rangel-Ramirez, “Fruit Classification for Retail Stores Using Deep Learning,” in Pattern Recognition, pp. 3–13, 2020, https://doi.org/10.1007/978-3-030-49076-8_1.
[7] F. Femling, A. Olsson, and F. Alonso-Fernandez, “Fruit and Vegetable Identification Using Machine Learning for Retail Applications,” in 2018 14th International Conference on Signal-Image Technology & Internet-Based Systems (SITIS), pp. 9–15, 2018, https://doi.org/10.1109/SITIS.2018.00013.
[8] M. S. Hossain, M. Al-Hammadi, and G. Muhammad, “Automatic Fruit Classification Using Deep Learning for Industrial Applications,” IEEE Trans. Ind. Informatics, vol. 15, no. 2, pp. 1027–1034, 2019, https://doi.org/10.1109/TII.2018.2875149.
[9] R. Katarzyna and M. Paweł, “A Vision-Based Method Utilizing Deep Convolutional Neural Networks for Fruit Variety Classification in Uncertainty Conditions of Retail Sales,” Appl. Sci., vol. 9, no. 19, 2019, https://doi.org/10.3390/app9193971.
[10] Y. Yu, K. Zhang, L. Yang, and D. Zhang, “Fruit detection for strawberry harvesting robot in non-structural environment based on Mask-RCNN,” Comput. Electron. Agric., vol. 163, no. February, p. 104846, 2019, https://doi.org/10.1016/j.compag.2019.06.001.
[11] P. Ganesh, K. Volle, T. F. Burks, and S. S. Mehta, “Deep Orange: Mask R-CNN based Orange Detection and Segmentation,” IFAC-PapersOnLine, vol. 52, no. 30, pp. 70–75, 2019, https://doi.org/10.1016/j.ifacol.2019.12.499.
[12] S. Bargoti and J. Underwood, “Deep fruit detection in orchards,” in 2017 IEEE International Conference on Robotics and Automation (ICRA), pp. 3626–3633, 2017, https://doi.org/10.1109/ICRA.2017.7989417.
[13] A. Koirala, K. B. Walsh, Z. Wang, and C. McCarthy, “Deep learning for real-time fruit detection and orchard fruit load estimation: benchmarking of ‘MangoYOLO,’” Precis. Agric., vol. 20, no. 6, pp. 1107–1135, 2019, https://doi.org/10.1007/s11119-019-09642-0.
[14] I. Sa, Z. Ge, F. Dayoub, B. Upcroft, T. Perez, and C. McCool, “DeepFruits: A Fruit Detection System Using Deep Neural Networks,” Sensors, vol. 16, no. 8, 2016, https://doi.org/10.3390/s16081222.
[15] K. Hameed, D. Chai, and A. Rassau, “A comprehensive review of fruit and vegetable classification techniques,” Image Vis. Comput., vol. 80, pp. 24–44, 2018, https://doi.org/10.1016/j.imavis.2018.09.016.
[16] S. K. Behera, A. K. Rath, A. Mahapatra, and P. K. Sethy, “Identification, classification & grading of fruits using machine learning & computer intelligence: a review,” J. Ambient Intell. Humaniz. Comput., 2020, https://doi.org/10.1007/s12652-020-01865-8.
[17] K. He, G. Gkioxari, P. Dollar, R. Girshick, P. Dollár, and R. Girshick, “Mask R-CNN,” in Proceedings of the IEEE International Conference on Computer Vision (ICCV), vol. 42, no. 2, pp. 386–397, 2017, https://doi.org/10.1109/TPAMI.2018.2844175.
[18] R. Girshick, J. Donahue, T. Darrell, and J. Malik, “Rich Feature Hierarchies for Accurate Object Detection and Semantic Segmentation,” Proc. 2014 IEEE Conf. Comput. Vis. Pattern Recognit., pp. 580–587, 2014, https://doi.org/10.1109/CVPR.2014.81.
[19] X. Zou, “A Review of Object Detection Techniques,” in 2019 International Conference on Smart Grid and Electrical Automation (ICSGEA), pp. 251–254, 2019, https://doi.org/10.1109/ICSGEA.2019.00065.
[20] F. Sultana, A. Sufian, and P. Dutta, “A Review of Object Detection Models Based on Convolutional Neural Network,” in Intelligent Computing: Image Processing Based Applications, J. K. Mandal and S. Banerjee, Eds. Singapore: Springer Singapore, pp. 1–16, 2020, https://doi.org/10.1007/978-981-15-4288-6_1.
[21] J. Deng, X. Xuan, W. Wang, Z. Li, H. Yao, and Z. Wang, “A review of research on object detection based on deep learning,” J. Phys. Conf. Ser., vol. 1684, no. 1, p. 12028, 2020, https://doi.org/10.1088/1742-6596/1684/1/012028.
[22] R. Girshick, “Fast R-CNN,” in Proceedings of the IEEE International Conference on Computer Vision (ICCV), pp. 1440–1448, 2015, https://doi.org/10.1109/ICCV.2015.169.
[23] S. Ren, K. He, R. Girshick, and J. Sun, “Faster R-CNN: Towards Real-Time Object Detection with Region Proposal Networks,” in Advances in Neural Information Processing Systems, vol. 28, 2015, https://proceedings.neurips.cc/paper/2015/hash/14bfa6bb14875e45bba028a21ed38046-Abstract.html.
[24] K. He, X. Zhang, S. Ren, and J. Sun, “Deep residual learning for image recognition,” in Proceedings of the IEEE conference on computer vision and pattern recognition, pp. 770–778, 2016, https://doi.org/10.1109/CVPR.2016.90.
[25] K. Simonyan and A. Zisserman, “Very Deep Convolutional Networks for Large-Scale Image Recognition,” in 3rd International Conference on Learning Representations, {ICLR} 2015, San Diego, CA, USA, May 7-9, 2015, Conference Track Proceedings, Sep. 2015. 2019, https://doi.org/10.48550/arXiv.1409.1556.
[26] A. Gholamy, V. Kreinovich, and O. Kosheleva, “Why 70/30 or 80/20 Relation Between Training and Testing Sets : A Pedagogical Explanation,” Dep. Tech. Reports, pp. 1–6, 2018, https://scholarworks.utep.edu/cs_techrep/1209/.
AUTHOR BIOGRAPHY

| Bayu Alif Farisqi, S.Kom the author received a bachelor's degree from the Informatics department of Universitas Ahmad Dahlan in 2022.
|
|
|

| Adhi Prahara, M.Cs the author received a bachelor's degree from the Electronics and Instrumentation department of Universitas Gadjah Mada and a master's degree from the Computer Science department of Universitas Gadjah Mada. The author's research interest is computer vision, image processing, and computer graphics. Currently, the author works as a lecturer at Universitas Ahmad Dahlan.
|
Guava Fruit Detection and Classification Using Mask Region-Based Convolutional Neural Network (Bayu Alif Farisqi)