Buletin Ilmiah Sarjana Teknik Elektro ISSN: 2685-9572
Automatic Dam Gate Monitoring System with Outseal Mega V2 PLC and Haiwell HMI
Ahmad Nur Rofix, Alfian Ma’arif
Department of Electrical Engineering, Universitas Ahmad Dahlan, Yogyakarta, Indonesia
ARTICLE INFORMATION |
| ABSTRACT |
Article History: Submitted 28 October 2022 Revised 15 December 2022 Accepted 17 January 2023
|
| 
Dam is a building used by humans as a regulator of water discharge in a river. In the tropics the big role of dams occurs throughout the year. The active role of dams in life is to store water reserves in the summer, as well as reduce the risk of flooding that occurs during the rainy season. This research discusses the process of monitoring a dam using the Outseal Mega V2 PLC as a control device for the entire system supported by an analog module as an analog value reading device (ADC). The ADC value will be obtained through the output voltage from the potentiometer which is used instead of the water level sensor. The ADC value will then be processed by the PLC to make a decision. This research is supported by an HMI interface using Haiwell Cloud Scada Develop software so that machine-human communication can be carried out and real-time monitoring is achieved.
|
Keywords: Dam; HMI; Dam Monitoring; PLC Outseal
|
Corresponding Author: Alfian Ma’arif, Department of Electrical Engineering, Universitas Ahmad Dahlan, Yogyakarta, Indonesia. Email: alfianmaarif@ee.uad.ac.id
|
This work is licensed under a Creative Commons Attribution-Share Alike 4.0 
|
Document Citation: A. N. Rofix and A. Ma’arif, “Automatic Dam Gate Monitoring System with Outseal Mega V2 PLC and Haiwell HMI,” Buletin Ilmiah Sarjana Teknik Elektro, vol. 4, no. 3, pp. 152-160, 2022, DOI: 10.12928/biste.v4i3.7360. |
- INTRODUCTION
Indonesia is a country with a tropical climate. The physiographical conditions of Indonesia's territory, such as latitude, altitude, wind patterns (trade winds and monsoon winds) make Indonesia one of the countries with moderate to high rainfall at the peak of the rainy season.
As a developing country with a population of 267 million people, Indonesia has many big cities which often flood [1] when the rainy season comes. From the data presented by CCN Indonesia, in 2016 it was recorded that 2,342 areas in Indonesia experienced flooding. This number increased by 35% when compared to the number of flood disasters in 2015 with the most flood locations, namely in urban areas and downstream rivers [2].
Many countries use dams or dams as a regulator of water [3] discharge so that during the rainy season the volume of water can be controlled to reduce the risk of flooding [4]. Dams or dams are a construction to hold back the flow of water so that there is no excess volume of water distribution to tributaries [5]. The way the dam works is to collect water from various sources/rivers in a place resembling a large tub with doors on several sides [6]. The door which will later be used to regulate the amount of water that will be distributed to the small rivers below. More utilization of dams can be used as hydropower, recreational facilities, and ponds [7].
In Indonesia itself, dams have been used as a regulator of water discharge and water reserve facilities for irrigating rice fields. However, there are still many dams that operate manually, namely the control of the dam door still depends on human power so that the monitoring system on the dam cannot be 24 hours so that when there is heavy rain there can be an excess of water volume resulting in flooding [8]. From the problems above, we need a tool that can be used to measure the water level and open the dam's sluice gate gradually so that excessive water discharge does not occur so that flooding can occur. The control system used in the tool is the Programmable Logic Controller (PLC) [9] and the Human Machine Interface (HMI) [10] as the controller and visual monitoring of the water level in the dam.
- METHODS
This research took place at Universitas Ahmad Dahlan, Yogyakarta. This research is based on several problems, especially controlling the yield of rainwater in dams. With proficiency in electrical engineering studies, this research was carried out using the Outseal PLC [11] as a tool resulting from the development of industrial automation technology [12]. Using the analogy of dams with different structures in one river flow path.
In this study, the system workflow created was when the device was turned on, the sensor would read the value of the water level. After the sensor reads the water level, it will then be calculated by the PLC. When the PLC calculates that the water value exceeds the specified limit, the PLC will make the decision to turn on the electric motor to open the dam door [13]. With the working method that has been described, a system flowchart can be made as shown in Figure 1.
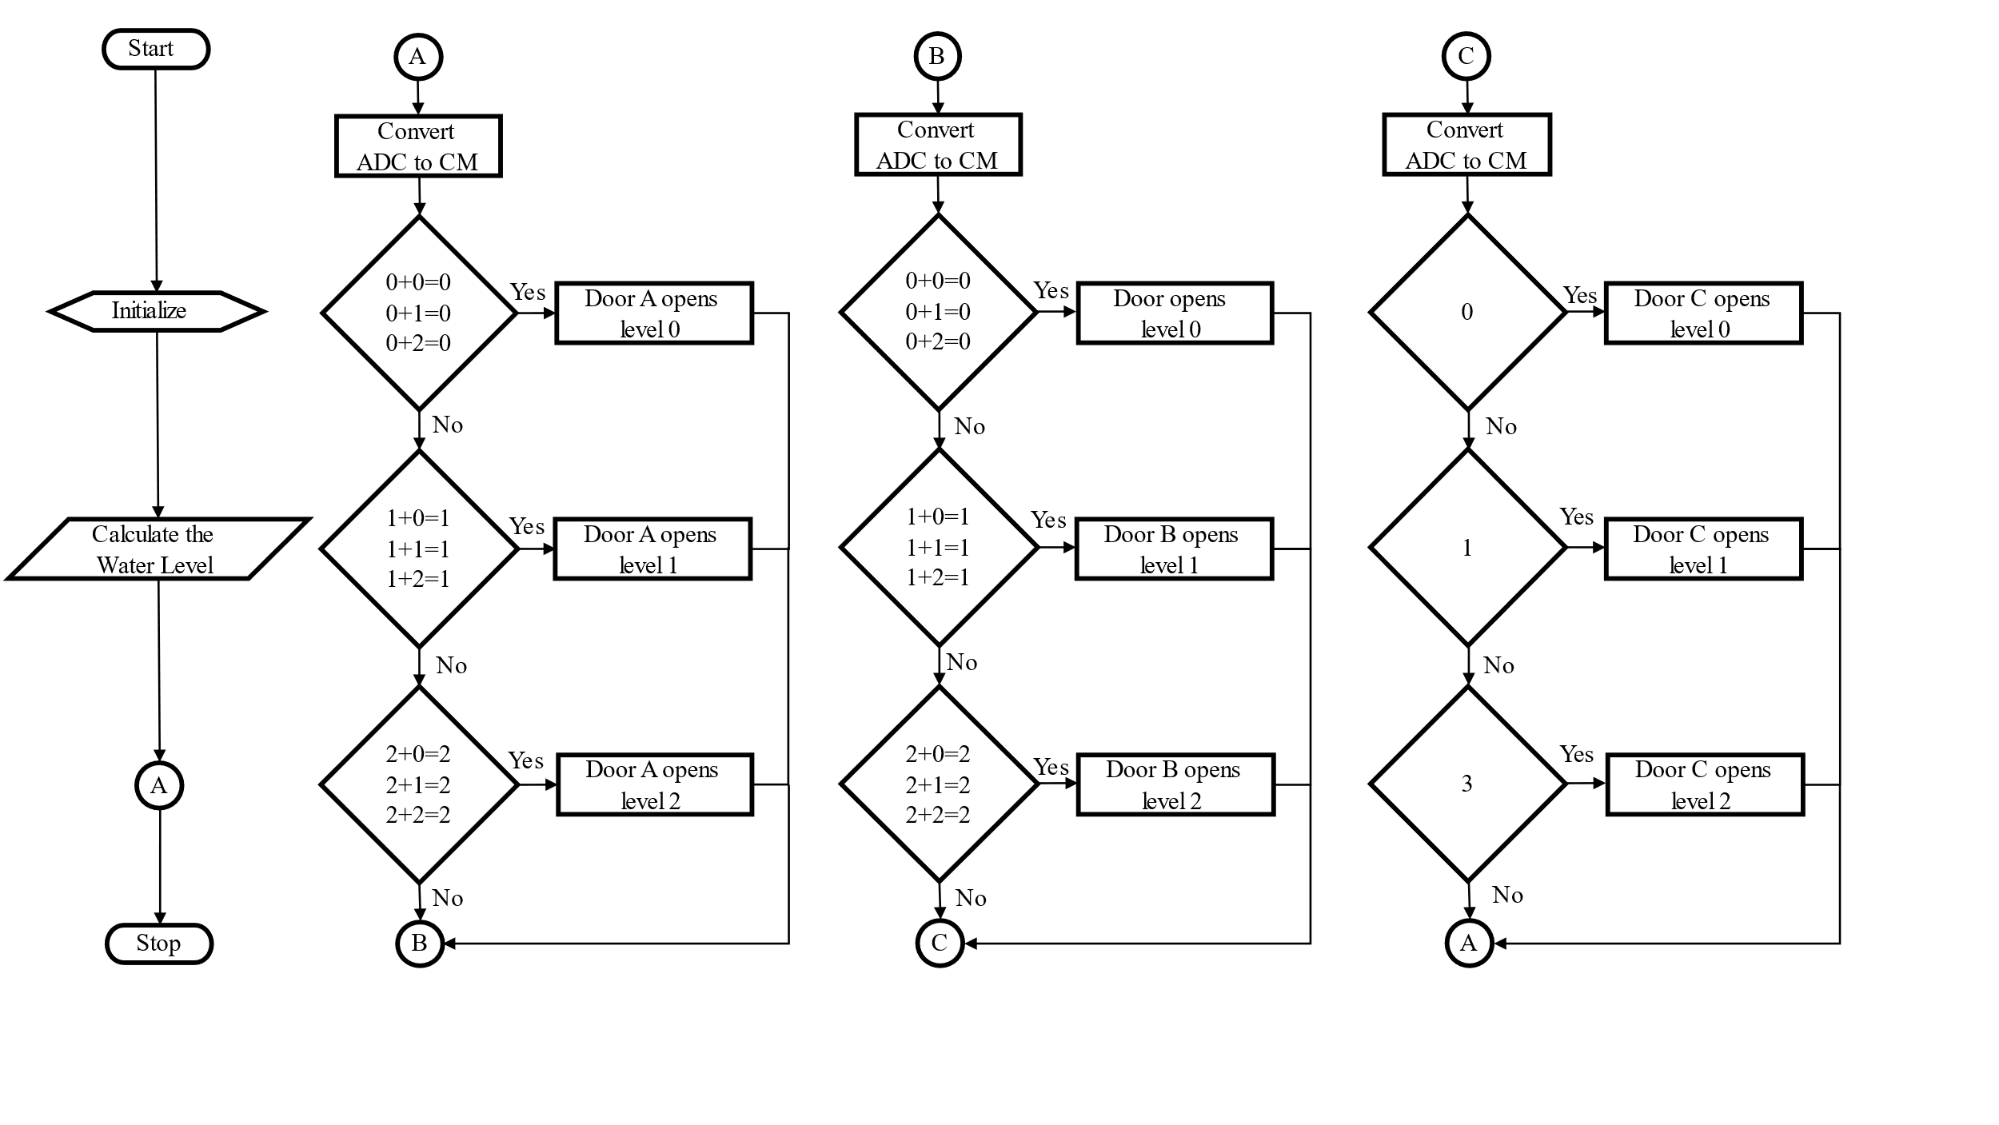
Figure 1. System Flowchart
With the flowchart that has been made, it can be described briefly in the form of a block diagram. For a block diagram arranged like Figure 2.
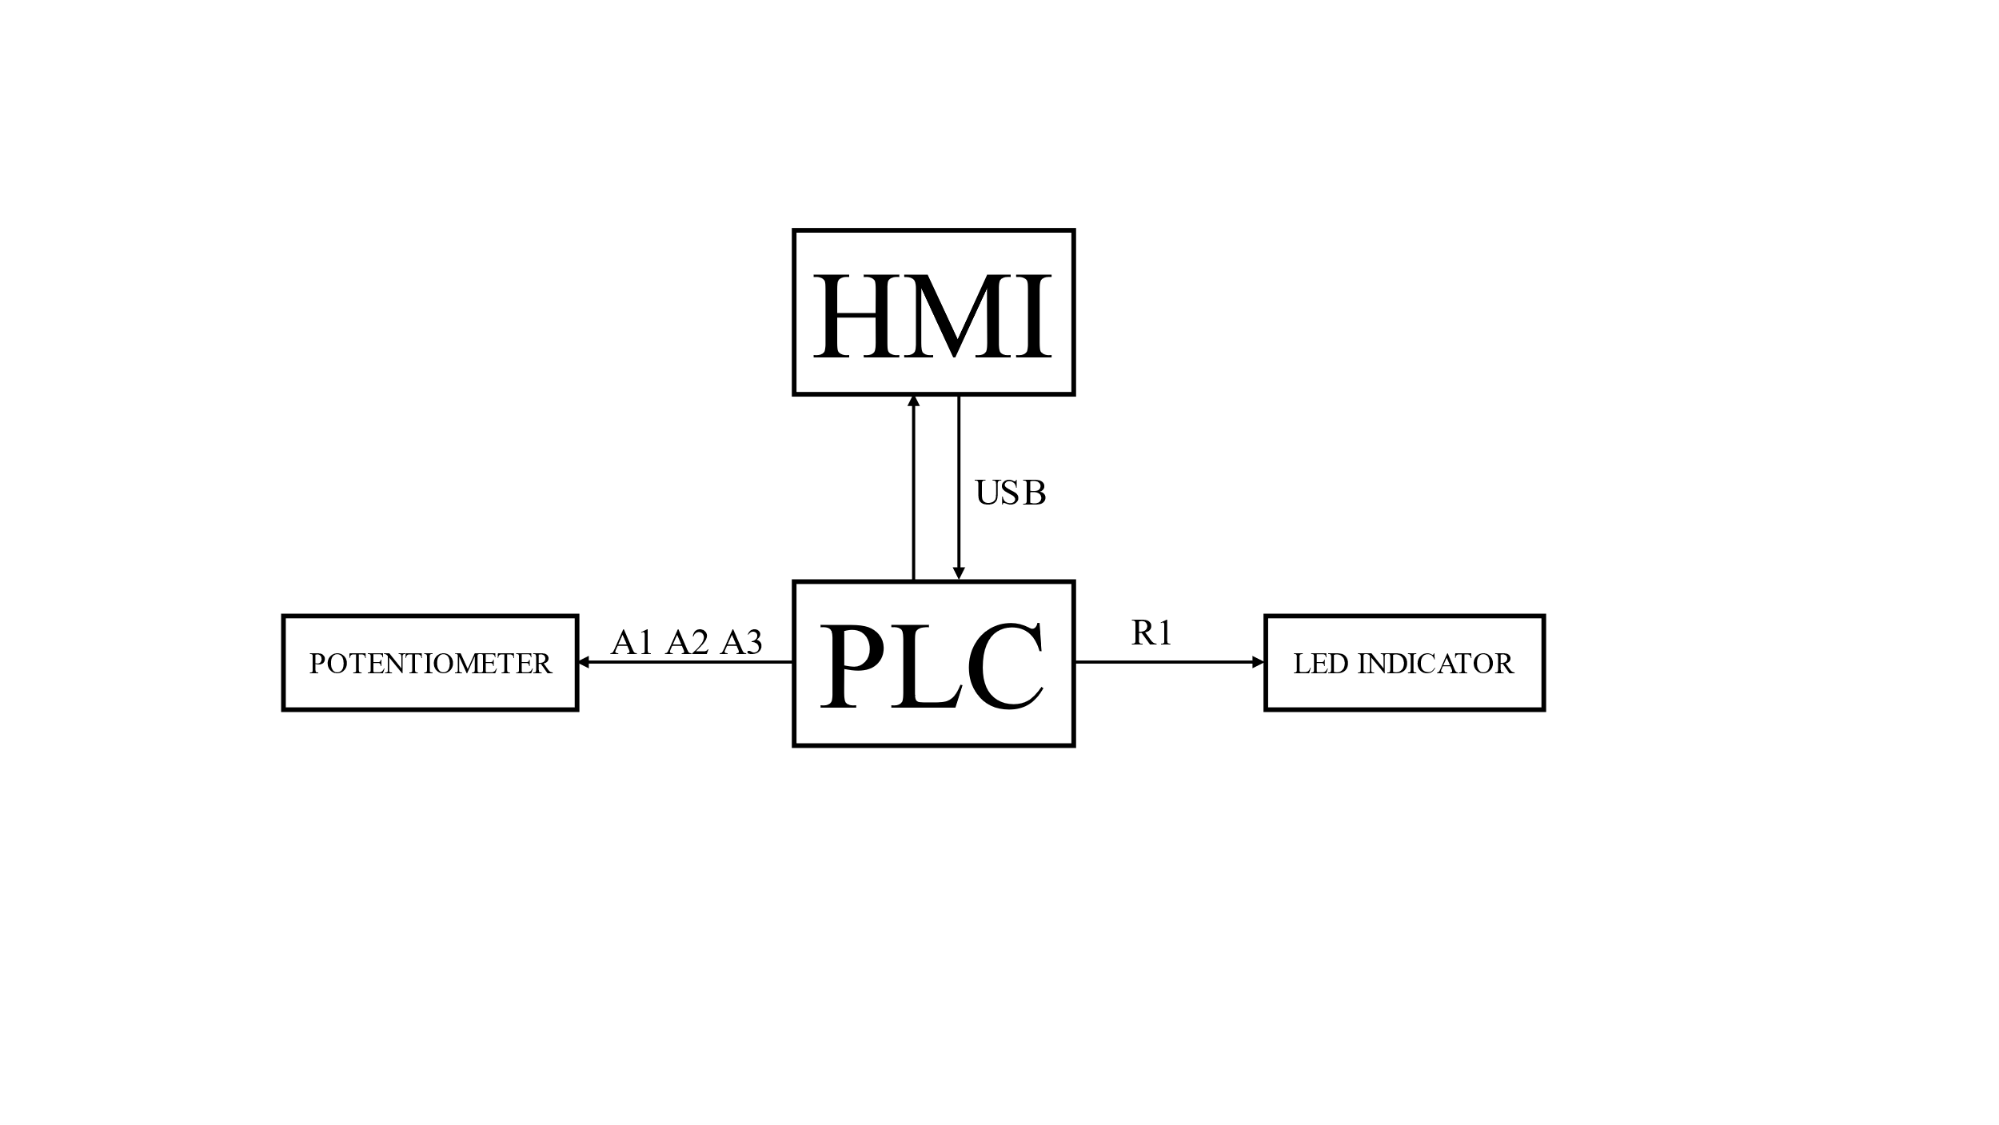
Figure 2. System block diagram
With reference to the flowcharts and block diagrams that have been prepared, it can be concluded that the workflow of the system built in this study can be seen in Figure 3.
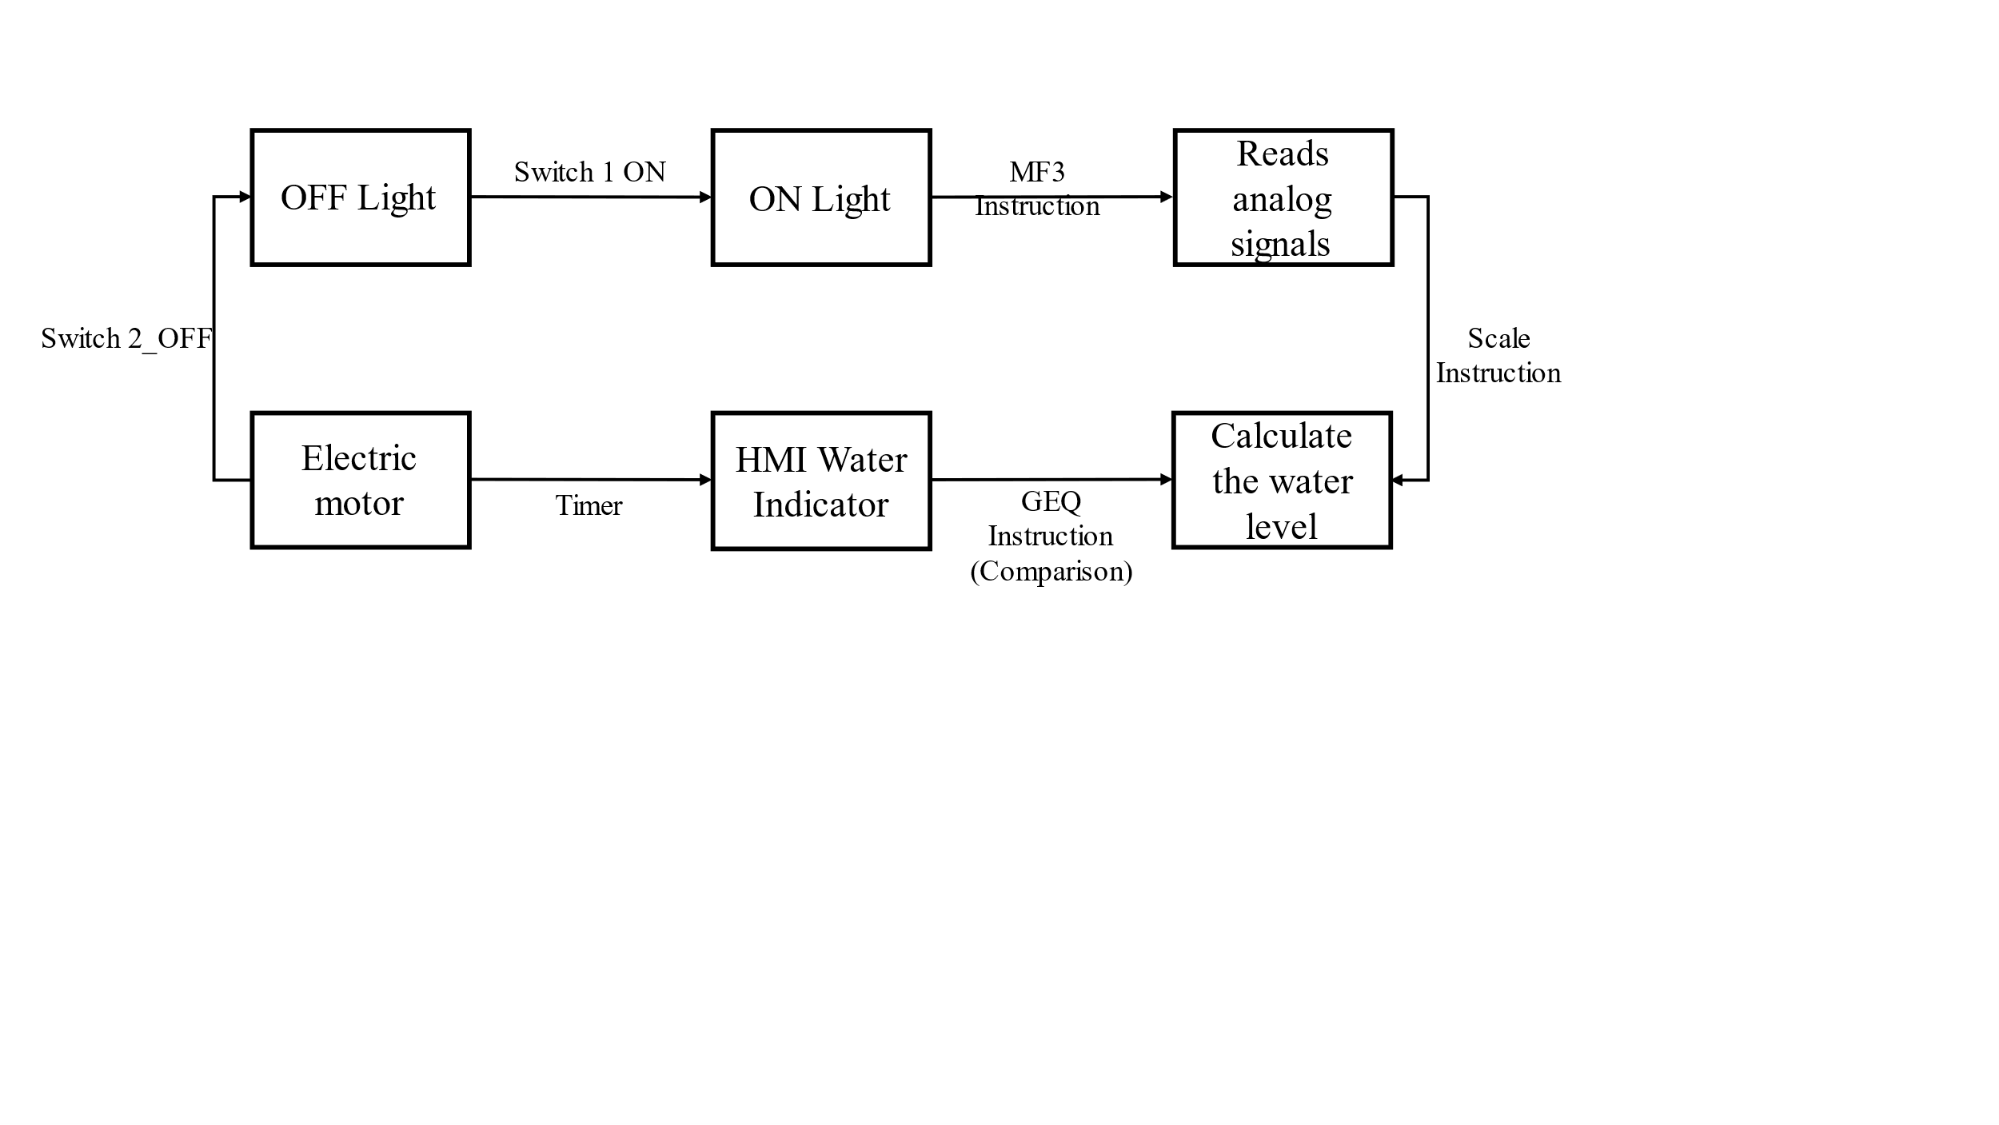
Figure 3. State Diagram
In this study the materials used included PLC Outseal, LED lights, potentiometers, and two buttons for start and stop. The wiring of all materials used can be seen in Figure 4.
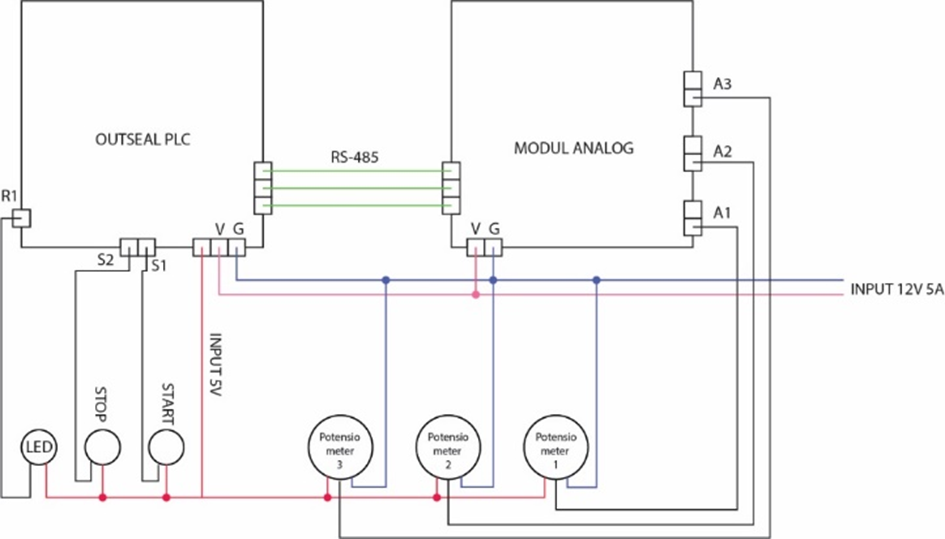
Figure 4. Wiring Diagram
- RESULT AND DISCUSSION
After conducting research, the results obtained from various tests were obtained. The first stage is system testing. System testing aims to find out by simulation whether the system is running as expected or not. In system testing, things that were observed included Outseal PLC connections with analog modules with MF3 functions, scale functions, timer functions, GEQ or comparison functions and HMI [14]. The results of system testing can be seen in Figure 5, Figure 6, Figure 7, Figure 8, and Figure 9.

Figure 5. MF3 function
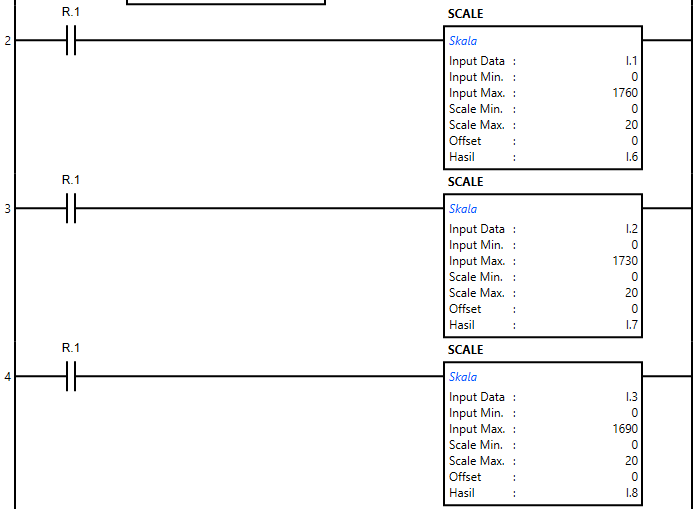
Figure 6. Scale Function
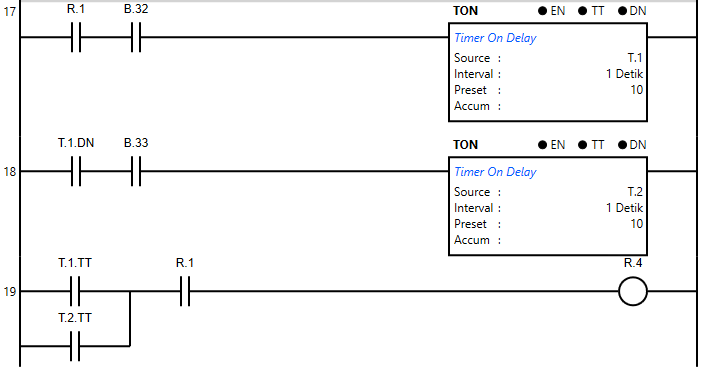
Figure 7. Timer function
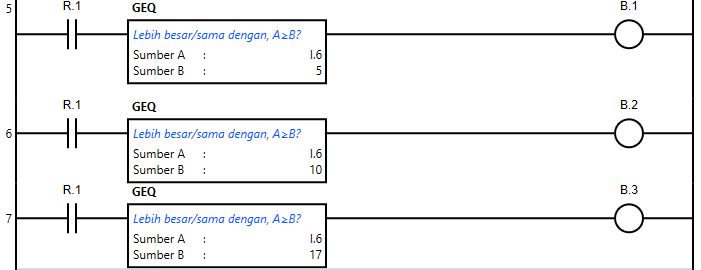
Figure 8. GEQ function or comparison
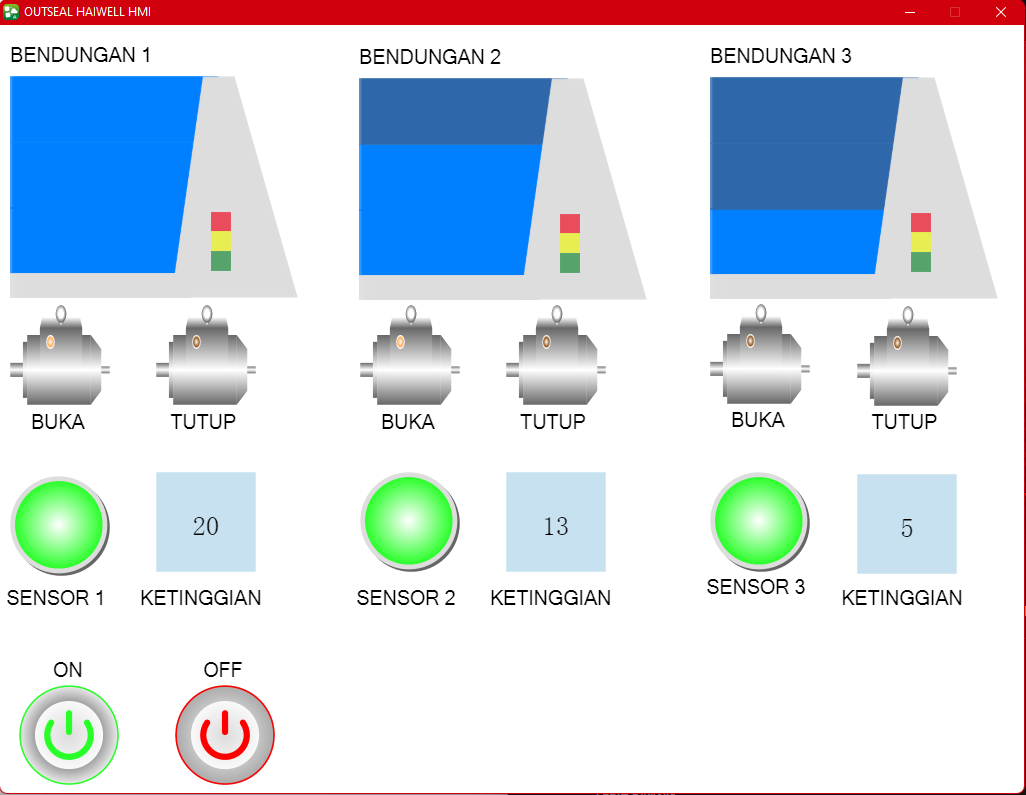
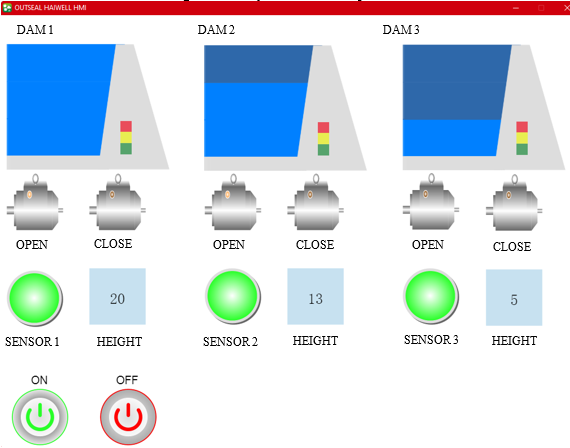
Figure 9. HMI System
The next test is to measure the value of the input voltage and the value of the voltage on the potentiometer. This measurement is carried out using a multimeter as a supporting device [15]. The results of the measurements can be seen in Table 1.
Table 1. System voltage testing
| Input Voltage(V) | ADC input Voltage (V) | ADC Voltage (V) |
Input | 4.6 |
|
|
Potentio minimum value 1 | 0 | 0 | 0 |
Potentio maximum value 1 | 4.59 | 1.45 | 1760 |
Potentio minimum value 2 | 0 | 0 | 0 |
Potentio maximum value 2 | 4.56 | 1.43 | 1737 |
Potentio minimum value 3 | 0 | 0 | 0 |
Potentio maximum value 3 | 4.46 | 1.4 | 1696 |
After testing the voltage on the tool, then taking data samples on each potential [16]. Sampling as much as 10 times the sample with a height of 2 meters. In taking the sample data [17] [18], the measurement values obtained from the PLC analog data are shown in Table 2, Table 3, and Table 4.
Table 2. Potentio sample 1
No. | Height | ADC Value (decimal) | Rated Voltage (V) |
1 | 2 | 190 | 0.19 |
2 | 4 | 416 | 0.37 |
3 | 6 | 590 | 0.51 |
4 | 8 | 789 | 0.67 |
5 | 10 | 892 | 0.75 |
6 | 12 | 1140 | 0.95 |
7 | 14 | 1225 | 1.04 |
8 | 16 | 1446 | 1.2 |
9 | 18 | 1647 | 1.36 |
10 | 20 | 1761 | 1.45 |
Table 3. Potentio sample 2
No. | Height | ADC Value (decimal) | Rated Voltage (V) |
1 | 2 | 195 | 0.2 |
2 | 4 | 412 | 0.37 |
3 | 6 | 555 | 0.48 |
4 | 8 | 774 | 0.64 |
5 | 10 | 941 | 0.79 |
6 | 12 | 1071 | 0.9 |
7 | 14 | 1241 | 1.03 |
8 | 16 | 1393 | 1.15 |
9 | 18 | 1577 | 1.3 |
10 | 20 | 1732 | 1.43 |
Table 4. Potentio sample 3
No. | Height | ADC Value (decimal) | Rated Voltage (V) |
1 | 2 | 192 | 0.19 |
2 | 4 | 388 | 0.35 |
3 | 6 | 531 | 0.46 |
4 | 8 | 703 | 0.6 |
5 | 10 | 912 | 0.77 |
6 | 12 | 1054 | 0.88 |
7 | 14 | 1200 | 1 |
8 | 16 | 1389 | 1.15 |
9 | 18 | 1563 | 1.29 |
10 | 20 | 1698 | 1.4 |
The next test is the calculation of the readable ADC value. To calculate the readable ADC value, use Equation (1).
| 
| (1) |
Explanation:
 is the rated input voltage,
  is the calculated digital value,
  is input voltage reference, and
  is the maximum digital value.
With Equation (1), the calculation results are obtained which can be seen in Table 5, Table 6 and Table 7.
Table 5. Potential Calculation Results 1
No. | Height | Rated Voltage(V) | Rated ADC Value |
1 | 2 | 0.19 | 235.7727 |
2 | 4 | 0.37 | 459.1364 |
3 | 6 | 0.51 | 632.8636 |
4 | 8 | 0.67 | 831.4091 |
5 | 10 | 0.75 | 930.6818 |
6 | 12 | 0.95 | 1178.864 |
7 | 14 | 104 | 1290.545 |
8 | 16 | 1.2 | 1489.091 |
9 | 18 | 1.36 | 1687.636 |
10 | 20 | 1.45 | 1799.318 |
Table 6. Potential Calculation Results 2
No. | Height | Rated Voltage(V) | Rated ADC Value |
1 | 2 | 0.2 | 248.1818 |
2 | 4 | 0.37 | 459.1364 |
3 | 6 | 0.48 | 595.6364 |
4 | 8 | 0.64 | 794.1818 |
5 | 10 | 0.79 | 980.3182 |
6 | 12 | 0.9 | 1116.818 |
7 | 14 | 1.03 | 1278.136 |
8 | 16 | 1.15 | 1427.045 |
9 | 18 | 1.3 | 1613.182 |
10 | 20 | 1.43 | 1774.5 |
Table 7. Potential Calculation Results 3
No. | Height | Rated Voltage(V) | Rated ADC Value |
1 | 2 | 0.19 | 235.7727 |
2 | 4 | 0.35 | 434.3182 |
3 | 6 | 0.46 | 570.8182 |
4 | 8 | 0.6 | 744.5455 |
5 | 10 | 0.77 | 955.5 |
6 | 12 | 0.88 | 1092 |
7 | 14 | 1 | 1240.909 |
8 | 16 | 1.15 | 1427.045 |
9 | 18 | 1.29 | 1600.773 |
10 | 20 | 1.4 | 1737.273 |
The final test is accuracy testing. Accuracy testing aims to determine the accurate level of ADC readings by measuring using a multimeter measuring instrument. In this accuracy test, equations and calculations of the values measured on the PLC [19] [20] are used using the voltage value as a reference for measuring analog data. Calculation of accuracy using Equation (2).
| 
| (2) |
With the values obtained from formula (2), the final comparison results are obtained in Table 8, Table 9, and Table 10.
Table 8. Potential comparison results 1
No. | Height | ADC reading | Measurement | Accuracy (%) |
1 | 2 | 190 | 235 | 75.9 |
2 | 4 | 416 | 459 | 89.6 |
3 | 6 | 590 | 632 | 92.7 |
4 | 8 | 789 | 831 | 64.6 |
5 | 10 | 892 | 930 | 95.6 |
6 | 12 | 1140 | 1178 | 96.5 |
7 | 14 | 1225 | 1290 | 94.6 |
8 | 16 | 1446 | 1489 | 97 |
9 | 18 | 1647 | 1687 | 97.5 |
10 | 20 | 1761 | 1779 | 97.8 |
Table 9. Potential comparison results 2
No. | Height | ADC reading | Measurement | Accuracy (%) |
1 | 2 | 190 | 248 | 72.7 |
2 | 4 | 416 | 459 | 88.5 |
3 | 6 | 590 | 595 | 92.6 |
4 | 8 | 789 | 794 | 97.4 |
5 | 10 | 892 | 980 | 95.8 |
6 | 12 | 1140 | 1116 | 95.7 |
7 | 14 | 122 | 1278 | 97 |
8 | 16 | 1446 | 1427 | 97.5 |
9 | 18 | 1647 | 1613 | 97.7 |
10 | 20 | 1761 | 1774 | 97.5 |
Table 10. Potential comparison results 3
No. | Height | ADC reading | Measurement | Accuracy (%) |
1 | 2 | 190 | 235 | 77,2 |
2 | 4 | 416 | 434 | 88 |
3 | 6 | 590 | 570 | 92,5 |
4 | 8 | 789 | 744 | 94 |
5 | 10 | 892 | 955 | 95,2 |
6 | 12 | 1140 | 1092 | 96,3 |
7 | 14 | 1225 | 1240 | 96,5 |
8 | 16 | 1446 | 1427 | 97,2 |
9 | 18 | 1647 | 1600 | 97,5 |
10 | 20 | 1761 | 1737 | 97,6 |
To find out the average accuracy of each potentiometer, Equation (3) is used.
| 
| (3) |
The results of calculating the average accuracy on each potentiometer can be seen in Table 11.
Table 11. Accuracy of Each Potentiometer
No. | Each Potentiometer | Accuracy |
1 | Potentiometer 1 | 93.21% |
2 | Potentiometer 2 | 93.27% |
3 | Potentiometer 3 | 93.26% |
- CONCLUSIONS
From a series of stages in this study, it can be concluded that; Each potentiometer has a different minimum resistance value. The input voltage value and the output voltage value on the potentiometer have a difference of ± 1%. The smallest ADC accuracy value is 72% and the highest accuracy value is 97%. At a rated voltage of 0.7 Volt -1.4 Volt has an accuracy value exceeding 90%. The average value of ADC reading accuracy by measurement is 93%.
ACKNOWLEDGEMENT
First of all, the writer would like to thank God Almighty for His mercy, grace, and blessing, so that the writer can finish this research. Next, the authors would like to thank all parties, both parents, lecturers, supervisors, and friends who have helped and provided support and enthusiasm so that this research can be completed. Finally, the writer realizes that nothing is perfect, the writer still makes mistakes in the preparation of this thesis. Therefore the author apologizes profusely for the mistakes made by the author.
REFERENCES
- Y. Saragih, J. H. Prima Silaban, H. Aliya Roostiani, and S. A. Elisabet, “Design of Automatic Water Flood Control and Monitoring Systems in Reservoirs Based on Internet of Things (IoT),” 2020 3rd International Conference on Mechanical, Electronics, Computer, and Industrial Technology (MECnIT), 2020, pp. 30-35, https://doi.org/10.1109/MECnIT48290.2020.9166593.
- S. Felder, B. Hohermuth, and R. M. Boes, “High-velocity air-water flows downstream of sluice gates including selection of optimum phase-detection probe,” International Journal of Multiphase Flow, vol. 116, pp. 203-220, 2019, https://doi.org/10.1016/j.ijmultiphaseflow.2019.04.015.
- W. Tu, S. Fang, and Z. Sun, “Experimental study and flow analysis on a new design of water-retaining sluice gate,” Water Practice and Technology, vol. 15, no. 2, pp. 311–320, 2020, https://doi.org/10.2166/wpt.2020.016
- G. Sasikala, S. Srinivasan, J. Navarajan, and M. M. Theresa, “IoT based Water Level Monitoring and Management in Reservoir,” 2022 3rd International Conference on Electronics and Sustainable Communication Systems (ICESC), Coimbatore, 2022, pp. 1763-1767, https://doi.org/10.1109/ICESC54411.2022.9885714.
- H. Wang, et al., “Prototype air–water flow measurements in D-type hydraulic jumps,” Journal of Hydraulic Research, pp. 1-17, 2022, https://doi.org/10.1080/00221686.2022.2132310.
- Y. Xu, Z. L. gui, C. Gong, Z. Guan, and B. Ma, “Analysis and research on sluice gate flow of a hydropower station under different working conditions,” IOP Conference Series: Earth and Environmental Science, vol. 1037, no. 1, p. 012059, 2022, https://doi.org/10.1088/1755-1315/1037/1/012059.
- S. R. Utama, A. Firdausi, and G. P. Hakim, “Control and Monitoring Automatic Floodgate based on NodeMCU and IOT with Fuzzy Logic Testing,” Journal of Robotics and Control (JRC), vol. 3, no. 1, pp. 14-17, 2022, https://doi.org/10.18196/jrc.v3i1.11199.
- J. Lian, L. Chen, C. Liang, and F. Liu, “Presentation and Verification of an Optimal Operating Scheme Aiming at Reducing the Ground Vibration Induced by High Dam Flood Discharge,” International Journal of Environmental Research and Public Health, vol. 17, no. 1, pp. 377, 2020 https://doi.org/10.3390/ijerph17010377
- D. U. Suwarno, “Modbus HMI bluetooth for outseal PLC,” AIP Conference Proceedings, vol. 2217, no. 1, p. 030124, 2020, https://doi.org/10.1063/5.0000583.
- F. Rossi, J. P. Sembiring, A. Jayadi, N. U. Putri, and P. Nugroho, “Implementation of Fuzzy Logic in PLC for Three- Story Elevator Control System,” 2021 International Conference on Computer Science, Information Technology, and Electrical Engineering (ICOMITEE), 2021, pp. 179-185, https://doi.org/10.1109/ICOMITEE53461.2021.9650221.
- K. Kurniawan, A. H. Budiman, F. Hermawan, and A. Rahmawan, “Design of Control and Human Machine Interface (HMI) for Proton Exchange Membrane Fuel Cell,” IJE, vol. 3, no. 1, pp. 12-18, 2020, https://doi.org/10.33116/ije.v3i1.46.
- S. Akhmad and A. Arendra, “Environmentally friendly plastic tiles for substituting wooden board, and its processing machine design,” IOP Conference Series: Materials Science and Engineering, vol. 1125, no. 1, p. 012105, 2021, https://doi.org/10.1088/1757-899X/1125/1/012105.
- E. Indasyah, et al., “Electrical Energy Consumption Monitoring System and Motor Damage Detection on Conveyor Using Fuzzy Method,” 2021 International Conference on Advanced Mechatronics, Intelligent Manufacture and Industrial Automation (ICAMIMIA), Indonesia, 2021, pp. 304-310, https://doi.org/10.1109/ICAMIMIA54022.2021.9807723 .
- W. D. M. Priyashan and N. N. Thilakarathne, “IIoT Framework for SME level Injection Molding Industry in the Context of Industry 4.0,” SSRN, vol. 10, pp. 61 – 68, 2021, https://dx.doi.org/10.2139/ssrn.3750588.
- V. -T. Ngo, et al., “Applying IoT Platform to Design a Data Collection System for Hybrid Power System,” 2021 International Conference on System Science and Engineering (ICSSE), 2021, pp. 181-184 https://doi.org/10.1109/ICSSE52999.2021.9538442.
- S. Janto, H. Nasution, and E. Sofyan, “Improving HVAC Indoor Air Quality for Healthy Buildings,” Proceedings of The Conference on Management and Engineering in Industry, vol. 3, no. 5, pp. 19-24, 2021, https://doi.org/10.33555/cmei.v3i5.109.
- M. M. Nadzri and H. Hashim, “Automatic Dam Shutter for Fish Breeding Pond using Arduino: Automatic Dam Shutter,” peat, vol. 2, no. 2, pp. 405–418, 2021, https://publisher.uthm.edu.my/periodicals/index.php/peat/article/view/715.
- S. Lu, “Research and practice on the intelligent transformation of the gate control system in a large hydropower station,” Journal of Physics: Conference Series, vol. 2399, no. 1, p. 012038, 2022, https://doi.org/10.1088/1742-6596/2399/1/012038.
- E. N. Ylmaz, B. Ciylan, S. Gönen, E. Sindiren, and G. Karacayılmaz, “Cyber security in industrial control systems: Analysis of DoS attacks against PLCs and the insider effect,” 2018 6th International Istanbul Smart Grids and Cities Congress and Fair (ICSG), pp. 81-85, 2018, https://doi.org/10.1109/SGCF.2018.8408947.
- D. Zhao, et al., “Construction of Intelligent Irrigation System for Kiwifruit Planting Base Based on PLC,” Journal of Physics: Conference Series. vol. 1533, no. 3, p. 032085, 2020, https://doi.org/10.1088/1742-6596/1533/3/032085.
Automatic Dam Gate Monitoring System with Outseal Mega V2 PLC and Haiwell HMI (Ahmad Nur Rofix)