Buletin Ilmiah Sarjana Teknik Elektro ISSN: 2685-9572
Design an Internet of Things-Based LPG Gas Leak Detection System
Mustofa, Abdul Fadlil
Department of Electrical Engineering, Universitas Ahmad Dahlan, Yogyakarta, Indonesia
ARTICLE INFORMATION |
| ABSTRACT |
Article History: Submitted 14 January 2022 Revised 26 January 2022 Accepted 06 January 2023 |
| 
LPG currently plays a big role in human life, both in industry and households. However, since the existence of LPG, there have been many cases of fires caused by LPG gas leaks. Undetected LPG gas leaks can cause sparks and can trigger fires. Therefore, currently an LPG gas detection device is needed. The system designed in this study uses an MQ-6 sensor to detect LPG gas, and NodeMCU as a microcontroller. This system not only detects leaking gas, but can also provide alerts and information to the Blynk application on smartphones by utilizing the Internet of Things (IoT). System testing resulted in an error value in detecting gas of 9.52% and the distance between the system and the smartphone was 500 meters. The sensor can detect gas well when the distance between the gas and the sensor is no more than 10 cm. The system can provide information to the smartphone if a gas leak is detected and can provide alerts by turning on the buzzer and LEDs. |
Keywords: Detection; Leakage; LPG; MQ-6; IoT
|
Corresponding Author: Abdul Fadlil, Universitas Ahmad Dahlan, Jalan Ring Road Selatan, Bantul, Yogyakarta, Indonesia. Email: fadlil@ee.uad.ac.id |
This work is licensed under a Creative Commons Attribution-Share Alike 4.0 
|
Citation Document: Mustofa and A. Fadlil, “Design an Internet of Things-Based LPG Gas Leak Detection System,” Buletin Ilmiah Sarjana Teknik Elektro, vol. 4, no. 3, pp. 121-130, 2022, DOI: 10.12928/biste.v4i3.5572. |
- INTRODUCTION
The Government of the Republic of Indonesia in May 2007 issued a Decree of the Minister of Energy and Mineral Resources No.: 1971/26/May 2007 issued a statement by replacing the use of kerosene (kerosene) in the family environment with LPG [1]. The replacement of fuel is a form of answer obtained from the increasing world crude oil prices [18]. LPG is not the same as combustible gas because it is produced using oil [2]. The use of LPG gas is relied upon to reduce public fuel utilization considering that LPG gas is more effective [3], [20].
In fact, in the field, there are various problems, both in terms of marketing, use, to the affordability of LPG fuel which is still small [19]. Since its inception, there have been many cases of fires that have occurred due to unknown gas leaks [4]. The problem is that leaking and undetectable LPG gas can produce sparks [16] that can trigger a fire [8]. Gas leak detection devices are widely available in the market, but they can only provide warnings in that area, so people who are not at the location cannot know if a leaking gas is detecte [5] [17].
The way to overcome this problem is that a tool is needed that can detect LPG gas leaks [15] that can provide warnings if there is an LPG gas leak based on the Internet of Things (IoT) [6], [7]. IoT is a system that can send data through the network even though there is no direct interaction between objects. This technology can be accessed through several existing microcontrollers, one example being arduino and raspberry [9], [14]. IoT it self has a network and internet that has been developed [10]. IoT can create an identity in objects so that they can recognize other objects [11], making it easier to interact between humans and these objects anywhere and anytime [12].
In this study, an IoT-based LPG gas leak detection system will be designed. This system uses an MQ-6 sensor as an LPG gas detector and NodeMCU as a microcontroller. The system will also display the detected values on the LCD and use the LED and buzzer as indicators when a leak is detected.
- RESEARCH METHODS
- System Design
There are two stages in the design of the system to be made, namely software and hardware design. The software design section contains an algorithm diagram about the operation of the system. The hardware design section contains a block diagram of the hardware system and the wiring diagram of the system circuit.
- Software Design
In designing this system, using Arduino IDE software as a device to program NodeMCU in C++ language. Before programming the system using the Arduino IDE software, a flowchart of the system to be designed is made. The flowchart shown in Figure 1 is the working system design of the LPG gas leak detection system
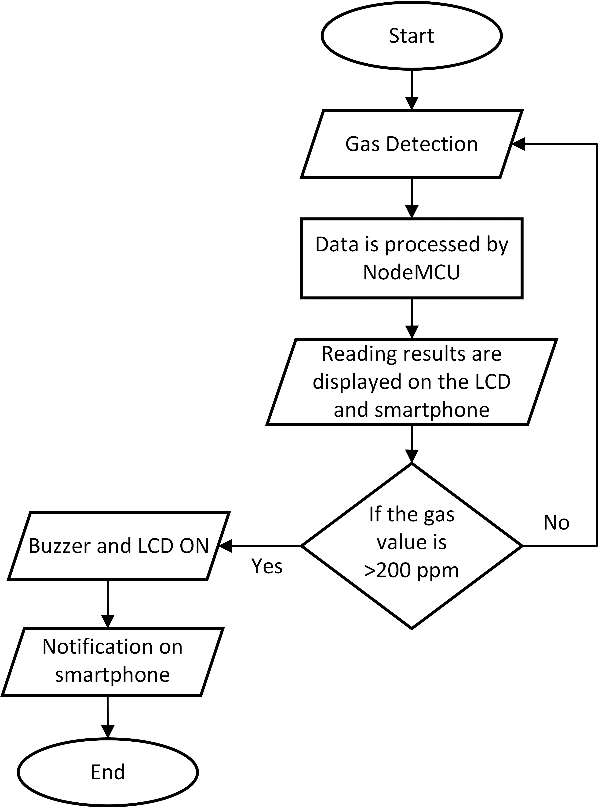
Figure 1. System Flow Chart
It starts with applying an input voltage to the NodeMCU microcontroller which will later be connected to the internet network. After connecting to the internet network, the MQ-6 sensor will detect gas [13]. It will then be sent to NodeMCU for data processing. After processing, the value will appear on the LCD screen and on the blynk application on the smartphone. The gas values that appear on LCDs and smartphones are used as inputs for LEDs and buzzers. If the gas value detected is more than 400 ppm, the system will send a notification on the smartphone that an LPG gas leak is detected, the system will also provide a warning by turning on the LED and buzzer. The system flow chart can be seen in Figure 1.
- Hardware design
The hardware design of the designed system consists of a NodeMCU microcontroller which serves as a controller of the data values read by the MQ-6 sensor which is then processed and sends data to the smartphone. The system design block diagram can be seen in Figure 2.
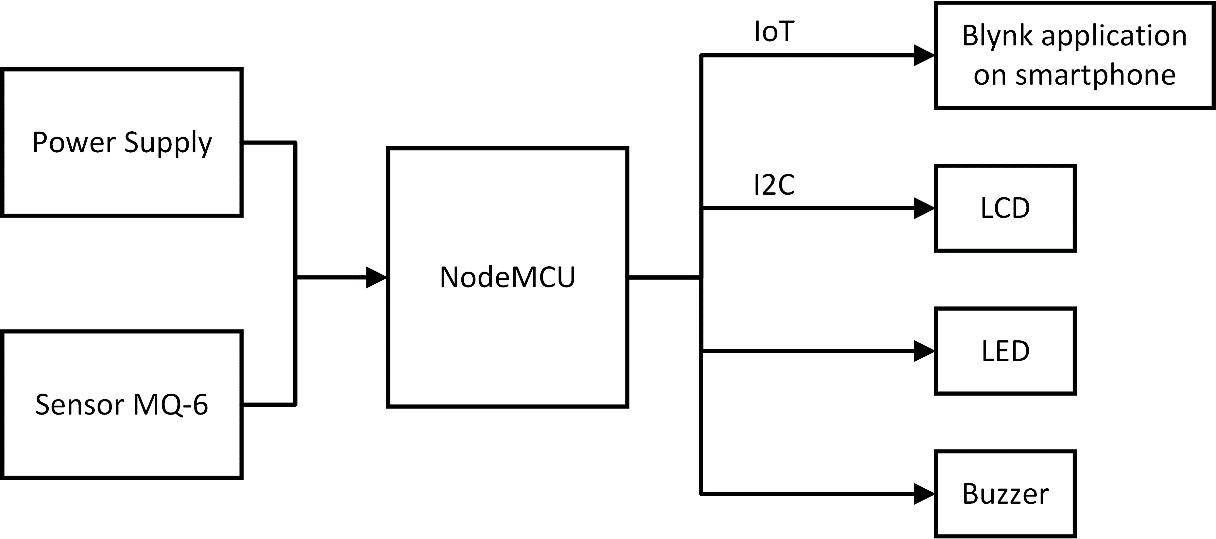
Figure 2. System Block Diagram
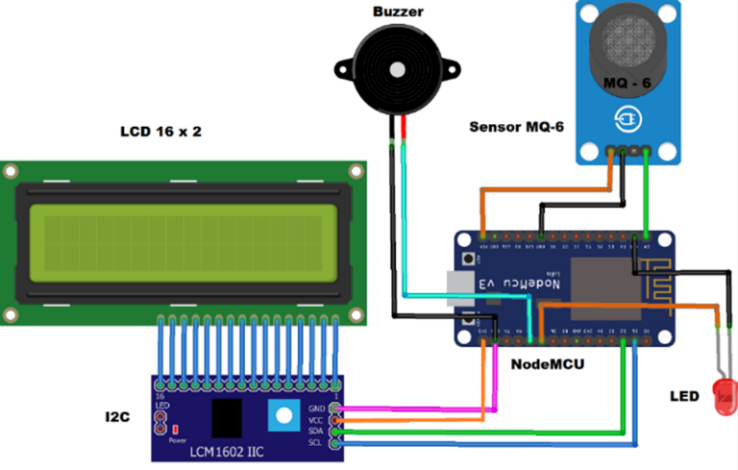
The system created in this study used a microcontroller in the form of NodeMCU ESP8266. NodeMCU is an open source IoT (Internet of Things) platform consisting of hardware in the form of System On Chip (SoC) ESP8266-12. Value data coming from the MQ-6 sensor will be processed by NodeMCU and later the data will be displayed on the LCD and sent to the Blynk application on the smartphone. The gas value that appears on the LCD layer will be the input for the LED and buzzer to warn if the gas value terdeteksi exceeds the system threshold. The entire hardware circuit can be seen in Figure 3.
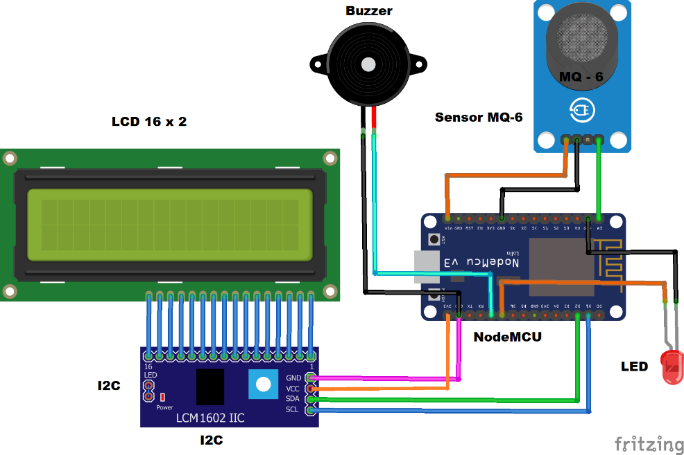
Figure 3. Hardware Design Diagram
In Figure 3, it can be seen that NodeMCU as the controller of the LPG gas leak detection system has inputs and outputs used in the designed system. The inputs and outputs on NodeMCU can be seen in Table 1.
Table 1. NodeMCU Output Input
Pin NodeMCU | Device |
D1, D2, and Vin | LCD |
A0, SD2 | Sensor MQ-6 |
D7 and D8 | LEDs and Buzzers |
- Research Flow Chart
There are several stages of research carried out to create a system that has been designed. After conducting a literacy study and identifying problems, then proceed to the preparation process for designing the system. At this stage, all the necessary things in the study are prepared. If so, enter the hardware and software design stage. After the designed system has been made, the tool testing process is carried out. If the tool is successful, then enter the data retrieval and analysis process section. After all stages have been completed, an evaluation process of the research carried out is carried out. The research flow chart can be seen in Figure 4.
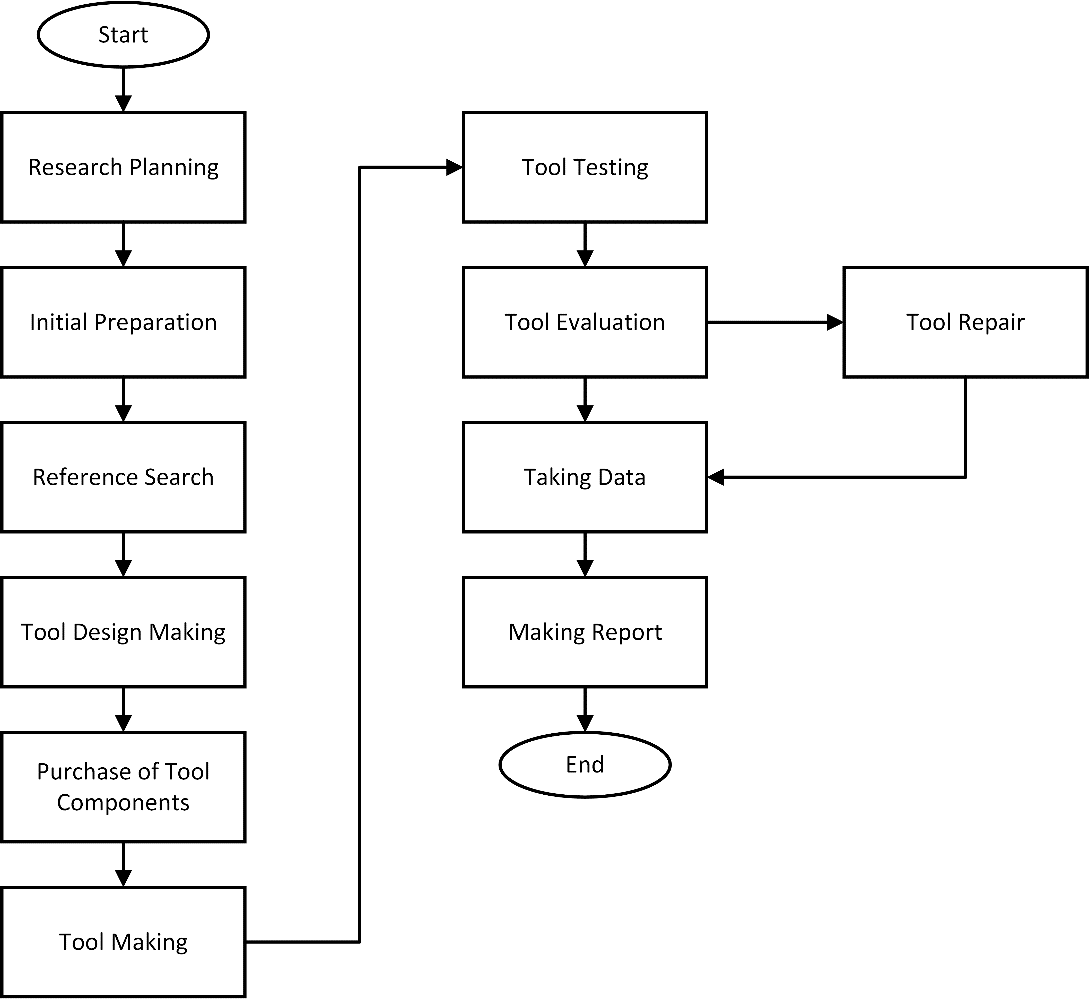
Figure 4. Research Flowchart
- RESULTS AND DISCUSSION
- MQ-6 Sensor Testing
MQ-6 testing was carried out in order to determine the ability of the sensor to detect leaking gas. In testing this gas sensor, a comparison was made between the tools made in this study and factory-made tools on the market. This sensor testing mechanism was carried out by spraying LPG gas on the sensors of each tool, both factory-made tools and tools made in this study. Gas spraying is given a distance of 1-5 cm with a time of 0-5 seconds then the highest value is seen to be used as research data.
To find the error value, a comparison is made between the values detected by the gas detection device (factory-made) on the market with the tool made in this study using the formula equation (1).
| 
| (1) |
Standard Value is the value taken from a factory-made gas detection device. The test value is the value taken from the created tool. The test results of the MQ-6 sensor can be seen in Table 2.
Table 2. MQ-6 sensor test results
Distance (cm) | Factory-Made Detection Equipment (PPM) | Built Detection Tool (PPM) | Error Value (%) |
1 | 1.527 | 1.298 | 14.9 |
2 | 1.371 | 1.229 | 10.3 |
3 | 1.224 | 1.147 | 6.29 |
4 | 1.148 | 1.039 | 9.49 |
5 | 1.057 | 987 | 6.62 |
Average | 9.52 |
- Tool Prototype
In this study, an LPG gas leak detection system was made consisting of a series of several components. The overall network of systems in the form of hardware can be seen in Figure 5 and Figure 6.
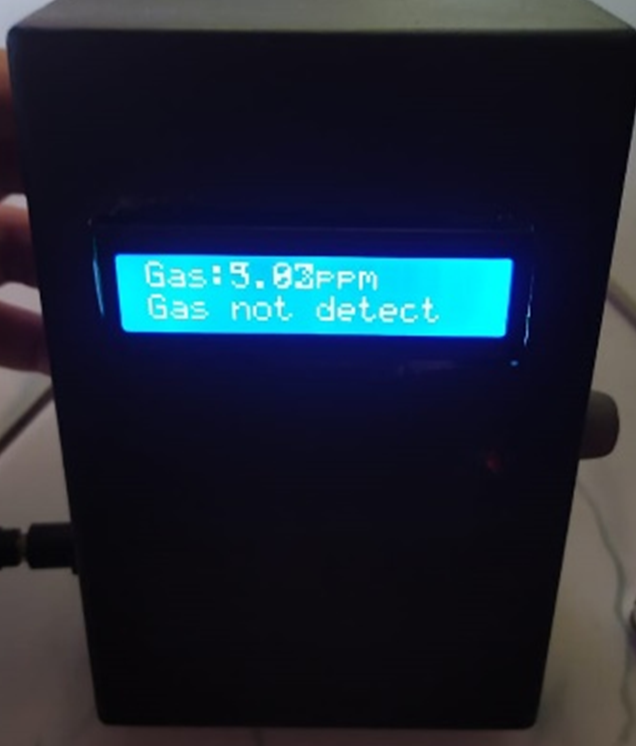
Figure 5. Tool view from the front
Figure 5 is a view of the suite of tools from the front. Where on the front there is an LCD that is used to display the value of the detected gas. The gas value displayed on this LCD is used as an input for the LED and buzzer. In addition to the LCD, on the front there is also an LED located under the LCD. This LED is used as an indicator when the value of the detected gas exceeds the threshold (400 ppm).
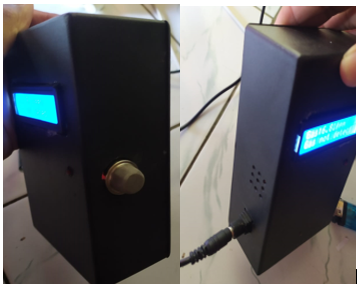
Figure 6. A side-by-side view of the tool set
In Figure 6, it can be seen on the right side that there is an mq-6 sensor as an LPG gas detector, and on the left side there is a speaker (Buzzer) as an indicator and a cable as a voltage source.
- System Testing
Tool testing in this study is testing tools that have been designed in such a way with the aim of whether the tools that have been made can work as expected. Testing of this tool is carried out in a closed room with an area of 3 x 3 meters. The tool testing mechanism is carried out by applying gas to the MQ-6 sensor providing a distance between the sensor and gas as far as 1-5 cm and also between the smartphone and the tool as far as 500 m. If the detected gas value exceeds the threshold of 400 ppm, the system will give a warning and send information to the smartphone.
The value of 400 ppm used as a threshold in the system made was obtained from the results of previous studies that both used MQ-6 sensors with the same sensor capability, which can detect LPG gas between 0-2000 ppm. A value of 400 ppm is also obtained according to the Low Explosion Limit standard, which is defined as the lowest concentration of gas or steam in the air that can produce a flash of fire. The results of testing this tool can be seen in Table 3.
Table 3. Tool test results
Sensor distance (cm) | Test (PPM) | Status | Smartphone Distance (meters) | Smartphone notifications | Buzzer and LED |
1 | 1,231 | Detected | 500 | Exist | On |
2 | 1,157 | Detected | 500 | Exist | On |
3 | 1,093 | Detected | 500 | Exist | On |
4 | 987 | Detected | 500 | Exist | On |
5 | 906 | Detected | 500 | Exist | On |
6 | 863 | Detected | 500 | Exist | On |
7 | 739 | Detected | 500 | Exist | On |
8 | 564 | Detected | 500 | Exist | On |
9 | 438 | Detected | 500 | Exist | On |
10 | 416 | Detected | 500 | Exist | On |
11 | 357 | Undetectable | 500 | None | Off |
Table 3 is the result of tests conducted on the designed LPG gas leak detection device. Table 3 shows that the testing of LPG gas leak detection equipment was carried out with 11 experiments. At a distance of 1 - 10 cm the sensor can detect gas well with the lowest value of 416 ppm at a distance of 10 cm and the largest value of 1,231 ppm with a distance of 1 cm, this is due to the distance that is too close so that the sensor can detect the gas well. In this test, it was seen that the sensor can detect gas well at a maximum distance of 10 cm. At a distance of more than 10 cm with a time of 0 to 5 seconds the highest detectable gas value is 357 with a distance of 11 cm, which means that it is still under normal conditions because the gas value detected is still below 400 ppm. In addition, the gas detection device made can transmit data to a smartphone with a distance of 500 meters. LEDs and buzzers can also work well when the detected gas value exceeds the specified threshold.
With this result, it means that all components that have been designed can function properly. Tools that have been designed can also work according to what is expected. A tool that has been designed can detect leaking gas and can provide warnings to the user if a gas leak is detected. In addition, this tool can also apply IoT (Internet of Things) technology, so this tool is able to transmit data to the user's smartphone.
- LCD Testing
LCD testing in this study aims to ensure that the LCD can run properly, so that in the process of displaying indications a good data is obtained. This LCD test is carried out with 2 different conditions, namely normal conditions and dangerous conditions. Normal conditions are conditions when the value of the detected gas is below the threshold, and hazardous conditions are conditions when the value of the detected gas exceeds the threshold of the system. LCD testing can be seen in Figure 7 and Figure 8, and the Table of test results can be seen in Table 4.
Figure 7 is the condition of the LED and buzzer when the detected gas value does not exceed the threshold (<400 ppm), so in Figure 8 it shows the LED Off as well as the buzzer. Figure 8 is the condition of the LED and buzzer when the gas value exceeds the threshold (>400 ppm). In Figure 8, it looks LED On as well as the buzzer. Test results on LEDs and buzzers can also be seen in Table 4.
Based on the LCD test results in Table 4, if the gas value (ppm) does not exceed the threshold (<400 ppm) status on the LCD display “gas not detect” which means that there is no LPG gas leakage detected. When the ppm value does not exceed the threshold LED and the buzzer Off or off. Unlike when the value of the detected gas exceeds the threshold (>400) then the status on the LCD becomes “gas detection” then the LED and buzzer On or on. With this result, it shows if the LCD can work properly.
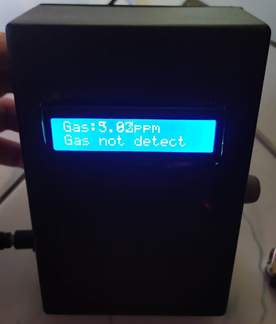
Figure 7. LCD display under normal conditions
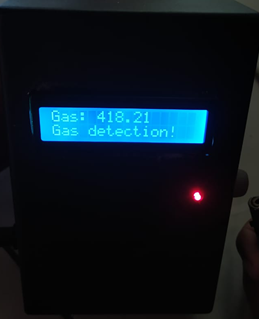
Figure 8. LCD display in hazardous conditions
Table 4. LCD test results
PPM value | Status (LCD) | Output (Volts) | Buzzer | LED |
<400 | Gas not detect | 4.6 Volts | OFF | OFF |
<400 | Gas not detect | 4.7 Volts | OFF | OFF |
>400 | Gas detection | 4.8 Volts | ON | ON |
>400 | Gas detection | 4.7 Volts | ON | ON |
- IoT Testing
IoT testing in this study was carried out with the aim of ensuring that the system can transmit data on smartphones by generating gas values on smartphones. In addition to sending data, this test is carried out to ascertain whether the system can work properly by sending a notification to the smartphone when the detected gas value exceeds the system threshold. IoT testing in this study can be seen in Figure 9 and Figure 10.
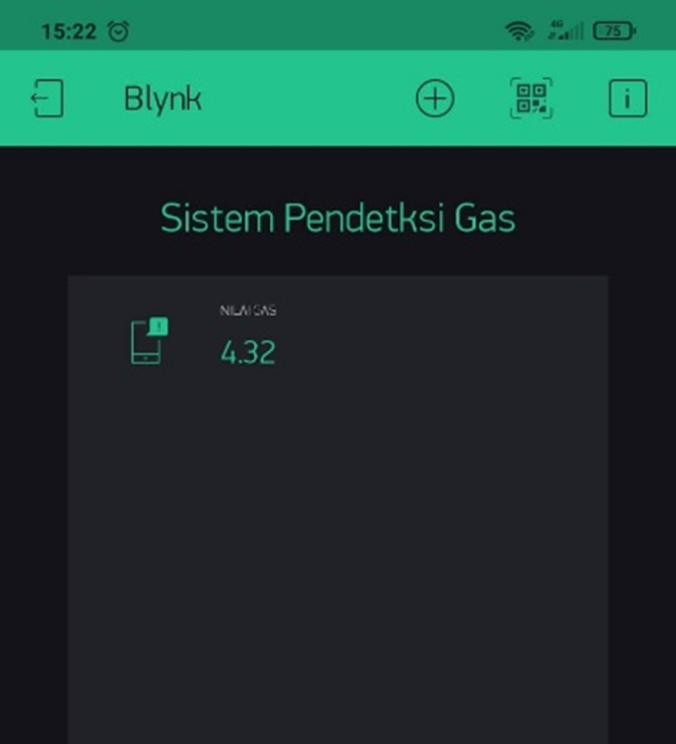
Figure 9. Gas value display on a smartphone (Blynk)
This gas detection system in addition to displaying the gas value detected on the LCD can also display the gas value detected on the smartphone through the Blynk application as shown in Figure 9.
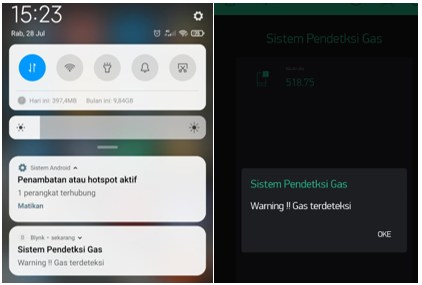
Figure 10. Notification display on a smartphone
In addition to displaying gas values on smartphones, the system can also provide notifications in the Blynk application on smartphones, as shown in Figure 10. A notification on the smartphone will appear if the value of the gas gas detected exceeds 400 ppm. The results of IoT testing in this study can also be seen in Table 5.
Table 5. IoT test results
Gas Value (ppm) | Status | Notification |
<400 | Undetectable | None |
>400 | Detected | Exist |
- CONCLUSIONS
Based on the results of research and tool design that has been done, it can be concluded that, the sensor used in the study was able to detect LPG gas leaks of a maximum of 2000 ppm. This gas leak detection system can display the gas levels detected by the sensor on the LCD. The LED and buzzer will turn on when a gas leak is detected and turn off when no gas leak is detected. The IoT (Internet of Things) technology applied in this study works well when sending data to smartphones and providing notifications to smartphones. System testing resulted in an error value in detecting gas of 9.52% and the distance between the system and the smartphone was 500 meters. The sensor can detect gas well when the distance between the gas and the sensor is no more than 10 cm. The system can provide information to the smartphone if a gas leak is detected and can provide alerts by turning on the buzzer and LEDs.
ACKNOWLEDGEMENTS
Thank you to all editors and reviewers for all the suggestions and feedback that have helped in the process of making this paper. Thank you also to those who have supported this research and provided moral and material assistance.
REFERENCE
[1] M. I. Fahim et al., “Design of an IoT Based Gas Wastage Monitoring, Leakage Detecting and Alerting System,” In 2021 IEEE 12th Annual Ubiquitous Computing, Electronics & Mobile Communication Conference (UEMCON), pp. 0591-0597, 2021, https://doi.org/10.1109/UEMCON53757.2021.9666510.
[2] S. Suwarjono et al., “Design of a Home Fire Detection System using Arduino and SMS Gateway,” Knowledge, vol. 1, no. 1, pp. 61-74, 2021, https://doi.org/10.3390/knowledge1010007.
[3] V. Suma, R. R. Shekar, and K. A. Akshay, “Gas Leakage Detection Based on IOT,” In 2019 3rd International conference on Electronics, Communication and Aerospace Technology (ICECA), pp. 1312-1315, 2019, https://doi.org/10.1109/ICECA.2019.8822055.
[4] L. Salhi, T. Silverston, T. Yamazaki, T. Miyoshi, “Early detection system for gas leakage and fire in smart home using machine learning,” In 2019 IEEE International Conference on Consumer Electronics (ICCE), pp. 1-6, 2019, https://doi.org/10.1109/ICCE.2019.8661990.
[5] S. Syofian and T. Setiyaningsih, “Detection system and security monitoring of the storage room of liquid oil gas with zoning method,” In IOP Conference Series: Materials Science and Engineering, vol. 909, no. 1, p. 012060, 2020, https://doi.org/10.1088/1757-899X/909/1/012060.
[6] H. Saad, S. A. Siddiqui, N. F. Naim, and N. Othman, “Development of LPG Leakage Simulation System Integrated with the Internet of Things (IoT),” 2022 IEEE 18th International Colloquium on Signal Processing & Applications (CSPA), pp. 161-166, 2022, https://doi.org/10.1109/CSPA55076.2022.9781880.
[7] H. A. Bany Salameh, M. F. Dhainat, and E. Benkhelifa, “An End-to-End Early Warning System Based on Wireless Sensor Network for Gas Leakage Detection in Industrial Facilities,” in IEEE Systems Journal, vol. 15, no. 4, pp. 5135-5143, 2021, https://doi.org/10.1109/JSYST.2020.3015710.
[8] H. Kareem, “Embedded real-time system for detecting leakage of the gas used in iraqi kitchens,” Indonesian Journal of Electrical Engineering and Computer Science, vol. 14, no. 3, pp. 1171-1176, 2019, http://doi.org/10.11591/ijeecs.v14.i3.pp1171-1176.
[9] M. D. Mudaliar and N. Sivakumar, “IoT based real time energy monitoring system using Raspberry Pi,” Internet of Things, vol. 12, p. 100292, 2020, https://doi.org/10.1016/j.iot.2020.100292.
[10] M. S. Hossain, M. Rahman, M. T. Sarker, M. E. Haque, A. Jahid, “A smart IoT based system for monitoring and controlling the sub-station equipment,” Internet of things, vol. 7, p. 100085, 2019, https://doi.org/10.1016/j.iot.2019.100085.
[11] H. Hamidi, “An approach to develop the smart health using Internet of Things and authentication based on biometric technology,” Future generation computer systems, vol. 91, pp. 434-449, 2019, https://doi.org/10.1016/j.future.2018.09.024.
[12] R. Jayaysingh, J. David, M. J. M. Raaj, D. Daniel, and D. BlessyTelagathoti, “Iot based patient monitoring system using nodemcu,” In 2020 5th international conference on devices, circuits and systems (ICDCS), pp. 240-243, 2020, https://doi.org/10.1109/ICDCS48716.2020.243588.
[13] M. M. Khan, “Sensor-based gas leakage detector system,” Engineering Proceedings, vol. 2, no. 1, p. 28, 2020, https://doi.org/10.3390/ecsa-7-08278.
[14] W. A. Jabbar et al., “Design and fabrication of smart home with internet of things enabled automation system,” IEEE access, vol. 7, pp. 144059-144074, 2019, https://doi.org/10.1109/ACCESS.2019.2942846.
[15] N. Rahayu, “Early Warning Of Leaking Lpg Gas Through Short Message Service (Sms) And Loudspeaker Tool Using Arduino Uno,” Journal of Applied Engineering and Technological Science (JAETS), vol. 1, no. 2, pp. 91-102, 2020, https://doi.org/10.37385/jaets.v1i2.61.
[16] B. K. Mohammed, M. B. Mortatha, A. S. Abdalrada, and H. T. S. ALRikabi, “A comprehensive system for detection of flammable and toxic gases using IoT,” Periodicals of Engineering and Natural Sciences (PEN), vol. 9, no. 2, pp. 702-711, 2021, http://dx.doi.org/10.21533/pen.v9i2.1894.
[17] L. Dong et al., “The gas leak detection based on a wireless monitoring system,” IEEE Transactions on Industrial Informatics, vol. 15, no. 12, pp. 6240-6251, 2019, https://doi.org/10.1109/TII.2019.2891521.
[18] S. K. A. Rizvi, B. Naqvi, S. Boubaker, and N. Mirza, “The power play of natural gas and crude oil in the move towards the financialization of the energy market,” Energy Economics, vol. 112, p. 106131, 2022, https://doi.org/10.1016/j.eneco.2022.106131.
[19] K. Troncoso, P. Segurado, M. Aguilar, and A. S. da Silva, “Adoption of LPG for cooking in two rural communities of Chiapas, Mexico,” Energy Policy, vol. 133, p. 110925, 2019, https://doi.org/10.1016/j.enpol.2019.110925.
[20] S. P. Astuti, R. Day, and S. B. Emery, “A successful fuel transition? Regulatory instruments, markets, and social acceptance in the adoption of modern LPG cooking devices in Indonesia,” Energy Research & Social Science, vol. 58, p. 101248, 2019, https://doi.org/10.1016/j.erss.2019.101248.
AUTHOR BIOGRAPHY

| Mustofa completed his undergraduate education in the Electrical Engineering Department at Universitas Ahmad Dahlan in 2021.
|
|
|

| Abdul Fadlil completed his undergraduate education in the Physics Department at Gadjah Mada University, completed his master's education in the Electrical Engineering Department at Gadjah Mada University, completed his doctoral education in the Electrical Engineering Department at Universitas Teknologi Malaysia. Currently, author 2 is a permanent lecturer in the Department of Electrical Engineering at Universitas Ahmad Dahlan. His research areas are pattern recognition and intelligent systems.
|
|
|
Design an Internet of Things-Based LPG Gas Leak Detection System (Mustofa)