Buletin Ilmiah Sarjana Teknik Elektro ISSN: 2685-9572
Chili Plants Soil Fertility Monitoring System Based on Internet of Things (IoT)
Wahyu Prawoto, Anton Yudhana
Department of Electrical Engineering, Universitas Ahmad Dahlan, Yogyakarta, Indonesia
ARTICLE INFORMATION |
| ABSTRACT |
Article History: Submitted 08 December 2022 Revised 16 January 2023 Accepted 20 January 2023 |
| 
Soil fertility is one of the main factors in cultivating chili peppers. Variables that need to be considered to support chili growth include soil temperature and pH. This study aims to monitor soil fertility using the DS18B20 temperature sensor and an Internet of Things (IoT)-based soil pH sensor combined with the Geographical Information System (GIS) algorithm. Ituses parameters of temperature values and soil pH values with geographic readings via GIS. The DS18B20 temperature sensor values and ground pH sensor are processed on the ESP8266 NodeMCU then displayed on a 20x4 LCD and sent to the ThingSpeak website in real time. Soil fertility testing is carried out in the morning and evening by comparing the measurement results of the DS18B20 temperature sensor and soil pH sensor with a standard tool, namely the 4in1Soil Survey Instrument. The results of soil fertility testing using the DS18B20 temperature sensor and soil pH sensor conducted in the morning obtained a temperature accuracy of 95.36% and a pH accuracy of 95.96%. Meanwhile, the results carried out in the afternoon obtained a temperature accuracy of 94.36% and a pH accuracy of 89.96%. The implementation of GIS in this study succeeded in mapping the fertility of good and bad soils. |
Keywords: Chili; DS18B20 Sensor; Soil pH Sensor; ThingSpeak; Internet of Things (IoT); Geographical Information System (GIS) |
Corresponding Author: Anton Yudhana, Department of Electrical Engineering, Universitas Ahmad Dahlan, Yogyakarta, Indonesia. Email: eyudhana@ee.uad.ac.id |
This work is licensed under a Creative Commons Attribution-Share Alike 4.0 
|
Document Citation: W. Prawoto and A. Yudhana, “Chili Plants Soil Fertility Monitoring System Based on Internet of Things (IoT),” Buletin Ilmiah Sarjana Teknik Elektro, vol. 4, no. 3, pp. 161-171, 2022, DOI:10.12928/biste.v4i3.5298. |
- INTRODUCTION
Indonesia is an agricultural country that has great opportunities in increasing economic growth in the agricultural sector. Chili is one of the plants classified as fruit vegetables that have a fairly high economic value [1]. Chili is widely used to meet needs such as carbohydrates, calcium, protein, vitamins A and C that are necessary for the health of the human body [2]. In the cultivation of chili plants requires more care because if the chili is not in a good state then the chili does not grow well. Inappropriate soil temperature and pH conditions will inhibit the growth of chili plants [3].
Soil that has good quality is soil that can produce maximum yields. There are several factors that can affect the growing environment of chili plants including soil temperature and soil pH. The ideal temperature of chili plants is between 24°C – 28°C [4]. While the ideal soil pH of chili plants is between 5.5 – 6.8 [5]. Fertile soil makes chili plants grow well [6]. Soil temperature and pH conditions can have an effect on the fertility of the soil used to grow chili peppers [7].
Farmers currently do not have the right indicators in determining soil fertility. Most of the farmers use manual measurements to determine soil fertility which causes it to be less productive in terms of time. For this reason, a system is needed that can monitor soil fertility in chili plants in real time [8]. IoT (Internet of Things) systems can be used for monitoring, information media, management, and modeling. IoT systems are the concept of devices that are able to transmit data without requiring interaction between humans [9].
Based on previous research yang has a major topic about soil fertility [10][11][12][13][14][15]. There has been no research that monitors soil fertility based on the Internet of Things (IoT) with a Geographical Information System (GIS). Therefore, in this research, an Internet of Things (IoT) based soil fertility monitoring tool will be designed combined with a Geographical Information System (GIS) algorithm that can be Become a reference for farmers in making decisions. The tools used are the DS18B20 temperature sensor which functions to determine soil temperature and the soil pH sensor which functions to determine the acidity level of the soil. The existence of modern equipment can make it easier for farmers to find out the fertility of the soil used as a medium for growing chili peppers [16].
- METHODS
- System Design
In designing this system, a system design is used with two stages of design, namely hardware design and software design. The first step in designing this system is to make a hardware block diagram, then proceed with making a parameter measurement system and sensor circuits. The second step is to create software/commands that are used to operate a soil fertility monitoring system on chili plants.
- Hardware Design
The hardware design in this study includes inputs, controllers and outputs. The input section consists of a DS18B20 sensor which is used to measure temperature or temperature and a soil pH sensor is used to measure alkaline soil levels. The controller uses the NodeMCU ESP8266 which functions as a data processing center for the DS18B20 sensor and soil pH sensor. Each sensor takes the measurement value and the result of the measurement will go to the ESP8266 NodeMCU which will later be processed into data. The output section consists of the ThingSpeak website and a 20x4 LCD that serves to display the results of the temperature sensor readings and soil pH. The system block diagram is shown in Figure 1.
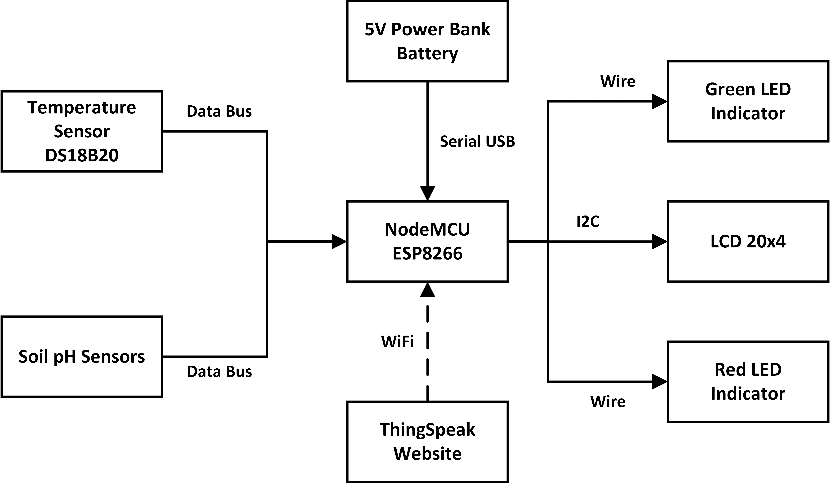
Figure 1. System block diagram
Explanation Figure 1 is that the sensor reads the temperature and acidity conditions of the soil in chili plants in the form of analog values, then the analog values are converted into digital values using ADC (analog to digital converter) on the NodeMCU ESP8266 microcontroller. Furthermore, the digital data will be sent via the Wi-Fi module using the internet network to the ThingSpeak website. In addition, digital data will also be sent on a 20x4 LCD.
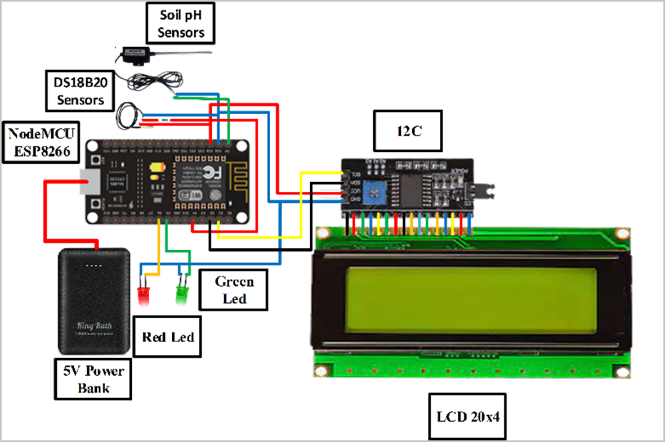
Figure 2 represents a wiring diagram of the entire system designed to connect all components so that they can read soil fertility. Each component has its own task as input, namely the DS18B20 sensor and soil pH sensor and output in the form of a 20x4 LCD display. Othersupporting components such as NodeMCU ESP8266, LED, 12C, and powerbank. Inputs and outputs on NodeMCU can be seen in Table 1.
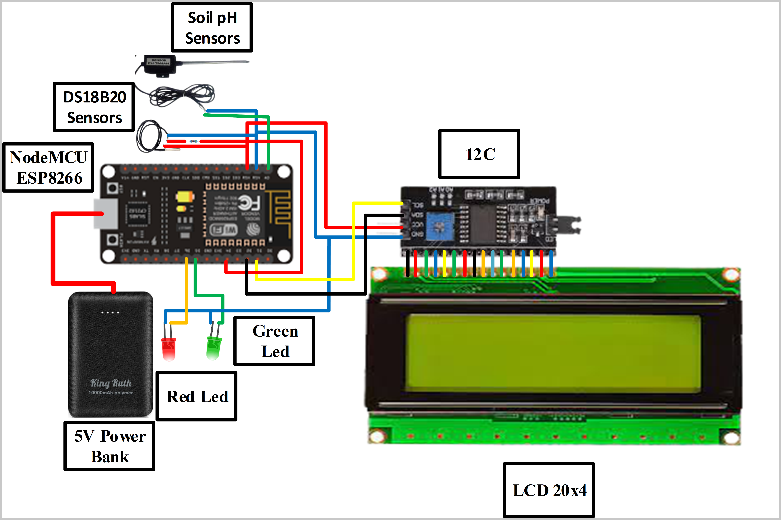
Figure 2. System wiring diagram
Table 1. Input and Output
Pin NodeMCU | Sensors/Actuators |
D4, Vcc, Ground | Sensor DS18B20 |
Vcc, Ground | Soil pH Sensor |
D5 | Green LED |
D6 | Red LED |
- 3D Design
Planning the overall system design tool using the SketchUp application. The overall design of the tool is as shown in Figure 3.
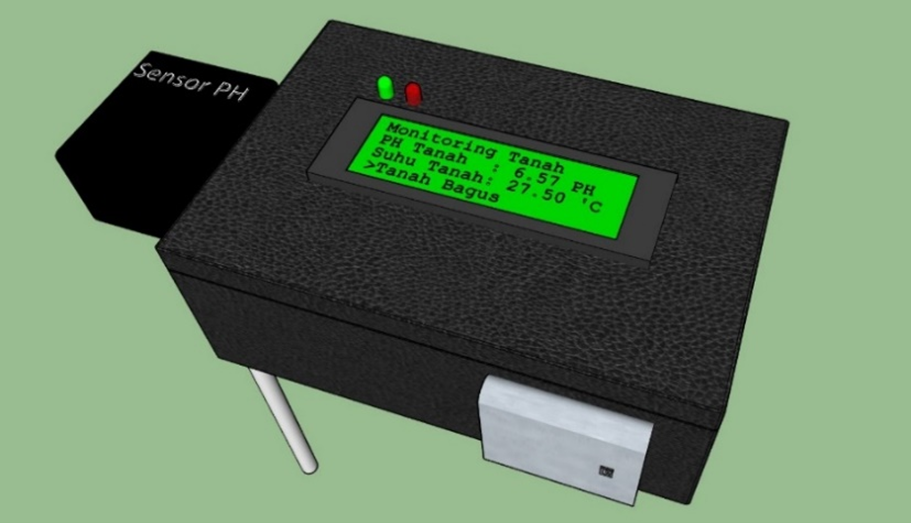
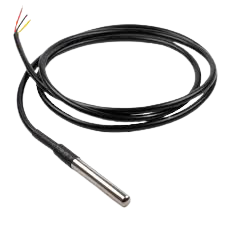
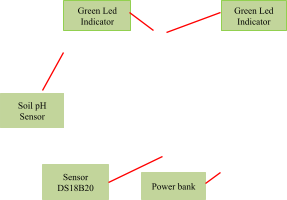
Figure 3. Design tools
The design of the tool consists of a DS18B20 temperature sensor, ground pH sensor, green led, red led, powerbank and 20x4 LCD. On the inside of the box there are NodeMCU ESP8266, I2C, cables and resistors. The shape of the box has a length of 18 cm, a width of 12 cm, and a height of 6 cm.
- Software Design
Software design is the flow of program code that will be made so that the system can work properly and optimally. The program is created using the Arduino IDE application with the c++ language. In this study, two sensors were used, namely the DS18B20 temperature sensor and the soil pH sensor, each of which took measurements. The readings of the two sensors will be displayed on the 20x4 LCD and sent to the ThingSpeak website in real time. The flowchart of the Internet of Things (IoT)-based soil fertility monitoring system can be seen in Figure 4. Then for the paddy field mapping scheme it is shown in Figure 5.
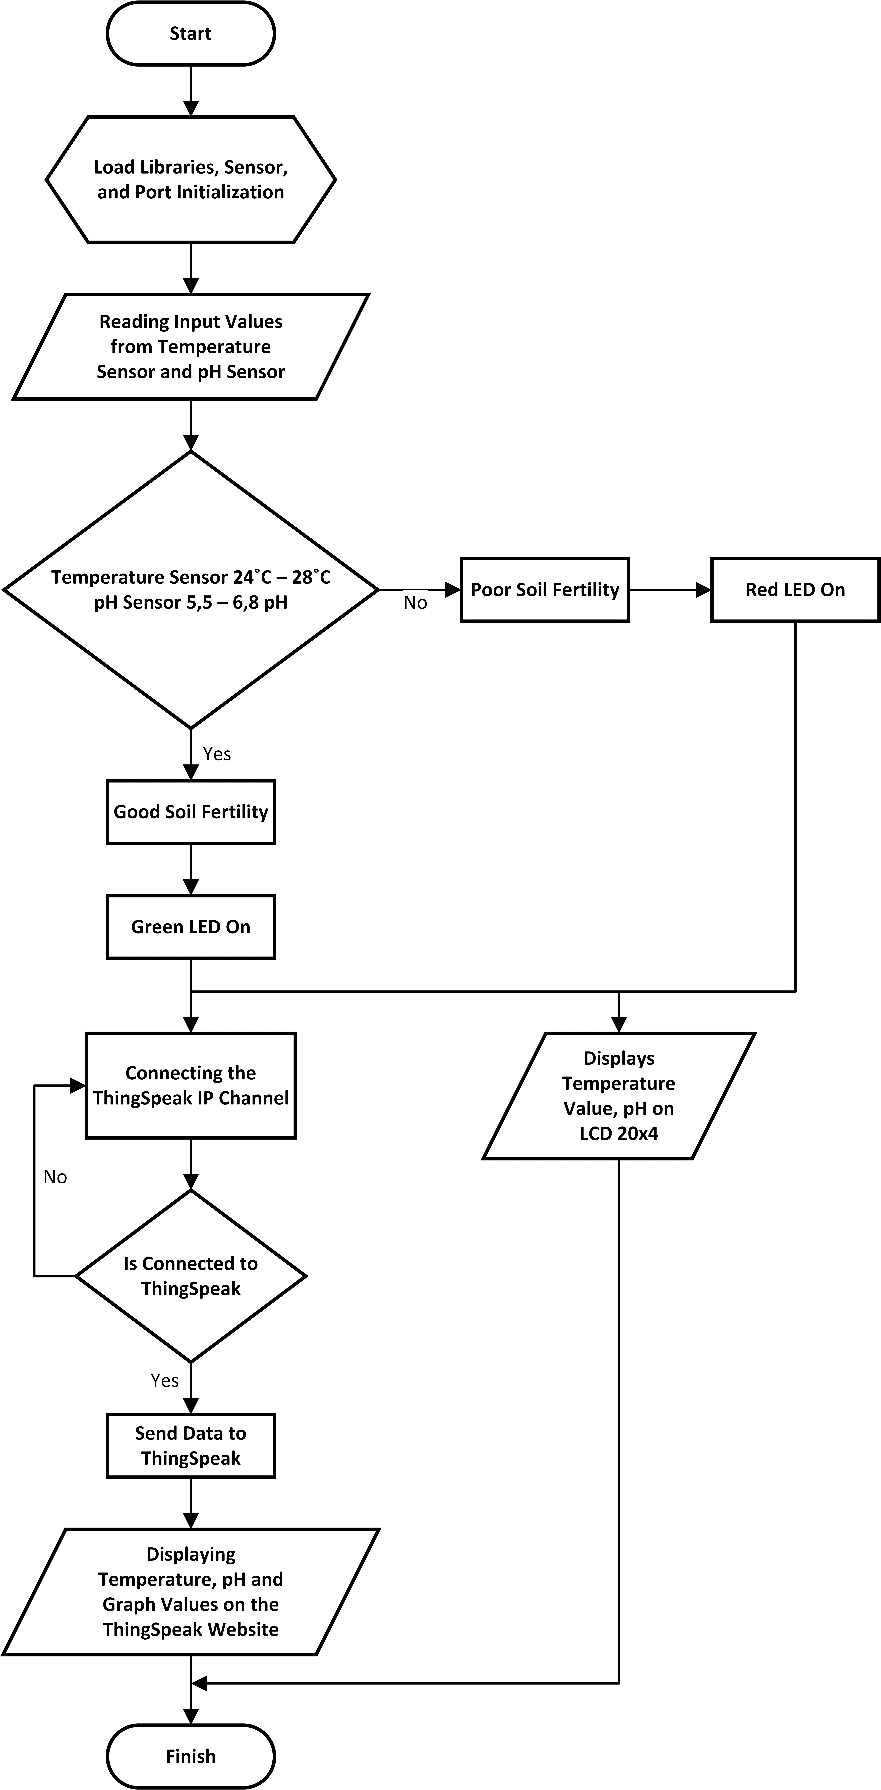
Figure 4. Flowchart system
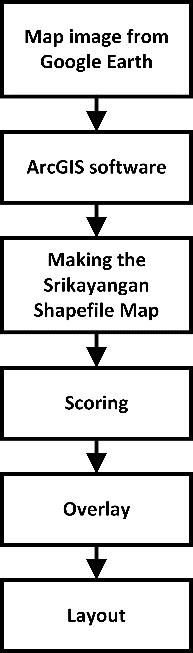
Figure 5. Paddy field mapping scheme
Figure 5 is a rice field mapping scheme that begins with taking a map image of Srikayangan Village from Google Earth and inserting the map into ArcGIS software. From the map image of Srikayangan Village, a shapefile is made which is combined into one structure and a score is made for each polygon [17][18]. With the merging technique produces the desired mapping. Map imagery from google earth is a map image based on current or real conditions. ArcGIS software serves to map the area of rice fields with 10 samples in Srikayangan Village, Yogyakarta. Shapefile creation is a step to save the map image. Then give a score to calculate the soil fertility value based on the temperature and pH parameters of the soil. Overlays are applied to combine shapefiles into a single structure used for inference. The layout illustrates the results of mapping good and poor soil fertility [19][20].
- RESULTS AND DISCUSSION
- DS18B20 Temperature Sensor Testing
Testing of the DS18B20 temperature sensor is carried out in the morning and evening because at that time the soil temperature is in a low state. The test was carried out on chili farmland on Tuesday, May 4, 2021. The purpose of testing temperature sensors is to calculate errors or errors and the accuracy of the measurement result data. The results of the DS18B20 temperature sensor measurement will be compared with the standard tool, namely the 4in1Soil Survey Instrument. The formula for calculating the error value in Equation (1), Equation (2) and Equation (3).
With:
 is the Actual Data,
  is the Measured Data,
  is Error Value, and
  is of Reference Value. The results of the DS18B20 temperature sensor test can be seen in Table 2 and Table 3.
Table 2 of the DS18B20 temperature sensor test results conducted in the morning obtained an average error of 4.59% and an accuracy of 95.36%. At the time of the study at 07.20 there was a percentage difference in temperature measurement of 0.50 and an error of 1.85% was the smallest calculation result obtained but had the largest accuracy value of 98.15%. At 08.30 there was a percentage difference in temperature measurement of 1.77 and an error of 6.10% which was the largest calculation result obtained but had the smallest accuracy value of 93.10%.
Table 2. DS18B20 temperature sensor test results in the morning
No | Time | DS18B20 (°C) Temperature Sensor Measurement | 4in1Soil Survey Instrument (°C) Measurement | Difference | Error (%) | Accuracy (%) |
1 | 07.00 | 26.05 | 27 | 0.95 | 3.51 | 96.49 |
2 | 07.10 | 26.31 | 27 | 0.69 | 2.55 | 97.45 |
3 | 07.20 | 26.50 | 27 | 0.50 | 1.85 | 98.15 |
4 | 07.30 | 26.56 | 28 | 1.44 | 5.14 | 94.86 |
5 | 07.40 | 26.75 | 28 | 1.25 | 4.46 | 95.54 |
6 | 07.50 | 26.81 | 28 | 1.19 | 4.25 | 95.75 |
7 | 08.00 | 26.88 | 28 | 1.12 | 4.00 | 96.00 |
8 | 08.10 | 26.95 | 28 | 1.05 | 3.75 | 96.25 |
9 | 08.20 | 27.20 | 28 | 0.80 | 2.85 | 97.15 |
10 | 08.30 | 27.23 | 29 | 1.77 | 6.10 | 93.10 |
11 | 08.40 | 27.25 | 29 | 1.75 | 6.03 | 93.97 |
12 | 08.50 | 27.42 | 29 | 1.58 | 5.44 | 94.56 |
13 | 09.00 | 27.35 | 29 | 1.65 | 5.68 | 94.32 |
14 | 09.10 | 27.43 | 29 | 1.57 | 5.41 | 94.59 |
15 | 09.20 | 27.45 | 29 | 1.55 | 5.34 | 94.66 |
16 | 09.30 | 27.38 | 29 | 1.62 | 5.58 | 94.42 |
17 | 09.40 | 27.50 | 29 | 1.50 | 5.17 | 94.83 |
18 | 09.50 | 27.55 | 29 | 1.45 | 5.00 | 95.00 |
19 | 10.00 | 27.50 | 29 | 1.50 | 5.17 | 94.83 |
Average | 1.31 | 4.59 | 95.36 |
Table 3 of the DS18B20 temperature sensor test results conducted in the afternoon obtained an average error of 5.63% and an accuracy of 94.36%. At the time of the study at 17.10, 17.20, 17.40 and 17.50 there was a percentage difference in temperature measurement of 1.06 and an error of 3.78% was the smallest calculation result obtained but had the largest accuracy value of 96.22%. At 16.10 there was a percentage difference in temperature measurement of 2.00 and an error of 6.89% which was the largest calculation result obtained but had the smallest accuracy value of 93.11%.
Table 3. DS18B20 temperature sensor test results in the afternoon
No | Time | DS18B20 (°C) Temperature Sensor Measurement | 4in1Soil Survey Instrument (°C) Measurement | Difference | Error (%) | Accuracy (%) |
1 | 15.00 | 27.25 | 29 | 1.75 | 6.03 | 93.97 |
2 | 15.10 | 27.22 | 29 | 1.78 | 6.13 | 93.87 |
3 | 15.20 | 27.13 | 29 | 1.87 | 6.44 | 93.56 |
4 | 15.30 | 27.06 | 29 | 1.94 | 6.68 | 93.32 |
5 | 15.40 | 27.19 | 29 | 1.81 | 6.24 | 93.76 |
6 | 15.50 | 27.13 | 29 | 1.87 | 6.44 | 93.56 |
7 | 16.00 | 27.06 | 29 | 1.94 | 6.68 | 93.32 |
8 | 16.10 | 27.00 | 29 | 2.00 | 6.89 | 93.11 |
9 | 16.20 | 27.10 | 29 | 1.90 | 6.55 | 93.45 |
10 | 16.30 | 27.19 | 29 | 1.81 | 6.24 | 93.76 |
11 | 16.40 | 27.19 | 29 | 1.81 | 6.24 | 93.76 |
12 | 16.50 | 27.13 | 29 | 1.87 | 6.44 | 93.56 |
13 | 17.00 | 27.13 | 29 | 1.87 | 6.44 | 93.56 |
14 | 17.10 | 26.94 | 28 | 1.06 | 3.78 | 96.22 |
15 | 17.20 | 26.94 | 28 | 1.06 | 3.78 | 96.22 |
16 | 17.30 | 26.81 | 28 | 1.19 | 4.25 | 95.75 |
17 | 17.40 | 26.94 | 28 | 1.06 | 3.78 | 96.22 |
18 | 17.50 | 26.94 | 28 | 1.06 | 3.78 | 96.22 |
19 | 18.00 | 26.82 | 28 | 1.18 | 4.21 | 95.79 |
Average | 1.62 | 5.63 | 94.36 |
- Soil pH Sensor Testing
Soil pH sensor testing is carried out in the morning and evening because at that time the acidity or alkalinity of the soil is in a stable state. The test was carried out on chili farmland on Tuesday, May 4, 2021. Soil pH sensor testing aims to find out errors or errors and the accuracy of the measurement result data. The results of measuring the soil pH sensor will be compared with the standard tool, namely the 4in1Soil Survey Instrument. Soil pH sensor test results can be seen in Table 4 and Table 5.
Table 4 results of soil pH sensor tests carried out in the morning obtained an average error of 4.43% and an accuracy of 95.96%. At the time of the study at 09.00, 09.40 and 10.00 there was a percentage difference in temperature measurement of 0.22 and an error of 3.18% was the smallest calculation result obtained but had the largest accuracy value of 96.82%. At 07.40 there was a percentage difference in temperature measurement of 0.42 and an error of 6.17% was the largest calculation result obtained but had the smallest accuracy value of 93.83%.
Table 4. Soil pH sensor test results in the morning
No | Time | Soil pH Sensor Measurement | 4in1Soil Survey Instrument Measurement | Difference | Error (%) | Accuracy (%) |
1 | 07.00 | 6.43 | 6.8 | 0.37 | 5.44 | 94.56 |
2 | 07.10 | 6.43 | 6.8 | 0.37 | 5.44 | 94.56 |
3 | 07.20 | 6.41 | 6.8 | 0.29 | 4.26 | 95.74 |
4 | 07.30 | 6.51 | 6.9 | 0.39 | 5.65 | 94.35 |
5 | 07.40 | 6.38 | 6.8 | 0.42 | 6.17 | 93.83 |
6 | 07.50 | 6.60 | 6.9 | 0.30 | 4.34 | 95.66 |
7 | 08.00 | 6.57 | 6.9 | 0.33 | 4.78 | 95.22 |
8 | 08.10 | 6.45 | 6.8 | 0.35 | 5.14 | 94.86 |
9 | 08.20 | 6.62 | 6.9 | 0.28 | 4.05 | 95.95 |
10 | 08.30 | 6.45 | 6.8 | 0.35 | 5.14 | 94.86 |
11 | 08.40 | 6.51 | 6.9 | 0.39 | 5.65 | 94.35 |
12 | 08.50 | 6.65 | 6.9 | 0.25 | 3.62 | 96.38 |
13 | 09.00 | 6.68 | 6.9 | 0.22 | 3.18 | 96.82 |
14 | 09.10 | 6.62 | 6.9 | 0.28 | 4.05 | 95.95 |
15 | 09.20 | 6.70 | 7.0 | 0.30 | 4.28 | 95.72 |
16 | 09.30 | 6.67 | 6.9 | 0.23 | 3.33 | 96.67 |
17 | 09.40 | 6.68 | 6.9 | 0.22 | 3.18 | 96.82 |
18 | 09.50 | 6.67 | 6.9 | 0.23 | 3.33 | 96.67 |
19 | 10.00 | 6.68 | 6.9 | 0.22 | 3.18 | 96.82 |
Average | 0.30 | 4.43 | 95.96 |
Table 5 soil pH sensor test results carried out in the afternoon obtained an average error of 10.04% and an accuracy rate of 89.96%. At the time of the study at 15.00 and 15.50 there was a percentage difference in temperature measurement of 0.52 and an error of 7.76% was the smallest calculation result obtained but had the largest accuracy value of 92.24%. At 17.40 and 17.50 there was a percentage difference in temperature measurement of 0.86 and an error of 13.03% was the largest calculation result obtained but had the smallest accuracy value of 86.97%.
Table 5. Soil pH sensor test results in the afternoon
No | Time | Soil pH Sensor Measurement | 4in1Soil Survey Instrument Measurement | Difference | Error (%) | Accuracy (%) |
1 | 15.00 | 6.18 | 6.7 | 0.52 | 7.76 | 92.24 |
2 | 15.10 | 6.16 | 6.7 | 0.54 | 8.05 | 91.95 |
3 | 15.20 | 6.13 | 6.7 | 0.57 | 8.50 | 91.50 |
4 | 15.30 | 6.16 | 6.7 | 0.54 | 8.05 | 91.95 |
5 | 15.40 | 6.16 | 6.7 | 0.54 | 8.05 | 91.95 |
6 | 15.50 | 6.18 | 6.7 | 0.52 | 7.76 | 92.24 |
7 | 16.00 | 6.25 | 6.8 | 0.55 | 8.08 | 91.92 |
8 | 16.10 | 6.05 | 6.7 | 0.65 | 9.70 | 90.30 |
9 | 16.20 | 5.90 | 6.6 | 0.70 | 10.60 | 89.40 |
10 | 16.30 | 6.00 | 6.6 | 0.60 | 9.09 | 90.91 |
11 | 16.40 | 5.90 | 6.6 | 0.70 | 10.60 | 89.40 |
12 | 16.50 | 5.92 | 6.6 | 0.68 | 10.30 | 89.70 |
13 | 17. 00 | 5.90 | 6.6 | 0.70 | 10.60 | 89.40 |
14 | 17.10 | 5.86 | 6.6 | 0.74 | 11.21 | 88.79 |
15 | 17.20 | 5.82 | 6.6 | 0.78 | 11.81 | 88.19 |
16 | 17.30 | 5.79 | 6.6 | 0.81 | 12.27 | 87.73 |
17 | 17. 40 | 5.74 | 6.6 | 0.86 | 13.03 | 86.97 |
18 | 17.50 | 5.74 | 6.6 | 0.86 | 13.03 | 86.97 |
19 | 18.00 | 5.79 | 6.6 | 0.81 | 12.27 | 87.73 |
Average | 0.66 | 10.04 | 89.96 |
- Testing Uploads to ThingSpeak Website
This test is carried out to ensure that the readings from the DS18B20 temperature sensor and soil pH sensor can be sent to the ThingSpeak website properly. The test results of uploading sensor data to the ThingSpeak website can be seen in Figure 6.
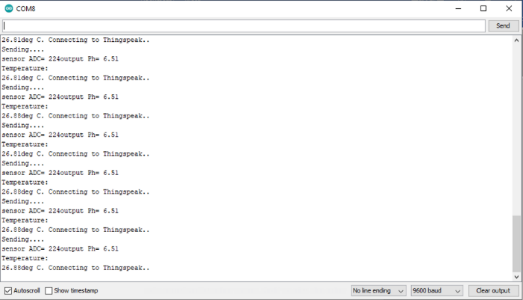
Figure 6. Test results upload to ThingSpeak website
- ThingSpeak Website Display Testing
This test aims to ensure that the reading results from the DS18B20 temperature sensor and soil pH sensor can be properly displayed and accessed through the ThingSpeak website. The ThingSpeak website display is in the form of data in the form of graphs, charts and numeric displays of each soil temperature and pH measurement parameters. The system connects with the ESP8266 NodeMCU device until it connects to the ThingSpeak API application obtained from the channel settings. The system will access the SSID and password data connected to the internet network before processing the data. Display the results on the ThingSpeak website as in Figure 7 and Figure 8.
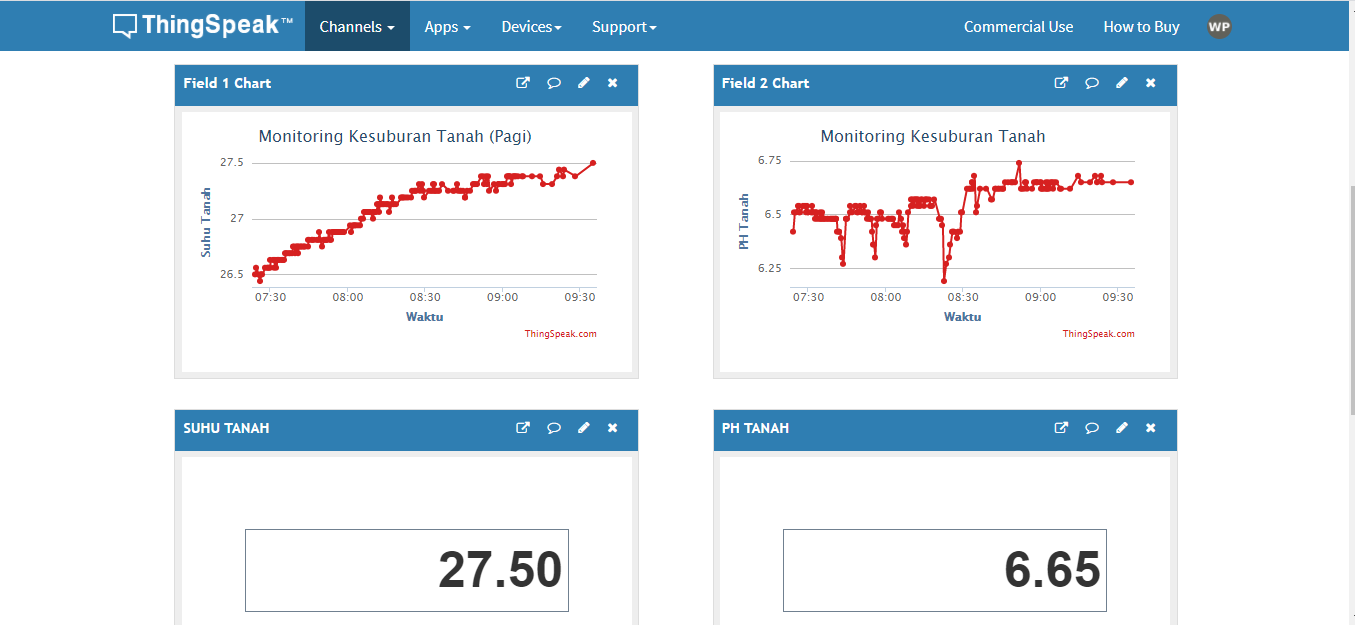
Figure 7. Display results on ThingSpeak monitoring website in the morning
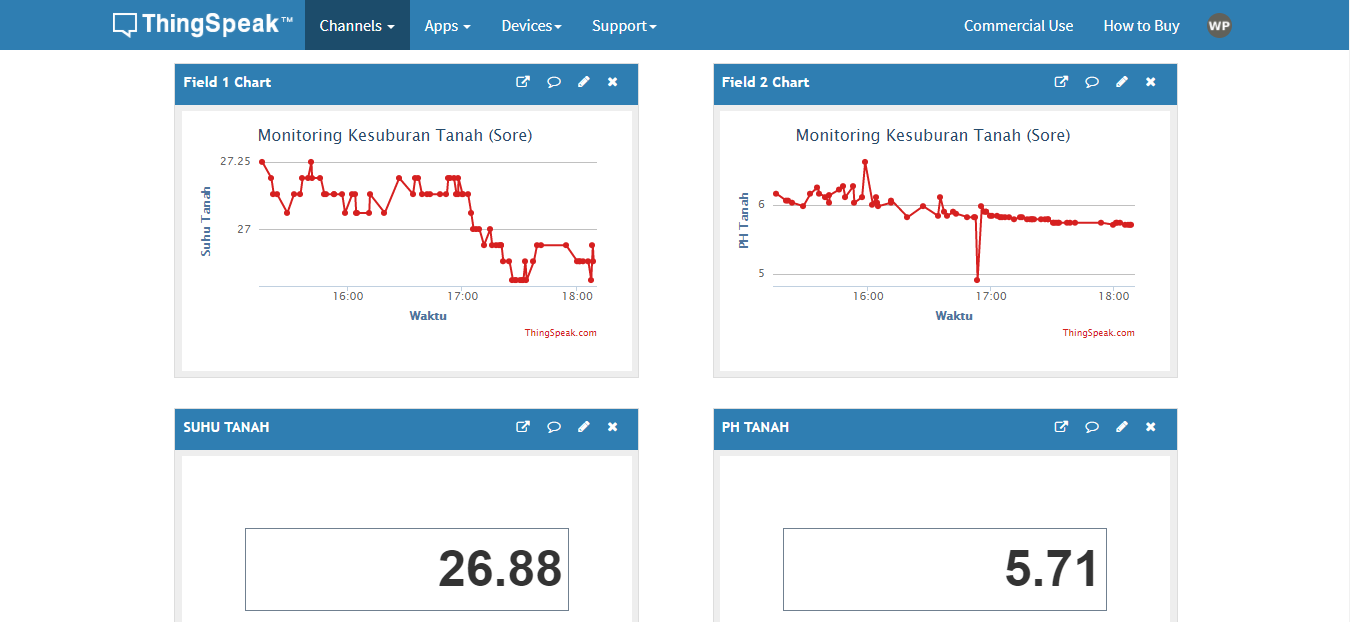
Figure 8. Display results on ThingSpeak monitoring website in the afternoon
- Soil Fertility Mapping with ArcGIS
Soil fertility mapping is made based on the results of soil temperature and pH measurements on chili fields in Srikayangan Village by grouping into two classes. Each class is then scored to identify soil fertility which can be seen in Table 6. From the results of soil fertility measurements that have been carried out, there are good soil fertility and bad soil fertility. Therefore, the score for soil fertility in Srikayangan Village is illustrated in Table 7. The results of mapping the fertility of paddy fields with dark red color (score = 1) are described as an ugly fertility rate with a percentage of 10%. While the dark green color (score = 2) is described as a good fertility rate with a percentage of 90% of the number of samples measured. Peta soil fertility in Srikayangan Village can be seen in Figure 9.
Table 6. Soil fertility classification
Class | Color | Sensor Value | Shoes |
Soil Temperature | Soil pH |
Good Soil Fertility |
| 24-28˚C | 5.5-6.8 pH | 2 |
Poor Soil Fertility | 
| < 24°C or > 28°C | < 24°C or > 28°C | 1 |
Table 7. Soil fertility score
IN | Shape | Soil Samples | Soil Fertility | Shoes |
0 | Proving | 1 | Good | 2 |
1 | Proving | 2 | Good | 2 |
2 | Proving | 3 | Good | 2 |
3 | Proving | 4 | Good | 2 |
4 | Proving | 5 | Good | 2 |
5 | Proving | 6 | Good | 2 |
6 | Proving | 7 | Good | 2 |
7 | Proving | 8 | Good | 2 |
8 | Proving | 9 | Good | 2 |
9 | Proving | 10 | Signs | 1 |
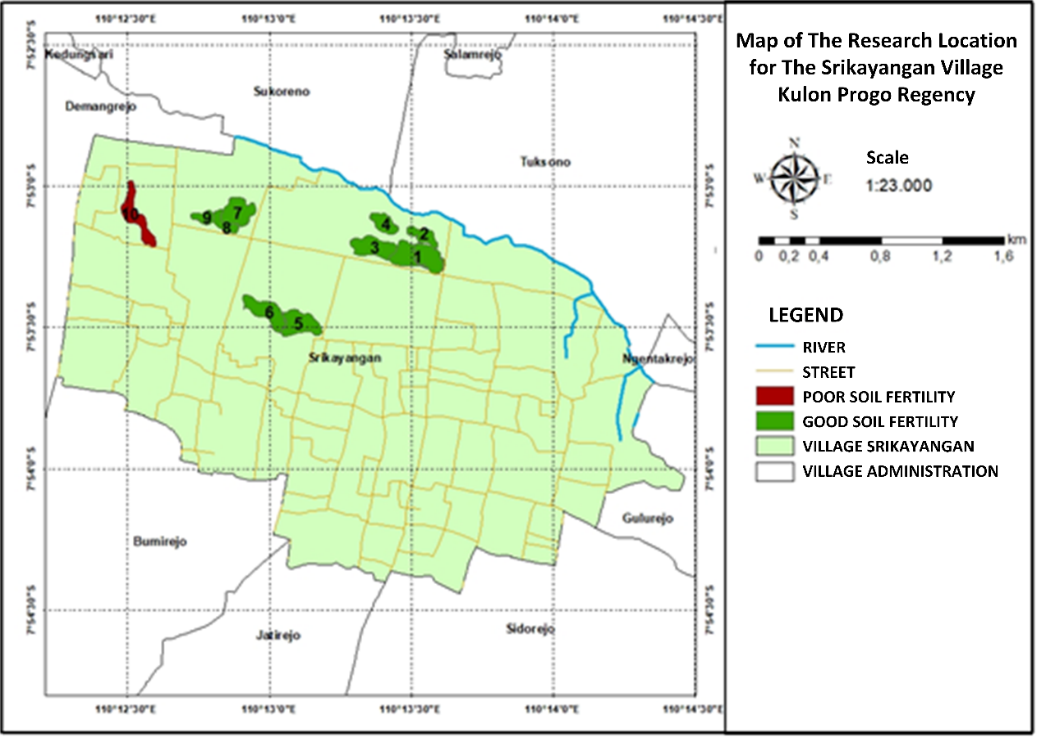
Figure 9. Map of soil fertility in Srikayangan village
- CONCLUSION
In the results that have been obtained in the test, the system can run well marked by the results of monitoring the temperature and pH of the soil can be displayed through the ThingSpeak website and the 20x4 LCD. The results of the system test conducted in the morning obtained a temperature accuracy of 95.36% and a pH accuracy of 95.96%. Meanwhile, the results of system testing conducted in the afternoon obtained a temperature accuracy of 94.36% and a pH accuracy of 89.96%. Mapping the fertility of paddy fields on chili plants in Srikayangan Village with the Geographical Information System (GIS) was successfully made to conduct an analysis in rice fields with good and bad soil fertility.
ACKNOWLEDGEMENT
Thank you to all the reviewers and editors for all the suggestions and input that have helped in the process of publishing this manuscript. A thank you also to those who have supported this research and provided moral and material assistance.
REFERENCES
[1] C. Karmokar, J. Hasan, S. Arefin Khan and M. I. Ibne Alam, "Arduino UNO based Smart Irrigation System using GSM Module, Soil Moisture Sensor, Sun Tracking System and Inverter," 2018 International Conference on Innovations in Science, Engineering and Technology (ICISET), pp. 98-101, 2018, https://doi.org/10.1109/ICISET.2018.8745597.
[2] I. R. Hapsoh, D. Salbiah, and M. Saputra, "Amount of applications biofertilizer and biological control agents (Beauveria bassiana Vuill) on growth and yield of red chili (Capsicum annuum L.)," In IOP Conference Series: Earth and Environmental Science, vol. 782, no. 4, p. 042033, 2021, https://doi.org/10.1088/1755-1315/782/4/042033.
[3] A. H. Hidayat and D. Putra, "The Design of Temperature and Soil Humidity Control with Fuzzy Method on Greenhouse for Red Chilli Pepper Seedling," JOIV: International Journal on Informatics Visualization, vol. 3, no. 3, pp. 243-247, 2019, http://dx.doi.org/10.30630/joiv.3.3.168.
[4] D. Saputra, "Soil Moisture Control and Monitoring System Prototype Using the Internet of Things Network Based on Arduino Via Telegram Application," bit-Tech, vol. 3, no. 2, pp. 51-58, 2020, https://doi.org/10.32877/bt.v3i2.189.
[5] W. Eka Sari, E. Junirianto, and G. Fatur Perdana, "Internet of Things (IoT)-Based PH, Humidity, and Temperature Measurement System," Bul. Ilm. Sarj. Tech. Electro, vol. 3, no. 1, p. 72, 2021, https://doi.org/10.12928/biste.v3i1.3214.
[6] S. Budiyanto, L. M. Silalahi, A. Adriansyah, U. Darusalam, S. Andryana and A. D. Rochendi, "Development of Internet of Things Based Fertigation System for Improving Productivity of Patchouli Plantation," 2021 3rd International Conference on Research and Academic Community Services (ICRACOS), pp. 230-233, 2021, https://doi.org/10.1109/ICRACOS53680.2021.9702053.
[7] S. Suhag, N. Singh, S. Jadaun, P. Johri, A. Shukla and N. Parashar, "IoT based Soil Nutrition and Plant Disease Detection System for Smart Agriculture," 2021 10th IEEE International Conference on Communication Systems and Network Technologies (CSNT), pp. 478-483, 2021, https://doi.org/10.1109/CSNT51715.2021.9509719.
[8] R. K. Jain, B. Gupta, M. Ansari and P. P. Ray, "IOT Enabled Smart Drip Irrigation System Using Web/Android Applications," 2020 11th International Conference on Computing, Communication and Networking Technologies (ICCCNT), pp. 1-6, 2020, https://doi.org/10.1109/ICCCNT49239.2020.9225345.
[9] A. Rahmatulloh, F. M. S. Nursuwars, I. Darmawan and G. Febrizki, "Applied Internet of Things (IoT): The Prototype Bus Passenger Monitoring System Using PIR Sensor," 2020 8th International Conference on Information and Communication Technology (ICoICT), pp. 1-6, 2020, https://doi.org/10.1109/ICoICT49345.2020.9166420.
[10] N. S. Abu et al., "Internet of Things Applications in Precision Agriculture: A Review," Journal of Robotics and Control (JRC), vol. 3, no. 3, pp. 338-347, 2020, https://doi.org/10.18196/jrc.v3i3.14159.
[11] J. J. I. Haban, J. C. V. Puno, A. A. Bandala, R. Kerwin Billones, E. P. Dadios and E. Sybingco, "Soil Fertilizer Recommendation System using Fuzzy Logic," 2020 IEEE REGION 10 CONFERENCE (TENCON), pp. 1171-1175, 2020, https://doi.org/10.1109/TENCON50793.2020.9293780.
[12] E. Camci, D. R. Kripalani, L. Ma, E. Kayacan, and M. A. Khanesar, "An aerial robot for rice farm quality inspection with type-2 fuzzy neural networks tuned by particle swarm optimization-sliding mode control hybrid algorithm," Swarm and evolutionary computation, vol. 41, pp. 1-8, 2018, https://doi.org/10.1016/j.swevo.2017.10.003.
[13] D. Indri, "Framework Design IoT for Smart Agriculture," Jurnal Sistem Cerdas, vol. 4, no. 1, pp. 1-8, 2021, https://doi.org/10.37396/jsc.v4i1.90.
[14] R. Gunawan, T. Andhika, and F. Hibatulloh, "Internet of Things-Based Monitoring System for Soil Moisture, Temperature, pH and Automatic Watering of Tomato Plants," J. Telekontran, vol. 7, no. 1, pp. 66–78, 2019, https://doi.org/10.34010/telekontran.v7i1.1640.
[15] S. Sabzi, Y. Abbaspour-Gilandeh, and G. Garcia-Mateos, "A fast and accurate expert system for weed identification in potato crops using metaheuristic algorithms," Computers in Industry, vol. 98, pp. 80-89, 2018, https://doi.org/10.1016/j.compind.2018.03.001.
[16] H. Pan, J. Liang, Y. Zhao, and F. Li, "Facing the 3rd national land survey (cultivated land quality): soil survey application for soil texture detection based on the high-definition field soil images by using perceptual hashing algorithm (pHash)," Journal of Soils and Sediments, vol. 20, no. 9, pp. 3427-3441, 2020, https://doi.org/10.1007/s11368-020-02657-5.
[17] K. T. Falih, A. J. Mohammed and A. S. Hasan, "A GIS-based Network Analysis for Truck Vehicles in Baghdad's City Road Network," 2022 International Congress on Human-Computer Interaction, Optimization and Robotic Applications (HORA), pp. 1-5, 2022, https://doi.org/10.1109/HORA55278.2022.9800095.
[18] B. Zhang and D. J. Hu, "Research on the construction and simulation of PO-Dijkstra algorithm model in parallel network of multicore platform," EURASIP Journal on Wireless Communications and Networking, vol. 2020, no. 1, pp. 1-14, 2020, https://doi.org/10.1186/s13638-020-01680-x.
[19] A. Yudhana, D. Sulistyo, and I. Mufandi, "GIS-based and Naïve Bayes for nitrogen soil mapping in Lendah, Indonesia," Sensing and Bio-Sensing Research, vol. 33, p. 100435, 2021, https://doi.org/10.1016/j.sbsr.2021.100435.
[20] Y. Chen, B. Zheng, and Y. Hu, "Mapping Local Climate Zones Using ArcGIS-Based Method and Exploring Land Surface Temperature Characteristics in Chenzhou, China," Sustainability, vol. 12, no. 7, p. 2974, 2020, https://doi.org/10.3390/su12072974.
AUTHOR BIOGRAPHY

| Wahyu Prawoto completed his undergraduate education in the Department of Electrical Engineering at Universitas Ahmad Dahlan in 2021.
|
|
|

| Anton Yudhana, S.T., M.T., Ph.D. is a Lecturer at the Department of Electrical Engineering, Faculty of Industrial Technology, Universitas Ahmad Dahlan, Yogyakarta, Indonesia. |
|
|
Chili Plants Soil Fertility Monitoring System Based on Internet of Things (IoT) (Wahyu Prawoto)