ISSN: 2685-9572 Buletin Ilmiah Sarjana Teknik Elektro
Vol. 8, No. 5, October 2026, pp. 1644-1658
Sensitivity-Guided Distributed Generation Planning for Improved Voltage Performance in Distribution Networks
Trieu Ngoc Ton
Faculty of Electrical and Electronics Engineering, Thu Duc College of Technology, Ho Chi Minh City, Vietnam
ARTICLE INFORMATION |
| ABSTRACT |
Article History: Received 23 July 2026 Revised 17 October 2026 Accepted 29 October 2026 |
| 
Optimal distributed generation (DG) planning is essential for reducing power losses and improving voltage performance in radial distribution networks (DNs). This paper proposes a voltage vulnerability sensitivity index (VVSI)-guided particle swarm optimization (PSO) framework for optimal DG placement and sizing. The VVSI quantifies local steady-state voltage sensitivity to small active-power injection variations and is integrated into both candidate-bus screening and the composite optimization objective. An adaptive penalty mechanism is employed to handle network operating constraints. The proposed framework is evaluated on the 33-bus and 69-bus radial DNs and compared with conventional PSO and genetic algorithm (GA) approaches. For the 33-bus system, active power loss decreases from 210.98 to 98.45 kW (53.3%), the minimum voltage improves from 0.903 to 0.967 p.u., and normalized VVSI decreases from 1.00 to 0.51. For the 69-bus system, power loss decreases from 224.90 to 85.30 kW (62.1%), the minimum voltage improves from 0.909 to 0.972 p.u., and normalized VVSI decreases to 0.48. The results demonstrate improved network efficiency, voltage profiles, and local steady-state voltage sensitivity under the investigated operating conditions. The proposed framework provides a sensitivity-informed approach to DG planning without modifying the conventional PSO update mechanism. |
Keywords: Distribution Networks; Distributed Generation; Voltage Sensitivity; Particle Swarm Optimization; Optimal Placement And Sizing; Radial Distribution Networks |
Corresponding Author: Trieu Ngoc Ton, aculty of Electrical and Electronics Engineering, Thu Duc College of Technology, Ho Chi Minh City, Vietnam. Email: tonngoctrieu@gmail.com |
This work is open access under a Creative Commons Attribution-Share Alike 4.0 
|
Document Citation: T. N. Ton, “Sensitivity-Guided Distributed Generation Planning for Improved Voltage Performance in Distribution Networks,” Buletin Ilmiah Sarjana Teknik Elektro, vol. 8, no. 5, pp. 1644-1658, 2026, DOI: 10.12928/biste.v8i5.17538. |
INTRODUCTION
The rapid expansion of distributed generation (DG), particularly from renewable sources, is transforming the operational characteristics of distribution networks (DNs) [1][2]. These systems are no longer passive but must accommodate variable generation, bidirectional power flows, and increased uncertainty. Consequently, optimal DG placement and sizing have become essential for reducing power losses and improving voltage profiles in DNs [3][4]. Proper allocation of DG units can significantly improve DN performance by reducing active power losses and enhancing voltage profiles. Recent studies have investigated machine learning-based approaches for identifying suitable DG locations and improving network performance, including evaluations on IEEE 33-bus and 69-bus DNs [5][6]. However, inappropriate DG placement and sizing may adversely affect network operating conditions, including increased power losses and unacceptable voltage deviations. Therefore, determining suitable DG locations and capacities remains an important challenge in DN planning [7][8].
Existing DG planning studies are commonly formulated as optimization problems in which power loss reduction, voltage-profile improvement, and economic performance are used as primary objectives [9][10]. Although these criteria are effective for evaluating nominal operating conditions, they provide limited information about how strongly individual buses respond to small changes in power injection [11][12]. Consequently, two DG configurations with similar losses and voltage magnitudes may exhibit different levels of electrical vulnerability when the operating point is perturbed [13][14]. In addition, most metaheuristic approaches explore candidate buses with limited use of network-specific electrical information, which may lead to unnecessary search effort and weak physical interpretability [14][15]. These limitations indicate the need for a DG planning framework that explicitly identifies electrically weak buses and incorporates their sensitivity characteristics into both the optimization objective and the search process [16][17]. In particular, buses exhibiting pronounced voltage responses can be regarded as electrically weak locations [18][19]. Recent voltage-stability-based DG planning studies have demonstrated that identifying such critical buses can effectively guide DG siting and sizing while improving voltage stability and reducing network losses [20]. Recent developments in sensitivity-assisted DG planning have demonstrated the benefits of integrating electrical sensitivity indices with metaheuristic optimization algorithms [21][22]. For example, sensitivity-guided ant lion optimization has been investigated to determine suitable DG locations and capacities while improving network operating performance [18],[23]. Similarly, sensitivity indices combined with hippopotamus optimization have been employed to minimize active power losses in radial DNs [24][25]. Other studies have employed Particle Swarm Optimization (PSO) and related optimization techniques to improve DG allocation and voltage performance [25][26]. These approaches demonstrate the growing importance of incorporating electrical characteristics into optimization-based DG planning. Conventional PSO and genetic algorithms (GA) [27] are widely used for DG placement and sizing. PSO employs swarm-based learning, whereas GA uses evolutionary operators to explore candidate solutions. Both algorithms are selected as benchmarks for evaluating the proposed VVSI-guided PSO framework. Nevertheless, the specific role of local voltage sensitivity in both candidate-bus selection and the composite optimization objective requires further investigation.
Recent studies have extended DG planning beyond loss minimization to include reactive-power compensation, feeder reconfiguration, and electric-vehicle charging. Sahay et al. investigated the coordinated allocation of DG units, capacitors, and EV charging stations, while other studies optimized photovoltaic DG and capacitor placement to improve network performance [28]. These studies highlight the need to account for interactions among different network assets when evaluating DG installation decisions. Another research direction addresses multiple operating criteria and time-varying conditions. Multiobjective planning has considered photovoltaic hosting capacity (HC), voltage deviation, and network losses together with demand response [29]. Studies incorporating solar irradiance, temperature, and load variations further show that the quality of a DG allocation depends on the operating conditions used for evaluation [30][31]. Stochastic planning with demand flexibility and dynamic DG allocation combined with feeder reconfiguration have also been investigated [32][33]. Such developments provide valuable context but do not, by themselves, quantify the local active-power-to-voltage sensitivity used in the present study.
Operational feasibility is also essential when selecting DG locations and capacities. Recent research has investigated hybrid photovoltaic DG and voltage-support devices with protection-related considerations [34], while uncertainty-aware DG allocation has examined the effects of variable renewable generation and demand [35][36]. Other approaches incorporate Volt/VAR control and demand response to increase DG - HC [37][38]. These findings highlight the need to distinguish steady-state voltage sensitivity from dynamic voltage resilience in DG planning. Conventional P–V, Q–V, L-index, and voltage stability indices primarily assess voltage stability margins, while Jacobian-based methods quantify voltage responses through linearized power-flow equations. In contrast, the proposed VVSI measures local steady-state voltage sensitivity to small active-power injection perturbations. Its main contribution lies in integrating this sensitivity information into both candidate-bus screening and the composite optimization objective, enabling sensitivity-guided DG placement and sizing. A voltage vulnerability sensitivity index (VVSI) is developed to quantify the relationship between active-power injection perturbations and the corresponding voltage variations at individual buses [39][40]. This index is not only used as an evaluation metric but also plays a role in shaping the optimization process. Specifically, the search space is restructured by prioritizing buses with higher sensitivity, allowing the optimization to focus on electrically critical regions [41][42]. The DG allocation problem is formulated as a composite objective that accounts for power loss, voltage deviation, and system sensitivity. A particle swarm optimization (PSO) algorithm is employed as a solution engine [43], while the proposed framework guides the search process using system-level information derived from VVSI. In this way, the optimization becomes problem-aware rather than purely stochastic.
The proposed framework is evaluated on the IEEE 33-bus and 69-bus radial DNs under steady-state conditions. Its main contribution is the dual integration of VVSI into candidate-bus screening and the composite objective function, combining sensitivity-guided selection with PSO-based optimization. Ablation comparisons assess the contributions of these components. Future work will consider time-varying loads, renewable uncertainty, and network disturbances to further evaluate the framework's applicability. The main contributions of this paper are summarized as follows:
- A voltage vulnerability sensitivity index (VVSI) is formulated to identify electrically vulnerable buses based on local steady-state voltage sensitivity.
- VVSI is integrated into candidate-bus screening and the composite objective function to improve DG placement and sizing.
- A VVSI-guided PSO framework with adaptive penalty handling optimizes DG locations and capacities under voltage, branch-current, and penetration constraints.
- Simulations on the IEEE 33-bus and 69-bus networks demonstrate reductions in power losses, voltage deviations, and VVSI, along with improved minimum bus voltages.
PROBLEM FORMULATION
The optimal planning of DG in a radial DN is formulated as a constrained mixed discrete-continuous optimization problem. The decision variables include the installation buses and corresponding active-power capacities of the DG units. For each candidate solution, an AC power-flow calculation is performed to determine bus voltages, branch currents, and network power losses [44].
The optimization seeks a DG configuration that simultaneously reduces active power loss, improves the voltage profile, and decreases the voltage vulnerability of the network [45][46]. To achieve this, a composite objective function is constructed by combining normalized power-loss, voltage-deviation, and voltage-sensitivity terms together with a penalty component for operating-constraint violations [47]. The objective is to minimize a composite performance function given by:
| 
| (1) |
| 
| (2) |
where  represents a candidate DG allocation scheme. The composite objective consists of three normalized components: active power loss, average voltage deviation, and system-level VVSI, together with a penalty term for constraint violations. The weighting coefficients
 ,
 , and
 determine the relative importance of these objectives and satisfy
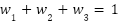 . The objective weights are set to 0.40, 0.30, and 0.30 for power loss, voltage deviation, and VVSI, respectively, prioritizing loss reduction while balancing voltage performance. Each component is normalized by its base-case value to ensure comparability, while a penalty term handles constraint violations. Network operation is modeled using the steady-state AC power-flow equations. For each bus
 , the active and reactive power balance are expressed as:
| 
| (3) |
| 
| (4) |
The AC power-flow equations enforce the active- and reactive-power balance at each bus and provide the physical link between DG planning decisions and the resulting network operating state. For each candidate solution, these equations are solved to determine bus voltages, branch power flows, and network losses. The total active power loss is computed over all network branches as:
| 
| (5) |
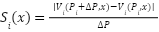
Which reflects the dissipation associated with power transfer across the network. To quantify the electrical vulnerability of each bus, a VVSI is introduced based on the local voltage response to a small active-power perturbation. For each bus, a small variation in active-power injection is applied while the remaining operating conditions are maintained, and the corresponding change in voltage magnitude is evaluated using the AC power-flow model:
| 
| (6) |
The resulting sensitivity reflects the local voltage–power relationship around the operating point. A higher VVSI indicates greater voltage variation under small active-power perturbations, suggesting weaker voltage support. Conversely, a lower VVSI indicates a more stable local voltage response. Thus, VVSI provides a physically interpretable indicator for identifying electrically vulnerable buses in DNs.
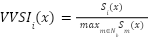
To enable consistent comparison across buses, the sensitivity values are normalized as:
| 
| (7) |
The normalized VVSI serves two purposes: ranking candidate DG buses based on local voltage sensitivity and evaluating system-level sensitivity relative to the base case (VVSI = 1.00). The aggregated VVSI is incorporated into the composite objective alongside power loss and voltage deviation, while bus-level VVSI guides candidate selection. This dual integration constitutes the main methodological contribution. VVSI evaluates steady-state voltage responses to small active-power perturbations, with operational constraints ensuring feasible DG configurations.
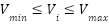
- The voltage magnitude at each bus must remain within allowable limits:
| 
| (8) |
where  is the voltage magnitude at bus i, while
 and
 denote the permissible lower and upper voltage limits, respectively.
- The current in each branch is constrained by its thermal rating:
| 
| (9) |
where  denotes the current magnitude of branch l, and
 represents its allowable thermal limit. This constraint prevents candidate DG configurations from causing branch overloading.
- The active-power capacity of each DG unit is bounded by its prescribed minimum and maximum limits:
| 
| (10) |
where  denotes the active-power output of the DG unit installed at bus i. In this study, the DG units are modeled as photovoltaic sources operating at unity power factor; therefore, reactive-power injection from DG is not considered.
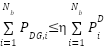
- In addition, the total DG penetration is constrained to prevent excessive power injection and maintain realistic network operating conditions:
| 
| (11) |
where denotes the active-power capacity of the DG unit installed at bus i, and  represents the total active-power demand of the network. The maximum total DG penetration is limited to 60% of the system load to avoid excessive power injection and maintain realistic network operating conditions.
- Constraint violations are handled using a penalty function defined as:
| 
| (12) |
where  and denote the numbers of buses and branches, respectively; Vi and represent the voltage magnitude at bus and the current magnitude in branch l; , , and ,max are the corresponding operating limits; and
 = 0.6 is the maximum DG penetration ratio. The penalty function applies nonnegative squared penalties to violations of voltage, branch-current, and DG penetration constraints. Feasible solutions receive zero penalty, while the penalty coefficient increases progressively to strengthen constraint enforcement near convergence. Overall, the proposed formulation integrates power-loss reduction, voltage-profile improvement, and VVSI minimization into a unified DG planning framework while considering network operating constraints.
METHODS
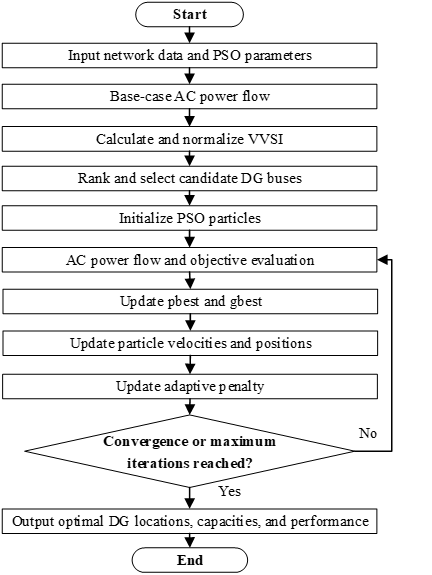
To solve the formulated DG planning problem, a sensitivity-guided particle swarm optimization (PSO) [26],[48] framework is developed. The proposed framework integrates conventional PSO with voltage sensitivity information to identify electrically vulnerable buses. Following base-case AC power-flow analysis, VVSI values are calculated, normalized, and ranked to select suitable DG candidate locations. PSO then optimizes DG placement and sizing within the reduced search space without modifying its conventional update equations.
Each PSO particle represents a candidate DG configuration with discrete installation buses and continuous DG capacities [39]. DG locations are mapped to VVSI-screened candidate buses, while capacities are restricted to their allowable limits. Duplicate locations are repaired before evaluation. AC power-flow analysis is performed to calculate power loss, minimum voltage, voltage deviation, and normalized VVSI. The composite objective is then evaluated with constraint penalties, followed by updates of the personal-best and global-best solutions. The particle velocities and positions are updated according to the standard PSO equations:
| 
| (13) |
where  and
 denote the velocity and position of particle at iteration k, respectively;
 is the inertia weight;
 and
 are the cognitive and social acceleration coefficients;
 and
 are uniformly distributed random numbers in [0,1]; and
 and
 denote the personal-best and global-best solutions, respectively.
Since DG allocation involves discrete locations and continuous capacities, particle positions are mapped to valid VVSI-screened buses and bounded DG capacities. Duplicate locations are eliminated, and each feasible configuration is evaluated using AC power-flow analysis and operating constraints.
To improve constraint handling, the penalty coefficient is adaptively increased with the iteration number:
| 
| (14) |
where  denotes the penalty coefficient at iteration
 ,
 is the initial penalty coefficient, and
 is the penalty growth factor. The adaptive penalty mechanism progressively increases the penalty coefficient during optimization, allowing greater exploration in the early iterations while strengthening constraint enforcement near convergence. Candidate solutions are evaluated against bus-voltage limits, branch-current ratings, DG capacity bounds, and the maximum penetration constraint. This mechanism discourages infeasible solutions and guides the search toward technically feasible DG configurations without altering the conventional PSO update equations. The complete procedure is summarized as follows:
- Step 1: Input the distribution-network data, DG capacity limits, operating constraints, and PSO parameters.
- Step 2: Perform the base-case AC power-flow analysis to determine the initial network operating conditions.
- Step 3: Apply small active-power perturbations at eligible buses to calculate the corresponding voltage sensitivity values.
- Step 4: Normalize the VVSI values and rank candidate buses according to their voltage sensitivity.
- Step 5: Select the highest-ranked buses to construct the candidate set for DG installation.
- Step 6: Initialize the PSO population, with each particle representing DG installation locations and corresponding capacities.
- Step 7: Perform AC power-flow analysis for each particle to calculate power losses, voltage deviations, VVSI, and constraint violations.
- Step 8: Evaluate the composite objective function and update the personal-best and global-best solutions.
- Step 9: Update particle velocities and positions using the conventional PSO equations.
- Step 10: Adjust the adaptive penalty coefficient to strengthen constraint enforcement during optimization.
- Step 11: Repeat Steps 7–10 until the maximum iteration number or stopping criterion is reached.
- Step 12: Report the optimal DG locations, capacities, and corresponding network performance indices.
The main contribution of the proposed framework is the dual integration of VVSI into candidate-bus screening and the composite optimization objective. Electrically vulnerable buses are prioritized to reduce the search space, while PSO determines suitable DG locations and capacities by considering power loss, voltage deviation, and sensitivity. The optimization procedure includes AC power-flow analysis, VVSI calculation, candidate selection, particle initialization, mixed-variable updating, and constraint handling (Figure 1). The parameters summarized in Table 1 and identical operating constraints are applied to both benchmark networks to support consistent comparisons. Thus, the methodological contribution lies in sensitivity-guided DG planning rather than modifying the conventional PSO update mechanism.
Figure 1. Flowchart of the proposed VVSI-guided PSO framework for optimal DG placement and sizing
RESULT AND DISCUSSION
The proposed VVSI-guided PSO framework is evaluated on the IEEE 33-bus and 69-bus radial DNs under steady-state operating conditions [49][50]. Photovoltaic DG units are modeled at unity power factor, and identical optimization settings and operating constraints are applied to both networks. For each candidate solution, AC power-flow analysis is performed to determine active power loss, bus-voltage profiles, branch loading, and normalized VVSI. The proposed method is compared with conventional PSO and GA to assess the benefits of sensitivity-guided DG placement and sizing. The main simulation and optimization parameters are summarized in Table 1.
All optimization methods are evaluated under identical operating conditions and constraints. The PSO employs 30 particles and 100 iterations, with the inertia weight decreasing from 0.9 to 0.4 and acceleration coefficients set to 2.0. DG penetration is limited to 60% of the total active load. Each algorithm is independently executed 30 times to assess solution consistency, with statistical comparisons performed using the Wilcoxon rank-sum test and Holm correction. These settings provide a consistent basis for evaluating the proposed framework on both benchmark networks.
Table 1. Parameter settings of the proposed optimization framework
Parameter | Value | Parameter | Value |
Swarm size | 30 | Max iterations | 100 |
Inertia weight | 0.9 to 0.4 | 
| 2.0, 2.0 |
Penalty base | 100 | Growth factor | 0.01 |
Perturbation  | 0.01 p.u. | DG units | 1–3 |
DG capacity | 0 – 1.0 p.u. | DG penetration | ≤ 60% load |
Objective weights (w1, w2, w3) | 0.40, 0.30, 0.30 | Independent runs | 30 |
- IEEE 33-Bus System
The 33-bus (Figure 2) radial DN is used to evaluate the proposed VVSI-guided DG planning framework. Its relatively high feeder impedance causes significant voltage drops and power losses, particularly at downstream buses, making it suitable for sensitivity-based DG allocation. Under the base-case conditions, active power loss is 210.98 kW and the minimum bus voltage is 0.903 p.u., providing reference values for assessing improvements after DG integration.
The proposed VVSI-guided PSO is applied to optimize DG locations and capacities in the 33-bus network. Its performance is compared with conventional PSO and GA under identical operating conditions. As summarized in Table 2, the proposed method achieves the lowest power loss, voltage deviation, and normalized VVSI, together with the highest minimum bus voltage, demonstrating the benefits of sensitivity-guided DG planning.
Table 2 demonstrates that the proposed VVSI-guided PSO outperforms conventional PSO and GA across the evaluated performance indices. Active power loss decreases from 210.98 to 98.45 kW (53.3%), while the minimum bus voltage improves from 0.903 to 0.967 p.u. The average voltage deviation decreases from 0.042 to 0.018, indicating a more uniform voltage profile. Meanwhile, normalized VVSI decreases from 1.00 to 0.51, reflecting reduced sensitivity to small active-power perturbations. These improvements indicate that the optimized DG locations and capacities enhance network efficiency, voltage support, and local steady-state voltage performance under the investigated operating conditions.
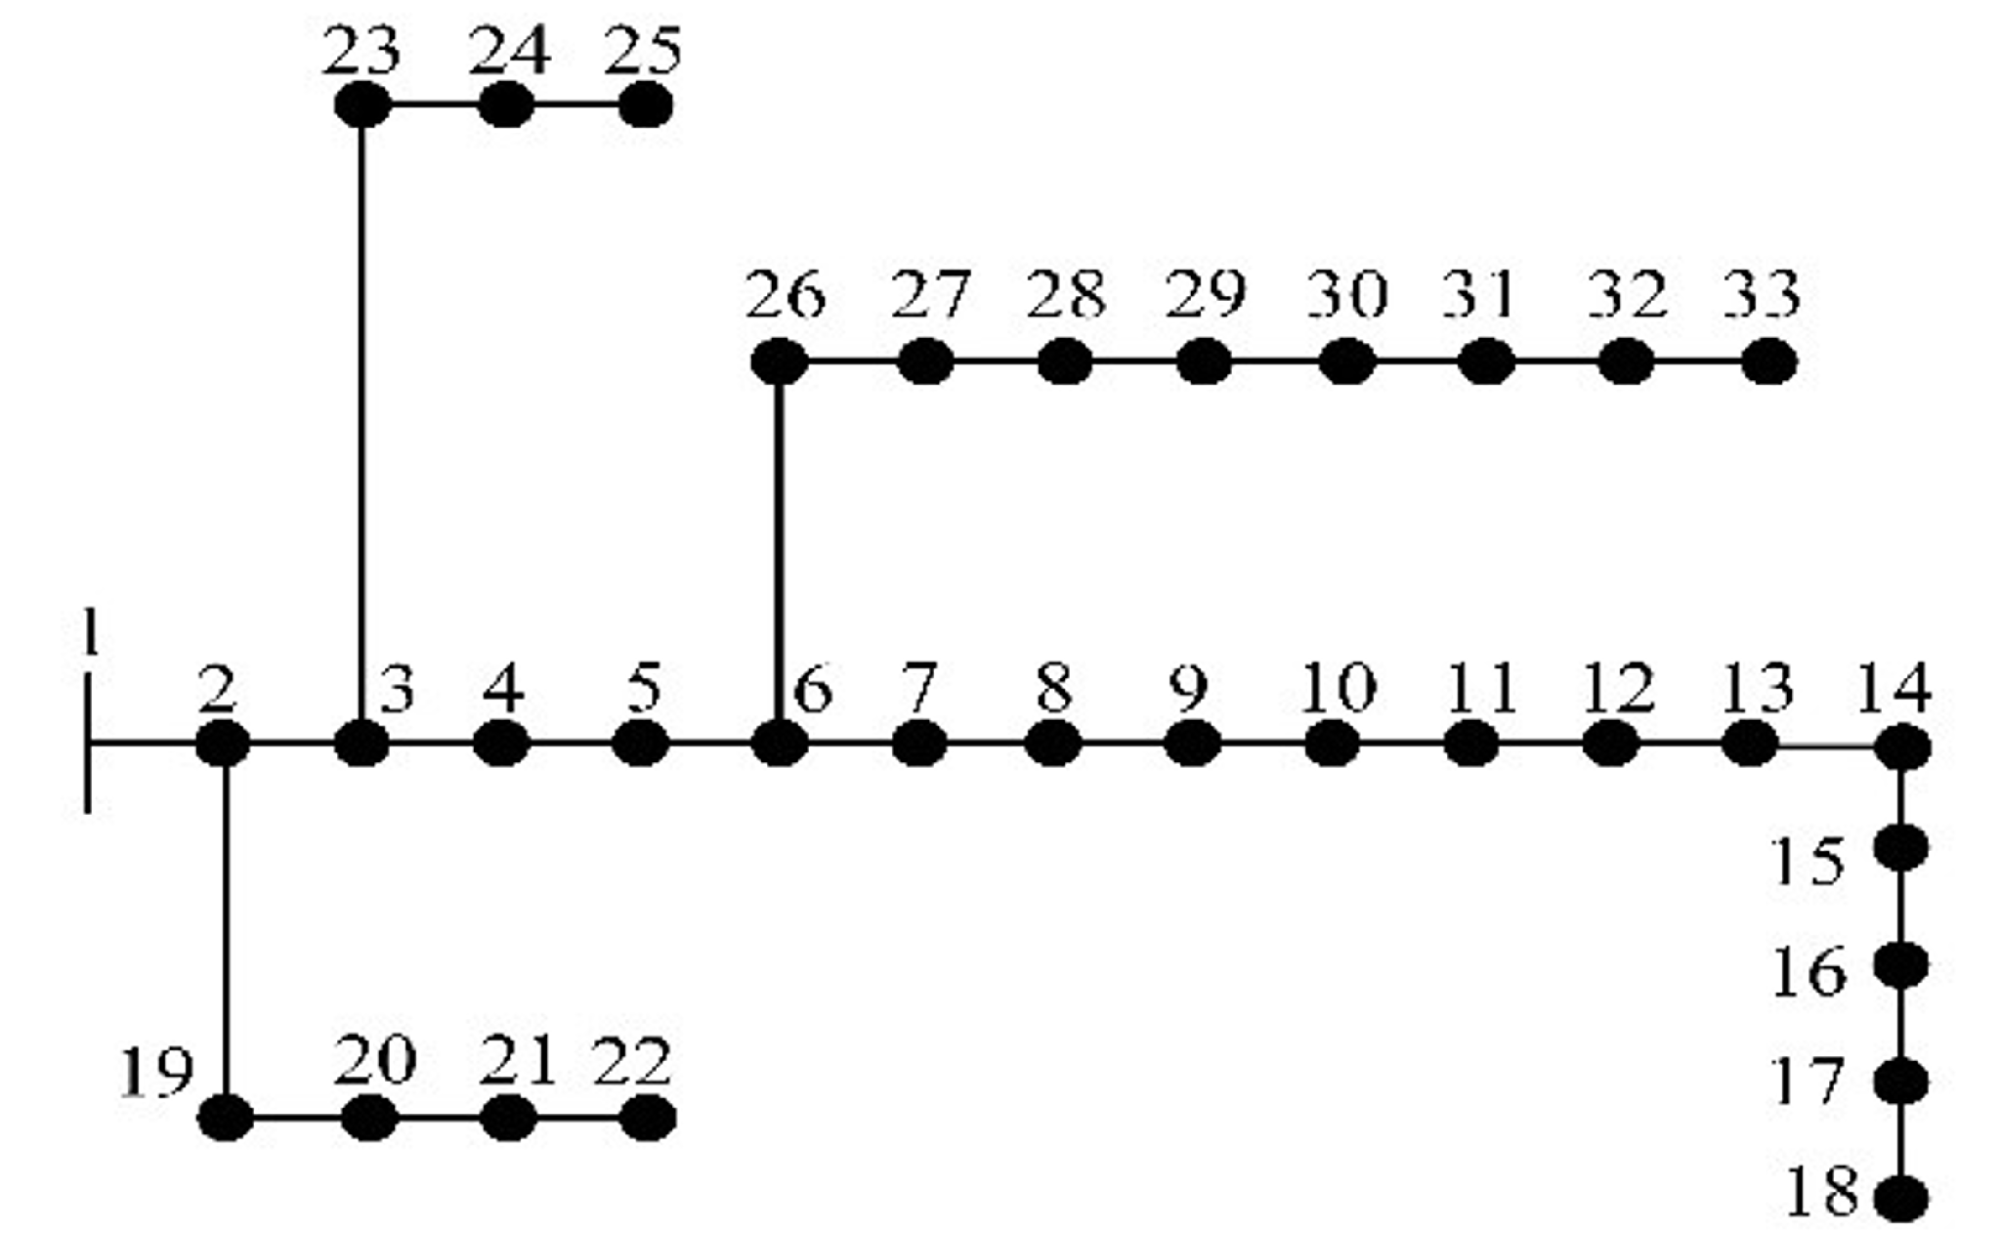
Figure 2. Single-line diagram of the IEEE 33-bus radial distribution network [49]
Table 2. Comparison of results for 33-bus system
Method | DG ocations | DG sizes (kW) |  (kW)
| (p.u.) | 
| VVSI |
Base case | – | – | 210.98 | 0.903 | 0.042 | 1 |
PSO | 7, 18, 30 | 400, 300, 450 | 110.25 | 0.955 | 0.025 | 0.72 |
GA | 6, 15, 29 | 420, 330, 480 | 105.6 | 0.96 | 0.022 | 0.65 |
Proposed | 6, 14, 30 | 450, 350, 500 | 98.45 | 0.967 | 0.018 | 0.51 |
Figure 3 compares the normalized performance indices of conventional PSO, GA, and the proposed VVSI-guided PSO for the 33-bus network. The proposed framework achieves the lowest normalized power loss, voltage deviation, and VVSI, while maintaining the highest minimum bus voltage. These results indicate that integrating voltage sensitivity into DG planning provides consistent improvements across the evaluated steady-state performance indicators.
Figure 4 presents the bus-voltage and normalized local VVSI profiles for the 33-bus network under different DG allocation methods. DG integration improves voltage profiles, particularly at downstream buses, while VVSI reveals spatial variations in voltage sensitivity. The comparison highlights the benefits of VVSI-guided DG planning in improving voltage support and reducing local steady-state voltage sensitivity. Table 3 summarizes the statistical performance of conventional PSO, GA, and the proposed VVSI-guided PSO for the IEEE 33-bus network. The proposed method achieves the lowest best and mean power losses, indicating improved solution quality and consistency across the evaluated runs.
Overall, the results demonstrate that the proposed VVSI-guided PSO improves power-loss reduction, voltage profiles, and local steady-state voltage sensitivity. These findings support the effectiveness of integrating VVSI into both candidate-bus selection and DG optimization under the investigated conditions.
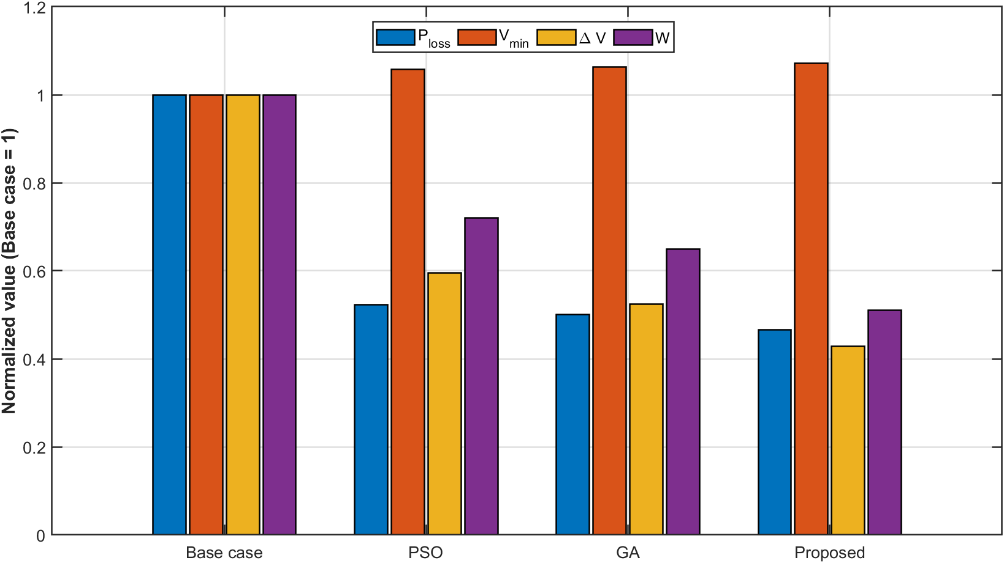
Figure 3. Comparison of normalized performance indices for the IEEE 33-bus system
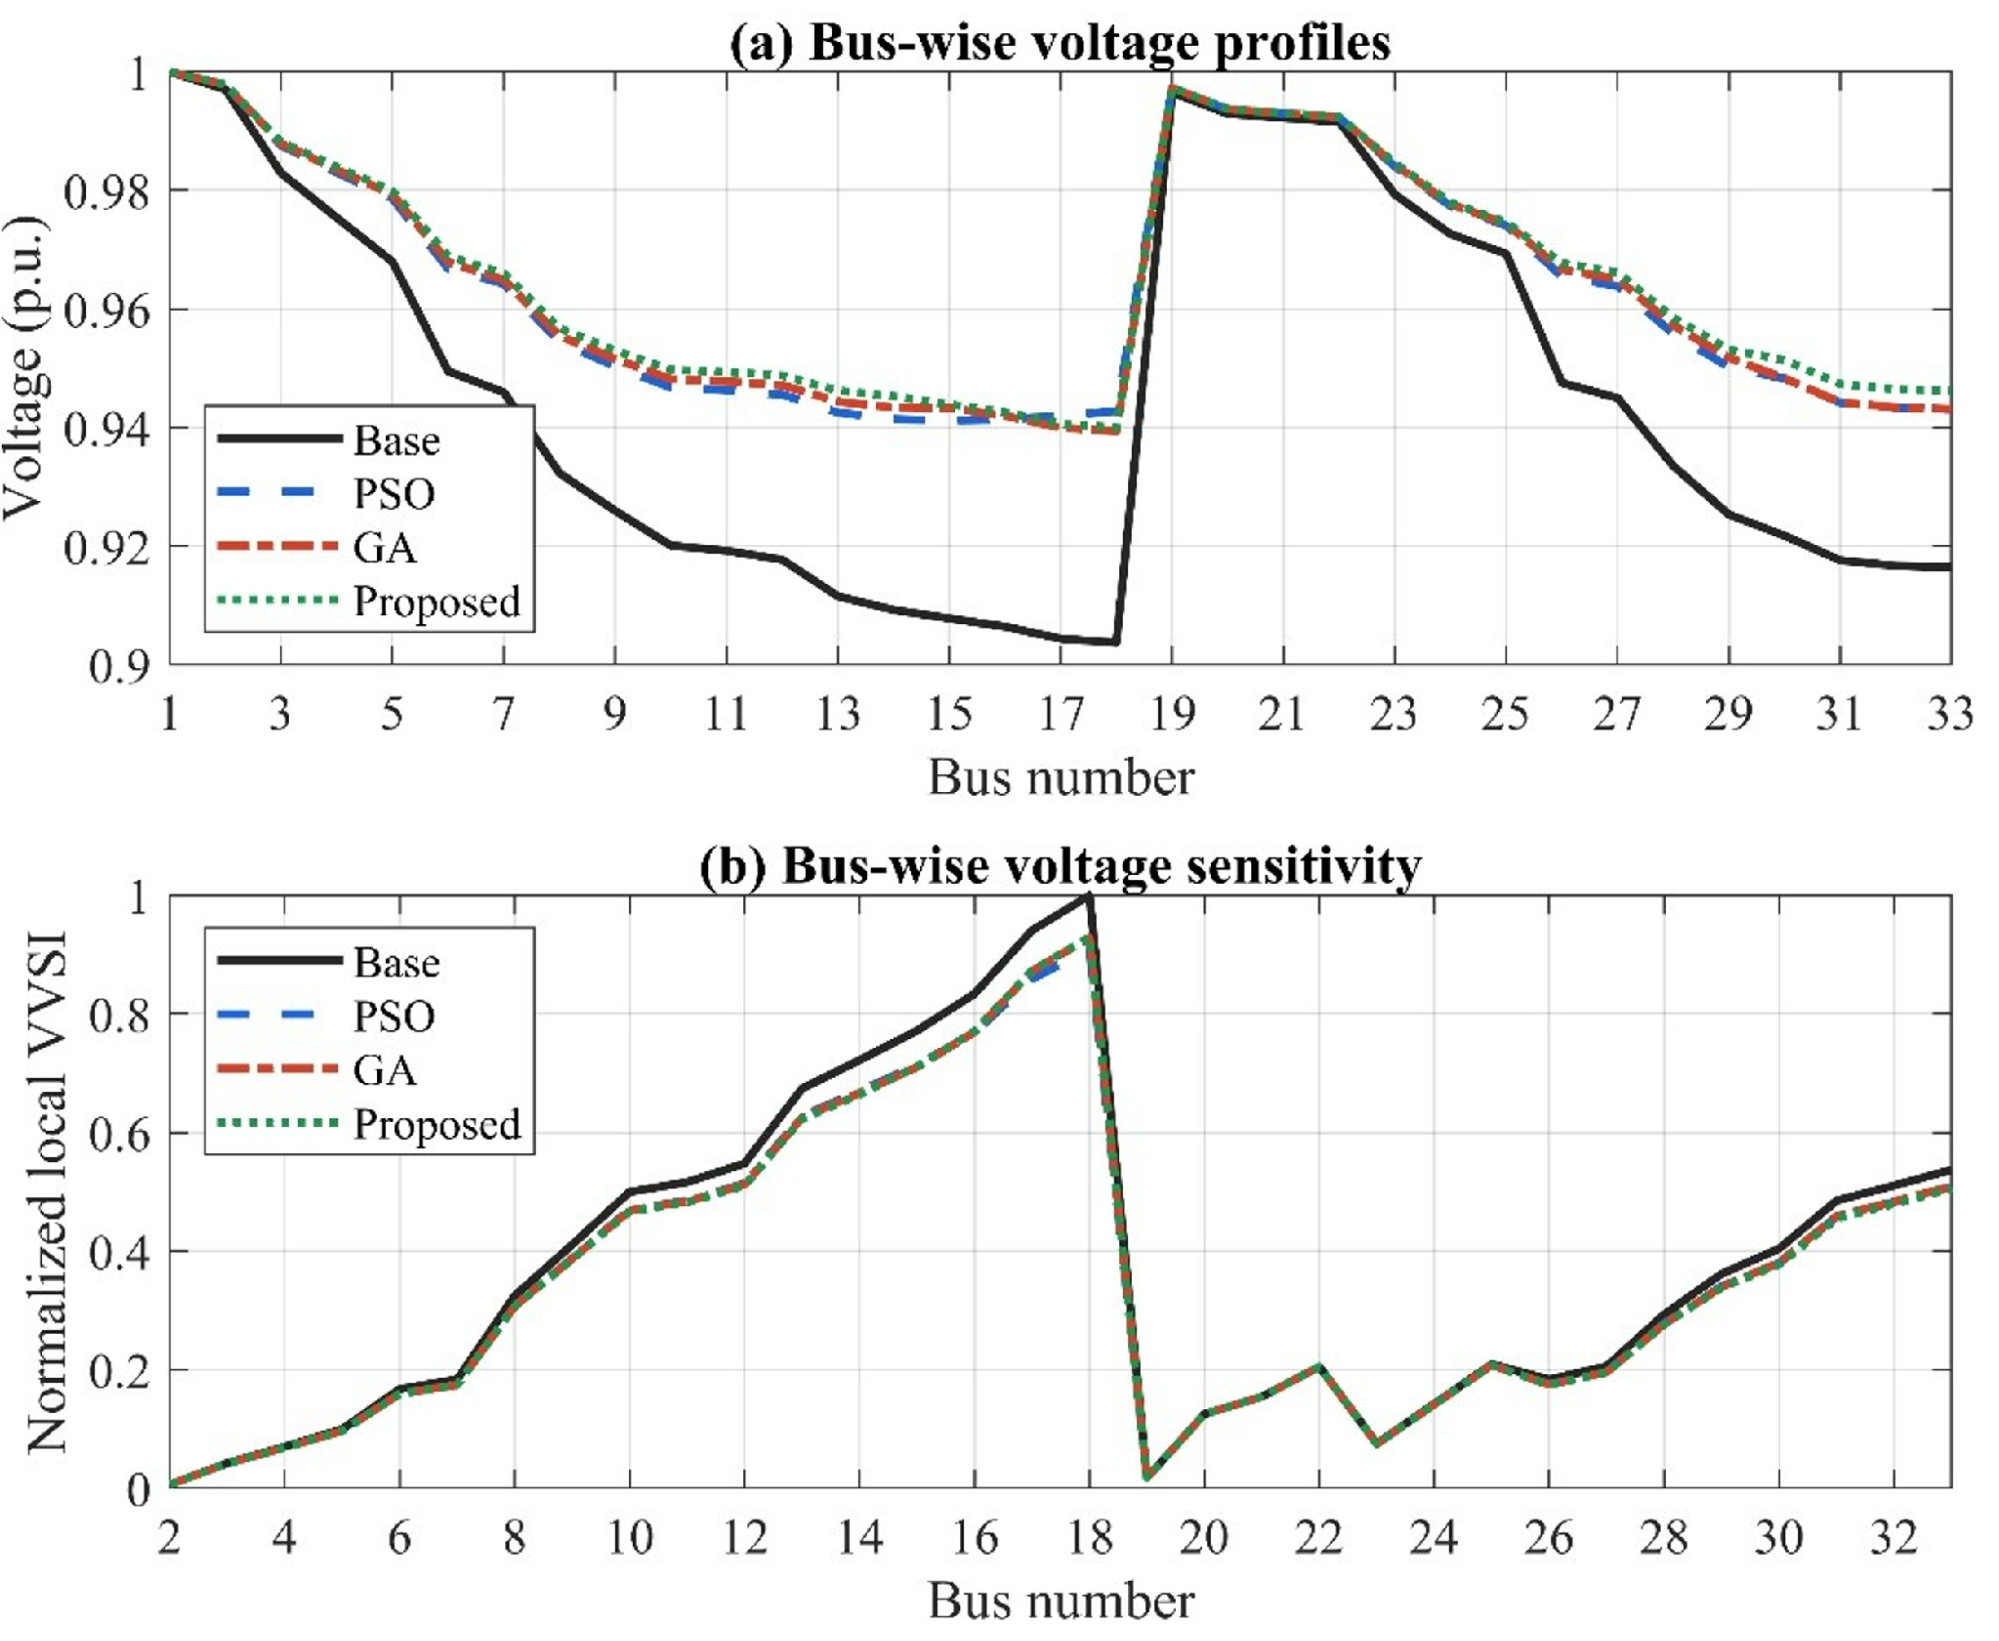
Figure 4. Bus voltage and normalized voltage sensitivity profiles for the 33-bus DN
Table 3. Statistical performance comparison for the IEEE 33-bus distribution network
Algorithm | Best | Mean | Median | Worst | SD | 95% CI |
PSO | 110.25 | 114.94 | 114.67 | 120.75 | 3.27 | 113.72–116.16 |
GA | 105.6 | 109.62 | 109.38 | 114.6 | 2.8 | 108.57–110.67 |
Proposed | 98.45 | 101.35 | 101.18 | 104.95 | 2.03 | 100.59–102.11 |
- IEEE 69-Bus System
The 69-bus radial DN is used as the second benchmark to evaluate the proposed VVSI-guided DG planning framework. Its extended feeder structure and cumulative line impedance make it suitable for assessing voltage sensitivity and DG allocation in a larger network. Under base-case conditions, active power loss is 224.90 kW and the minimum bus voltage is 0.909 p.u., indicating relatively weak downstream voltage support. Figure 5 illustrates the network topology, comprising 69 buses and 68 normally closed branches. The bus numbering and branch configuration are consistent with the power-flow simulation data, providing a basis for sensitivity-guided DG placement and sizing.
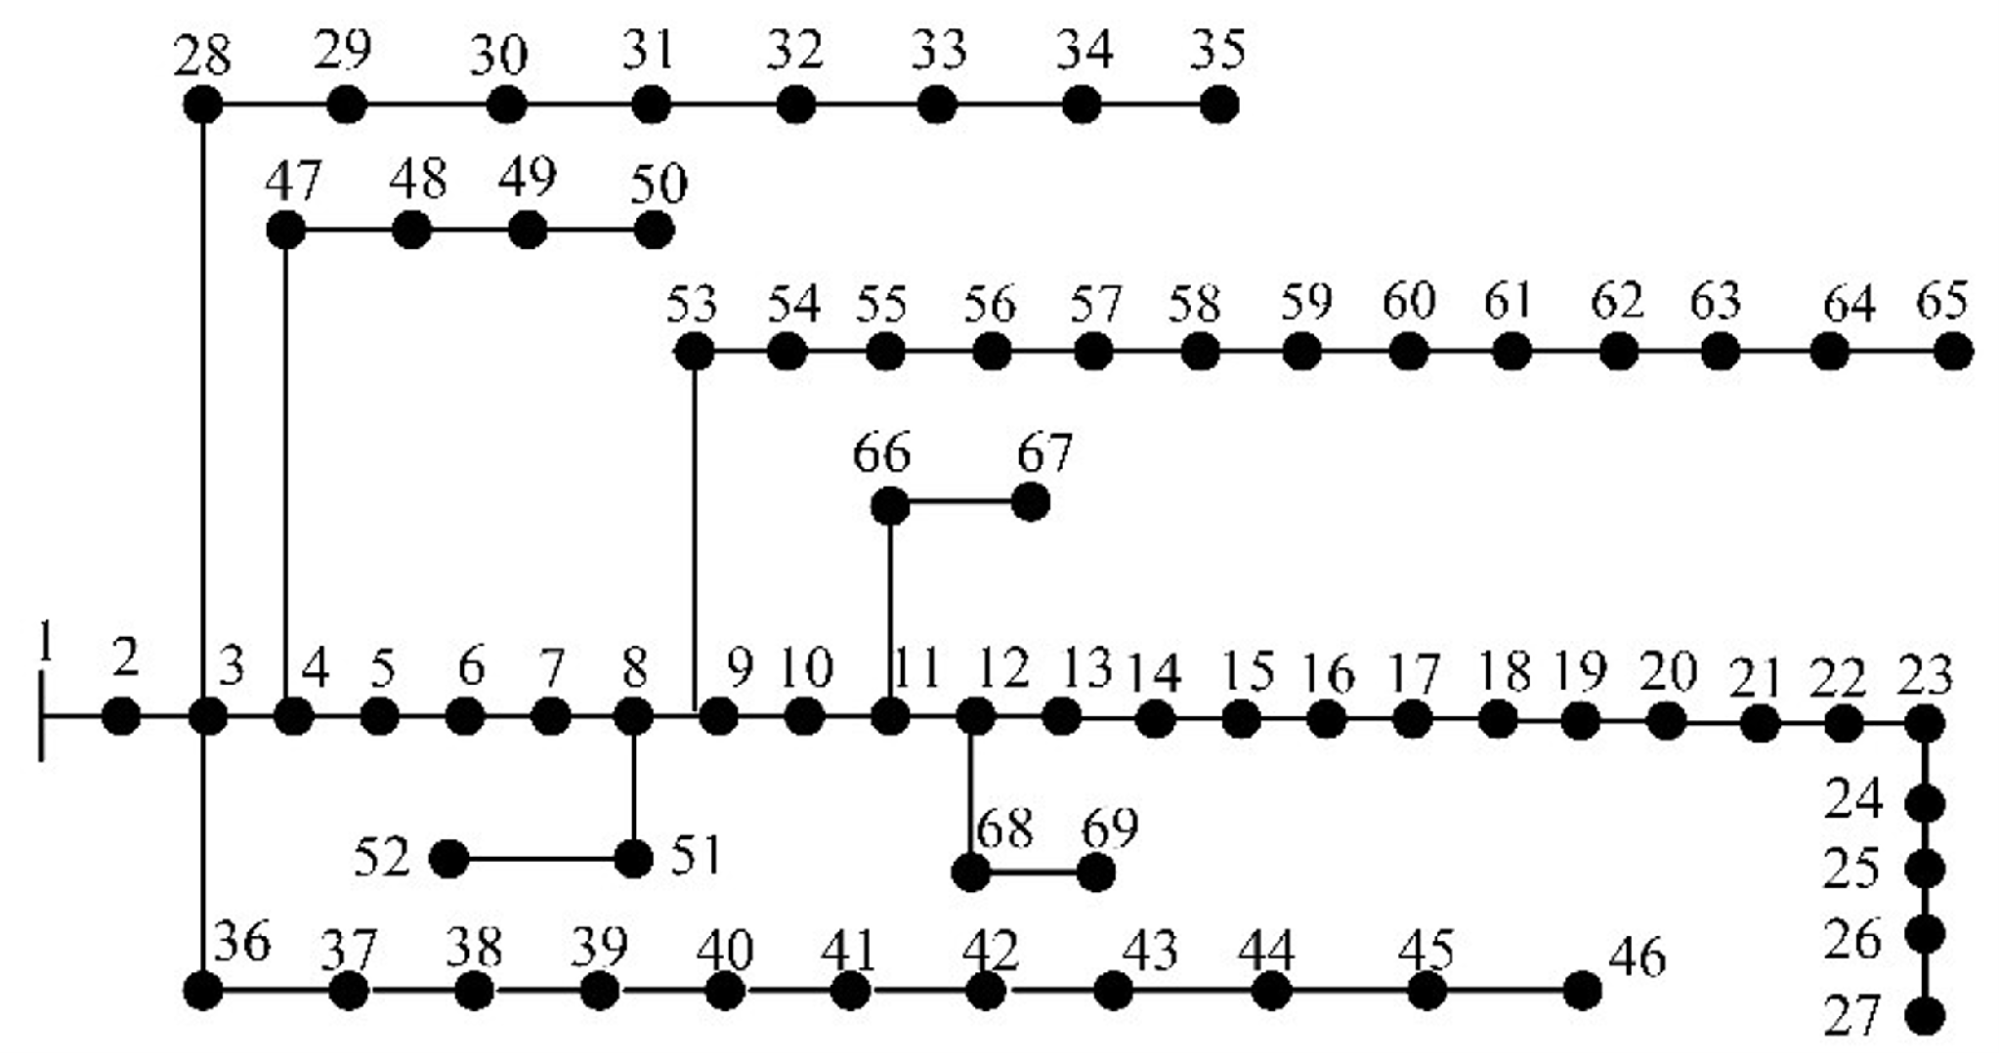
Figure 5. Single-line diagram of the IEEE 69-bus radial distribution network [49]
The proposed sensitivity-guided method is then applied to determine the optimal DG locations and capacities for the 69-bus system using the same optimization settings adopted for the 33-bus case. Using identical optimization settings for both test systems provides a consistent basis for comparing the reported numerical results, although evaluating only two benchmark networks does not establish general computational scalability. The resulting performance indices are summarized in Table 4.
Table 4 shows that the proposed VVSI-guided PSO achieves the best performance among the compared methods for the 69-bus network. Active power loss decreases from 224.90 to 85.30 kW (62.1%), while the minimum bus voltage improves from 0.909 to 0.972 p.u. The average voltage deviation decreases from 0.038 to 0.015, and normalized VVSI decreases from 1.00 to 0.48. Compared with conventional PSO and GA, the proposed framework provides improved network efficiency, voltage profiles, and local steady-state voltage sensitivity under the investigated conditions. Figure 6 compares the normalized performance indices of conventional PSO, GA, and the proposed VVSI-guided PSO for the 69-bus network. The proposed method achieves the lowest normalized power loss, voltage deviation, and VVSI, together with the highest minimum bus voltage. These results demonstrate improvements in network efficiency, voltage profiles, and local steady-state voltage sensitivity. The consistent performance across both benchmark networks supports the effectiveness of sensitivity-guided DG planning. However, further evaluation under different network configurations and operating conditions is required to establish the scalability and robustness of the proposed framework.
Table 4. Comparison of results for 69-bus system
Method | DG locations | DG sizes (kW) | (kW) | (p.u.) |
| VVSI |
Base case | – | – | 224.9 | 0.909 | 0.038 | 1 |
PSO | 11, 21, 61 | 450, 350, 500 | 98.2 | 0.961 | 0.021 | 0.68 |
GA | 10, 20, 63 | 470, 380, 520 | 92.75 | 0.965 | 0.019 | 0.61 |
Proposed | 11, 19, 61 | 500, 400, 550 | 85.3 | 0.972 | 0.015 | 0.48 |
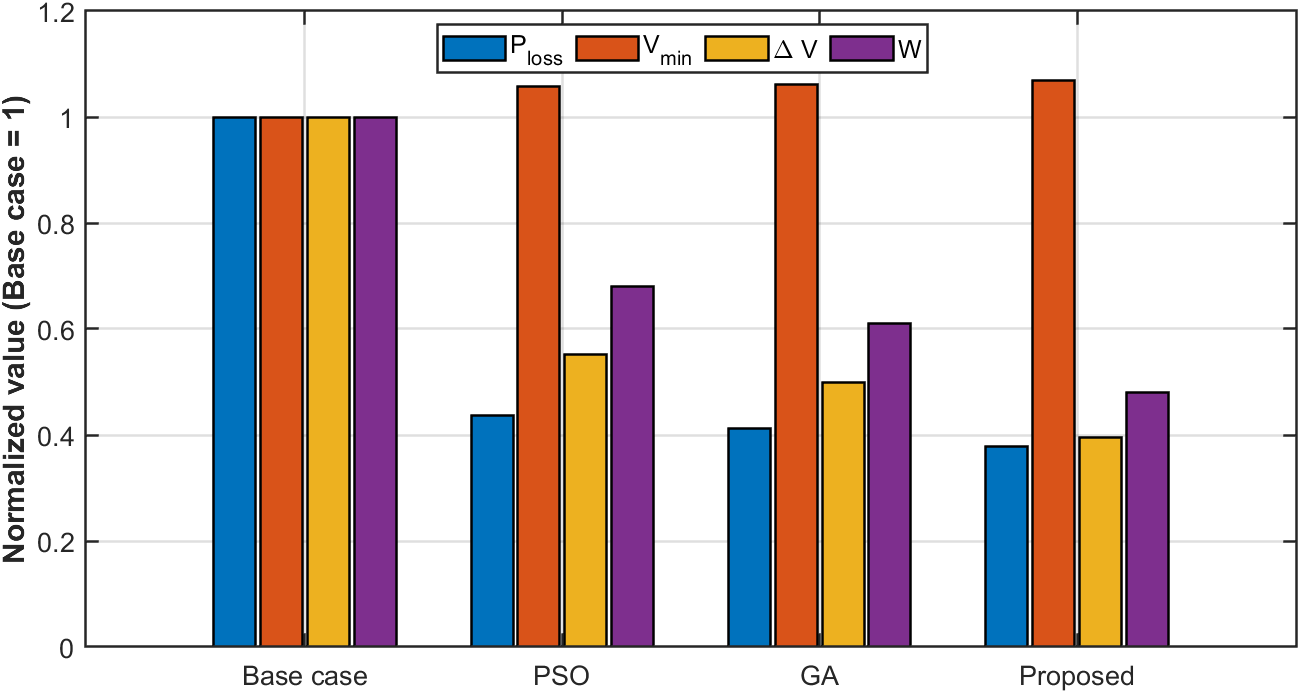
Figure 6. Comparison of normalized performance indices for the IEEE 69-bus system
Figure 7 presents the bus-wise voltage magnitude and normalized local VVSI profiles for the 69-bus DN. Compared with the 33-bus system, the longer feeder structure provides a broader range of electrical conditions for examining the spatial effects of DG allocation. The voltage profiles illustrate the influence of different DG configurations on individual bus voltages, while the VVSI profiles identify locations exhibiting relatively stronger responses to incremental active-power injections. These complementary assessments provide a more detailed interpretation of the aggregate performance indices reported in Table 4 and support the use of local voltage sensitivity as an additional criterion in DG planning. However, the findings remain limited to the investigated steady-state operating conditions.
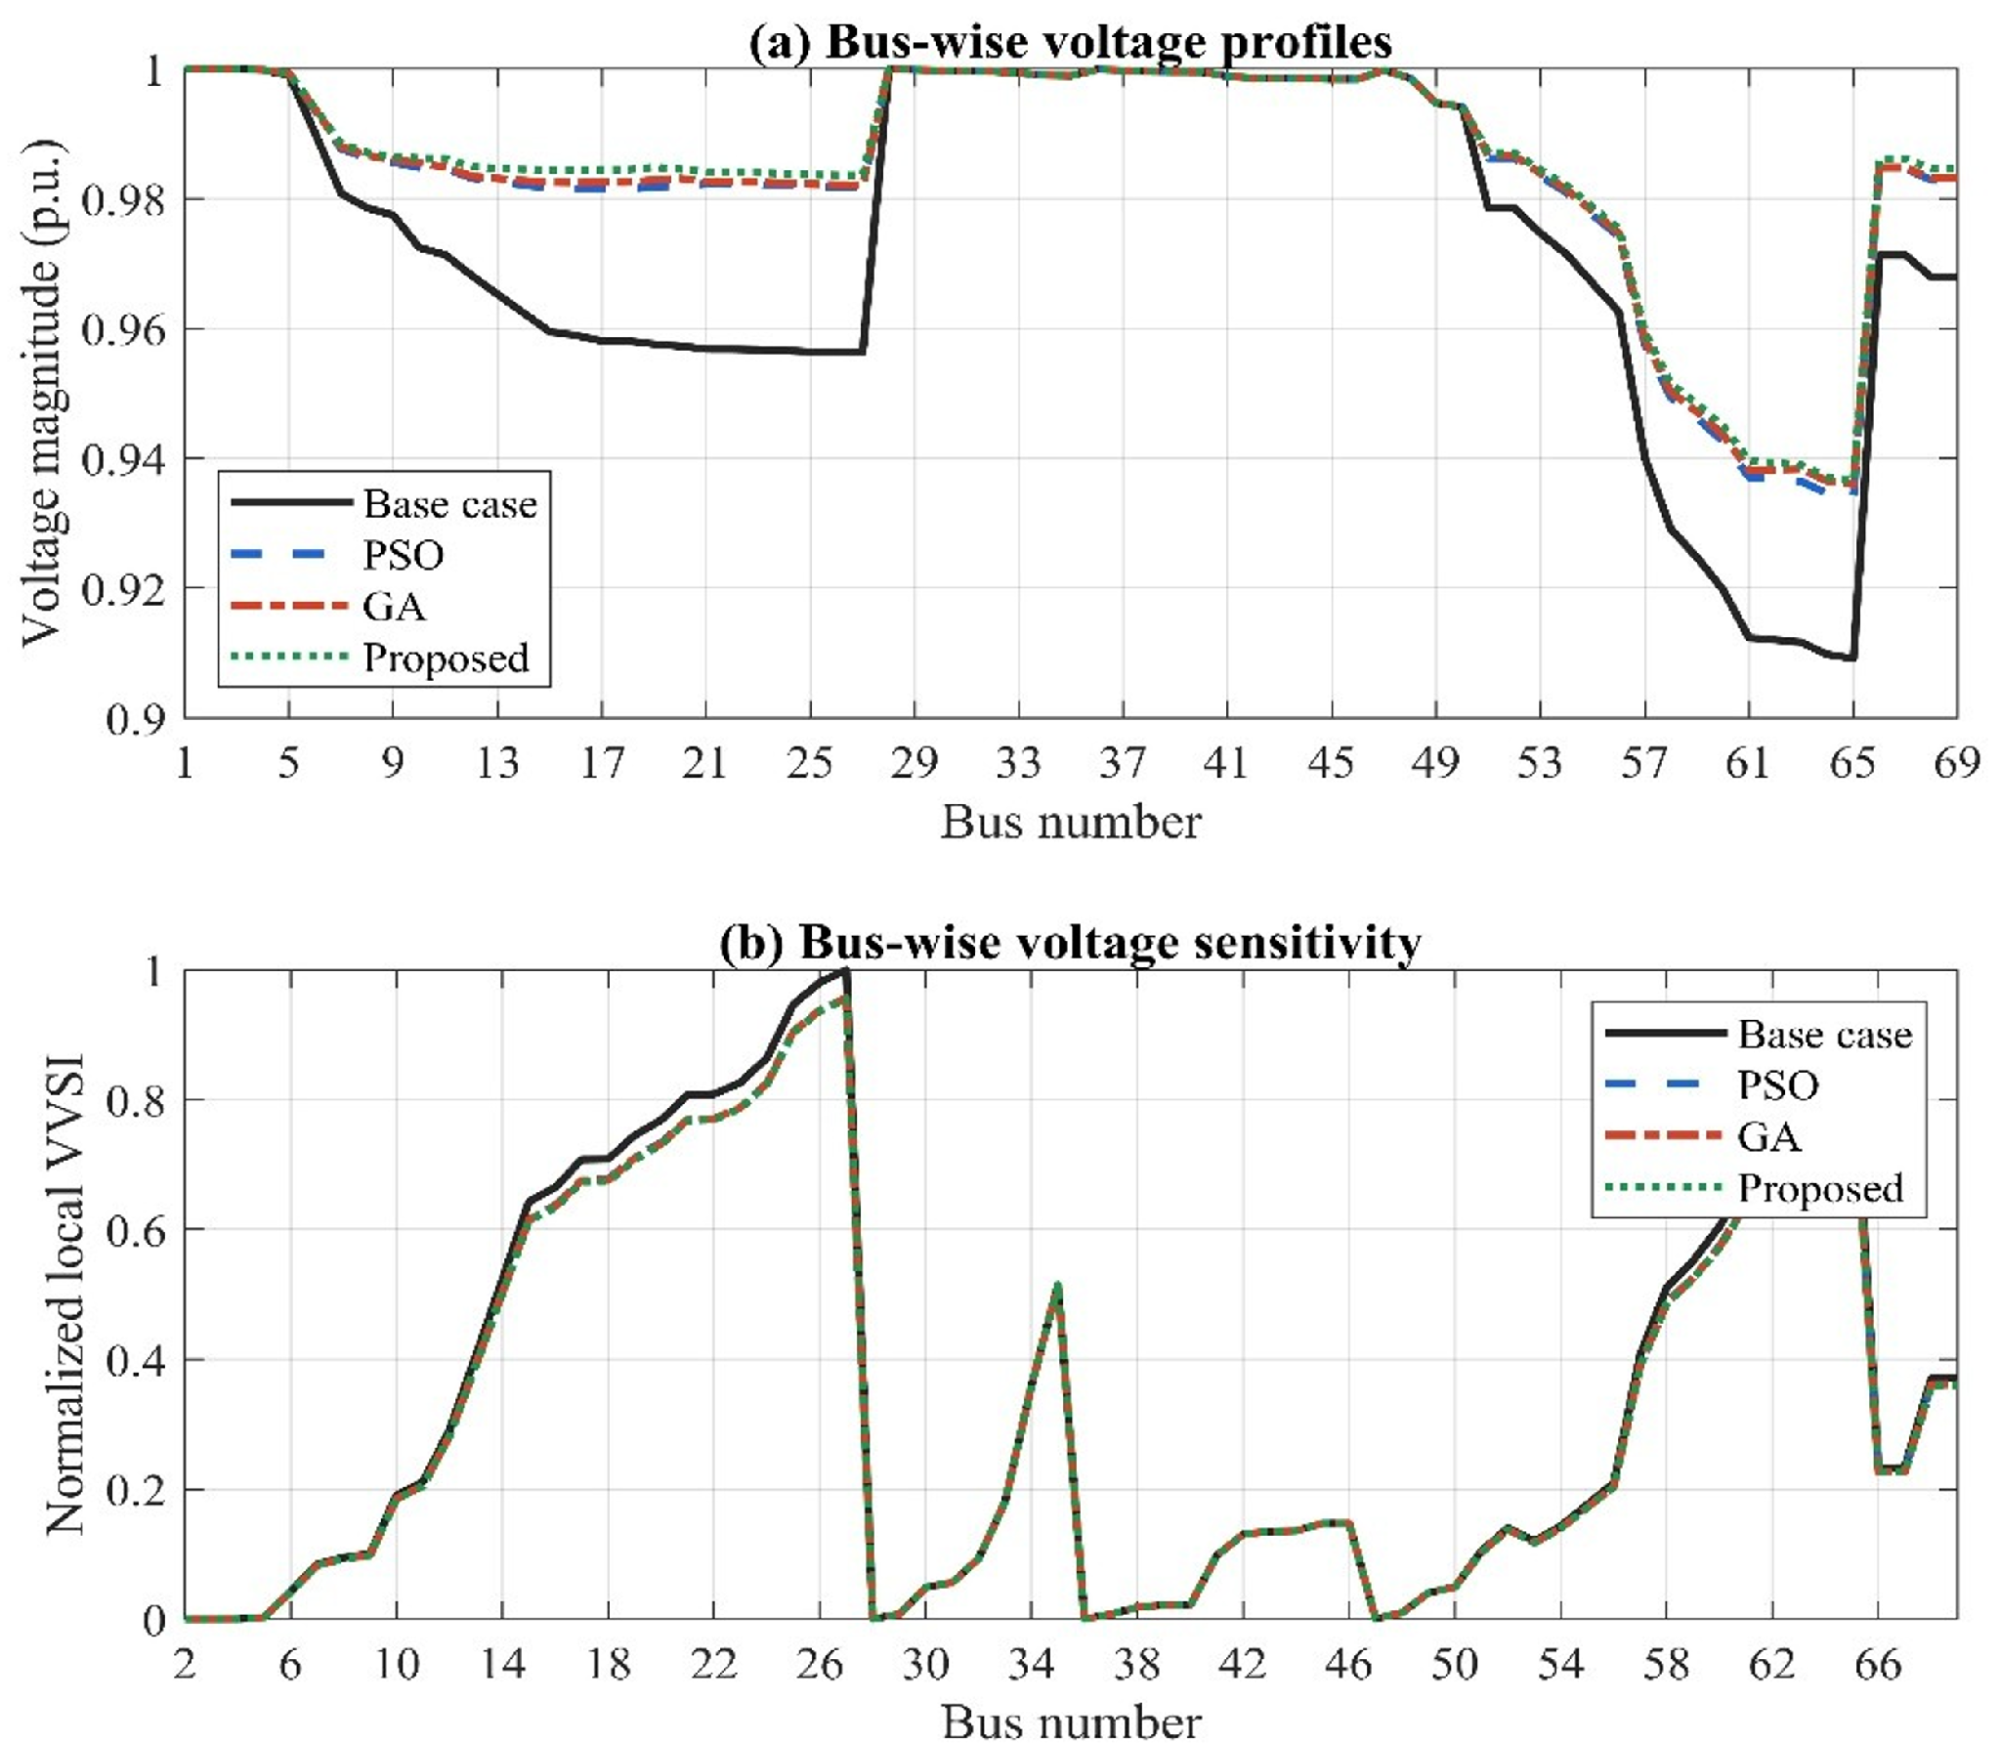
Figure 7. Bus voltage and normalized voltage sensitivity profiles for the 69-bus DN
Table 5 summarizes the statistical performance of conventional PSO, GA, and the proposed VVSI-guided PSO for the IEEE 69-bus network. The proposed method achieves the lowest best and mean power losses among the compared algorithms, indicating improved solution quality and consistency across the evaluated runs.
Overall, the results from both benchmark networks demonstrate that VVSI-guided PSO improves power-loss reduction, voltage profiles, and local steady-state voltage sensitivity compared with conventional PSO and GA. The improvements are more pronounced in the 69-bus network, suggesting potential benefits for electrically stressed radial feeders. Further investigations under varying loads, DG penetration levels, and network configurations are needed to assess the broader applicability of the proposed framework.
Table 5. Statistical performance comparison for the IEEE 69-bus distribution network
Algorithm | Best | Mean | Median | Worst | SD | 95% CI |
PSO | 98.20 | 102.22 | 101.98 | 107.20 | 2.80 | 101.17–103.27 |
GA | 92.75 | 96.32 | 96.11 | 100.75 | 2.49 | 95.39–97.25 |
Proposed | 85.30 | 87.76 | 87.61 | 90.80 | 1.71 | 87.12–88.40 |
- Statistical Significance and Operational Constraint Analysis
The proposed framework employs 30 PSO particles, 100 iterations, and a VVSI perturbation step of 0.01 p.u. Sensitivity-guided screening reduces the candidate search space, potentially improving optimization efficiency. Statistical performance is assessed using the Wilcoxon rank-sum test with Holm correction and rank-biserial effect sizes, while operational feasibility is evaluated through DG penetration, bus-voltage limits, and branch-loading constraints. Further analysis is needed to assess computational efficiency under different parameter settings and network sizes.
Table 6 summarizes the operational performance of the optimized DG configurations. The total DG capacities are 1,300 kW and 1,450 kW for the 33-bus and 69-bus systems, corresponding to penetration levels of 34.99% and 38.14%, respectively. Both configurations satisfy the prescribed 60% DG penetration limit, while the minimum bus voltages improve to 0.967 and 0.972 p.u. The reported maximum voltages and branch-loading levels provide additional operating indicators, subject to verification against the network limits.
Table 7 presents the Wilcoxon rank-sum test results with Holm correction for pairwise comparisons between the proposed method and conventional PSO and GA. All adjusted p-values are below 0.05, indicating statistically significant differences in optimization performance. The rank-biserial effect sizes further support the observed differences between the compared algorithms.
Table 8 compares three configurations: conventional PSO (C1), VVSI-based candidate screening only (C2), and the complete VVSI-guided PSO framework (C3). For the 33-bus system, power loss decreases from 110.25 kW (C1) to 103.80 kW (C2) and 98.45 kW (C3). Corresponding values for the 69-bus system are 98.20, 91.60, and 85.30 kW. These results indicate that both sensitivity-guided screening and VVSI integration into the objective function contribute to improved DG planning performance under the investigated conditions.
Overall, the proposed VVSI-guided PSO improves power-loss reduction, voltage profiles, and steady-state voltage sensitivity across both benchmark networks while satisfying the prescribed DG penetration limit. Statistical and ablation comparisons provide additional evidence of the effectiveness of sensitivity-guided candidate selection and objective-function integration. Nevertheless, further investigations under varying operating conditions and objective weights are needed to assess the broader applicability of the proposed framework.
Table 6. Operational constraint assessment of the proposed DG configurations
Parameter | IEEE 33-bus | IEEE 69-bus |
Total DG capacity (kW) | 1,300 | 1,450 |
Total active load (kW) | 3,715 | 3,802 |
DG penetration (%) | 34.99 | 38.14 |
Penetration margin (percentage points) | 25.01 | 21.86 |
Minimum bus voltage (p.u.) | 0.967 | 0.972 |
Maximum bus voltage (p.u.) | 1.012 | 1.009 |
Maximum branch loading (%) | 78.40 | 82.60 |
Table 7. Wilcoxon–Holm statistical comparison of optimization algorithms
Network | Comparison | Adjusted p-value | Effect size |
IEEE 33 | Proposed vs. PSO | 6.04 ×  | −1.000 |
Proposed vs. GA | 6.70 × | −0.982 |
IEEE 69 | Proposed vs. PSO | 6.04 × | −1.000 |
Proposed vs. GA | 6.04 × | −1.000 |
Table 8. Ablation comparison of the proposed VVSI-guided DG planning framework
Network | Configuration | Power loss (kW) | Vmin (p.u.) | VVSI |
IEEE 33-bus | C1 – Conventional PSO | 110.25 | 0.955 | 0.72 |
C2 – VVSI screening only | 103.80 | 0.961 | 0.61 |
C3 – Full VVSI–PSO | 98.45 | 0.967 | 0.51 |
IEEE 69-bus | C1 – Conventional PSO | 98.2 | 0.961 | 0.68 |
C2 – VVSI screening only | 91.60 | 0.966 | 0.58 |
C3 – Full VVSI–PSO | 85.3 | 0.972 | 0.48 |
CONCLUSIONS
This paper proposed a VVSI-guided PSO framework for optimal DG placement and sizing in radial DNs. The main contribution is the integration of voltage sensitivity information into both candidate-bus selection and the optimization objective. Simulations on the 33-bus and 69-bus systems showed power-loss reductions of 53.3% and 62.1%, respectively, compared with the base cases. The minimum bus voltages improved to 0.967 and 0.972 p.u., while normalized VVSI decreased to 0.51 and 0.48. Compared with conventional PSO, the proposed framework achieved additional power-loss reductions of 10.7% and 13.1% for the two networks. These results demonstrate improvements in power-loss performance, voltage profiles, and local steady-state voltage sensitivity under the investigated conditions. Nevertheless, the study is limited to two benchmark networks and fixed operating conditions. Future work will investigate time-varying loads, renewable uncertainty, reactive-power support, and further statistical and ablation evaluations to assess the robustness and applicability of the proposed method.
DECLARATION
Supplementary Materials
No supplementary materials are provided with this manuscript.
Sustainable Development Goals
This study contributes primarily to Affordable and Clean Energy (SDG 7) and Industry, Innovation and Infrastructure (SDG 9) through the development of a sensitivity-guided DG planning framework aimed at improving the efficiency, voltage performance, and operational robustness of DNs.
Author Contribution
The author contributed to the conceptualization, methodology, mathematical formulation, simulation, data analysis, validation, visualization, writing of the original draft, and revision of the manuscript. The author has read and approved the final manuscript.
Funding
This research received no external funding.
Acknowledgement
The author would like to acknowledge Thu Duc College of Technology for providing the academic environment and institutional support for this research.
Conflicts of Interest
The author declares no conflict of interest.
ABBREVIATIONS
DG | : | Distributed Generation |
DN | : | Distribution Network |
PSO | : | Particle Swarm Optimization |
GA | : | Genetic Algorithm |
VVSI | : | Voltage Vulnerability Sensitivity Index |
REFERENCES
- H. H. H. Mousa, K. Mahmoud, and M. Lehtonen, “A comprehensive review on recent developments of hosting capacity estimation and optimization for active distribution networks,” IEEE Access, vol. 12, pp. 18545–18593, 2024, https://doi.org/10.1109/ACCESS.2024.3359431.
- A. Haleem, M. Ibrahim, and S. Member, “Incipient fault detection in power distribution networks: Review, analysis, challenges, and future directions,” IEEE Access, vol. 12, pp. 112822–112838, 2024, https://doi.org/10.1109/ACCESS.2024.3443252.
- R. Shaikh, A. Stojcevski, M. Seyedmahmoudian, and J. Chandran, “A multi-objective approach for optimal sizing and placement of distributed generators and distribution static compensators in a distribution network using the black widow optimization algorithm,” Sustainability, vol. 16, no. 11, p. 4577, 2024, https://doi.org/10.3390/su16114577.
- A. Owosuhi, Y. Hamam, and J. Munda, “A new framework for active loss reduction and voltage profile enhancement in a distributed generation-dominated radial distribution network,” Appl. Sci., vol. 14, no. 3, p. 1077, 2024, https://doi.org/10.3390/app14031077.
- A. Jain and S. C. Gupta, “Optimal placement of distributed generation in power distribution system and evaluating the losses and voltage using machine learning algorithms,” Front. Energy Res., vol. 12, p. 1378242, 2024, https://doi.org/10.3389/fenrg.2024.1378242.
- I. U. Salam, M. Yousif, M. Numan, K. Zeb, and M. Billah, “Optimizing distributed generation placement and sizing in distribution systems: A multi-objective analysis of power losses, reliability, and operational constraints,” Energies, vol. 16, no. 16, p. 5907, 2023, https://doi.org/10.3390/en16165907.
- T. N. Ton, P. M. Le, L. H. Pham, and T. M. Le, “Bi-level DG optimization in distribution networks with TOU pricing and demand response using MPA,” ECTI Trans. Electr. Eng. Electron. Commun., vol. 23, no. 3, pp. 1–10, 2025, https://doi.org/10.37936/ecti-eec.2525231.259805.
- B. K. Malika et al., “A quasi oppositional forensic based investigation algorithm for optimizing distributed generation placement and sizing in power distribution systems,” Sci. Rep., vol. 15, Art. no. 16471, pp. 1–34, 2025, https://doi.org/10.1038/s41598-025-01378-4.
- K. R. K. V. Prasad, R. Kollu, A. Ramkumar, and A. Ramesh, “A multi-objective strategy for optimal DG and capacitors placement to improve technical, economic, and environmental benefits,” Int. J. Electr. Power Energy Syst., vol. 165, p. 110491, 2025, https://doi.org/10.1016/j.ijepes.2025.110491.
- N. Bouchikhi, F. Boussadia, R. Bouddou, and A. O. Salau, “Optimal distributed generation placement and sizing using modified grey wolf optimization and ETAP for power system performance enhancement and protection adaptation,” Sci. Rep., vol. 15, p. 13919, 2025, https://doi.org/10.1038/s41598-025-98012-0.
- I. Cetinbas, B. Tamyurek, and M. Demirtas, “The hybrid Harris Hawks Optimizer-Arithmetic Optimization Algorithm: A new hybrid algorithm for sizing optimization and design of microgrids,” IEEE Access, vol. 10, pp. 19254–19283, 2022, https://doi.org/10.1109/ACCESS.2022.3151119.
- N. C. Yang, M. J. Liu, K. Y. Lai, and E. W. Adinda, “Three-phase power flow calculations using initial voltage estimation method for unbalanced distribution networks,” IEEE Access, vol. 10, pp. 103705–103717, 2022, https://doi.org/10.1109/ACCESS.2022.3207783.
- M. Rizal, A. Azis, and Y. Irwansi, “Analysis of the impact of load imbalance on neutral current and power losses caused by neutral current in transformer 1, 30 MVA, 70/20 kV at Bungaran Substation,” Int. J. Electr. Eng. Math. Comput. Sci., vol. 2, no. 3, pp. 32–54, 2025, https://doi.org/10.62951/ijeemcs.v2i3.318.
- P. Rajakumar et al., “Hybrid sensitivity-driven enhanced modified ant lion optimizer framework for multi-distributed generation allocation in radial distribution networks,” Energy Rep., vol. 15, Art. no. 109144, 2026, https://doi.org/10.1016/j.egyr.2026.109144.
- P. Rajakumar, P. M. Balasubramaniam, E. Parimalasundar, K. Suresh, and P. Aravind, “Optimized placement and sizing of solar photovoltaic distributed generation using jellyfish search algorithm for enhanced power system performance,” Sci. Rep., vol. 15, no. 1, pp. 1–27, 2025, https://doi.org/10.1038/s41598-025-08227-4.
- T. N. Ton, P. M. Le, and T. M. Le, “Multi-objective optimization of distributed generation placement and sizing in active distribution networks considering harmonic distortion,” Int. J. Electr. Comput. Eng., vol. 16, no. 2, pp. 598–607, 2026, https://doi.org/10.11591/ijece.v16i2.pp598-607.
- T. N. Ton, T. T. Phan, and L. H. Pham, “Optimal distributed generation planning for loss reduction and phase balancing in unbalanced distribution networks using the INFO algorithm,” ECTI Trans. Electr. Eng. Electron. Commun., vol. 24, no. 2, 2026, https://doi.org/10.37936/ecti-eec.2026242.262002.
- A. Dong and S. Lee, “Research on a distributed photovoltaic two-level planning method based on the SCMPSO algorithm,” Energies, vol. 17, no. 13, p. 3251, 2024, https://doi.org/10.3390/en17133251.
- S. Adeleke, I. Olajide, O. Bode, A. Kumar, O. Wasiu, and H. Kotb, “Graph theory-enhanced integrated distribution network reconfiguration and distributed generation planning: A comparative techno-economic and environmental impacts analysis,” Clean. Eng. Technol., vol. 22, p. 100808, 2024, https://doi.org/10.1016/j.clet.2024.100808.
- S. Mokred, Y. Wang, M. Alruwaili, and M. A. Ibrahim, “A novel approach for voltage stability assessment and optimal siting and sizing of DGs in radial power distribution networks,” Processes, vol. 13, no. 7, pp. 1–26, 2025, https://doi.org/10.3390/pr13072239.
- B. Ahmadi, O. Ceylan, A. Ozdemir, and M. Fotuhi-firuzabad, “A multi-objective framework for distributed energy resources planning and storage management,” Appl. Energy, vol. 314, p. 118887, 2022, https://doi.org/10.1016/j.apenergy.2022.118887.
- P. Rajakumar, P. M. Balasubramaniam, A. Munimathan, and M. Alwetaishi, “Osprey optimization algorithm for distributed generation integration in a radial distribution system for power loss reduction,” Sci. Rep., vol. 15, no. 1, pp. 1–19, 2025, https://doi.org/10.1038/s41598-025-02411-2.
- M. Akanni, O. Mohammed, and T. Raphael, “An improved particle swarm optimisation algorithm for optimum placement and sizing of biogas-fuelled distributed generators for seasonal loads in a radial distribution network,” Energy Rep., vol. 12, pp. 1531–1550, 2024, https://doi.org/10.1016/j.egyr.2024.07.049.
- D. A. Mansour, A. N. Tahoon, M. M. Emara, A. L. Elrefai, and T. F. Megahed, “Standardization of hosting capacity: A comprehensive review of limiting factors, assessment methods, enhancement strategies, and standardization gaps,” Sustainability, vol. 18, no. 18, p. 9244, 2026, https://doi.org/10.3390/su18189244.
- R. Salgotra, R. Chaudhary, P. Verma, and S. Mirjalili, “The rise of particle swarm optimization: A systematic bibliometric & thematic review (1995–2025),” Arch. Comput. Methods Eng., 2026, https://doi.org/10.1007/s11831-026-10532-8.
- M. A. Mossie, T. T. Yetayew, G. T. Bitew, M. G. Yenealem, and T. M. Beza, “Adaptive genetic algorithm and enhanced particle swarm optimization for static voltage stability enhancement in radial distribution systems with distributed generation integration,” Discov. Appl. Sci., vol. 7, p. 1414, 2025, https://doi.org/10.1007/s42452-025-07945-8.
- K. Pereira, J. M. Home-ortiz, and E. M. C. Franco, “A multi-objective optimization approach for integrated allocation of distributed generation and protection devices in distribution systems,” IEEE Access, vol. 13, pp. 84139–84152, 2025, https://doi.org/10.1109/ACCESS.2025.3569431.
- Y. Wang and J. Wu, “Minimum PV curtailment for distribution networks based on moment difference analysis theory,” Int. J. Electr. Power Energy Syst., vol. 167, p. 110654, 2025, https://doi.org/10.1016/j.ijepes.2025.110654.
- A. Fraija, K. Agbossou, N. Henao, S. Kelouwani, M. Fournier, and S. S. Hosseini, “A discount-based time-of-use electricity pricing strategy for demand response with minimum information using reinforcement learning,” IEEE Access, vol. 10, pp. 54018–54028, 2022, https://doi.org/10.1109/ACCESS.2022.3175839.
- M. U. Hashmi, A. Koirala, R. Lundholm, H. Ergun, and D. Van Hertem, “Evaluation of voltage magnitude based unbalance metric for low voltage distribution networks,” in 2022 IEEE PES Gen. Meet., pp. 1–16, 2022, https://doi.org/10.1109/PESGM48719.2022.9916772.
- L. López, I. López, J. G. Itxaso, and A. Pablo, “Analysis of impact for PV-BES strategies in low-voltage distribution system,” Electr. Eng., vol. 107, no. 2, pp. 2147–2162, 2025, https://doi.org/10.1007/s00202-024-02620-4.
- A. Tarraq, F. Elmariami, A. Belfqih, and T. Haidi, “Meta-heuristic optimization methods applied to renewable distributed generation planning: A review,” E3S Web Conf., vol. 234, pp. 1–10, 2021, https://doi.org/10.1051/e3sconf/202123400086.
- G. Guo et al., “Research on the three-phase load imbalance control of the active distribution network based on the distributed power flow controller,” Front. Energy Res., vol. 12, p. 1414084, 2024, https://doi.org/10.3389/fenrg.2024.1414084.
- L. S. Xuan, T. Juhana, T. Hashim, and M. N. Kamarudin, “Optimal location and sizing of distributed generation to minimize losses using whale optimization algorithm,” Indones. J. Electr. Eng. Comput. Sci., vol. 29, no. 1, pp. 15–23, 2023, https://doi.org/10.11591/ijeecs.v29.i1.pp15-23.
- D. Rangel-Martinez, K. D. P. Nigam, and L. A. Ricardez-Sandoval, “Machine learning on sustainable energy: A review and outlook on renewable energy systems, catalysis, smart grid and energy storage,” Chem. Eng. Res. Des., vol. 174, pp. 414–441, 2021, https://doi.org/10.1016/j.cherd.2021.08.013.
- E. Fernandez, M. J. Hossain, K. Mahmud, M. S. H. Nizami, and M. Kashif, “A bi-level optimization-based community energy management system for optimal energy sharing and trading among peers,” J. Clean. Prod., vol. 279, p. 123254, 2021, https://doi.org/10.1016/j.jclepro.2020.123254.
- N. Du et al., “Hosting capacity assessment in distribution networks considering wind-photovoltaic-load temporal characteristics,” Front. Energy Res., vol. 9, p. 767610, 2021, https://doi.org/10.3389/fenrg.2021.767610.
- X. Geng, L. Tong, A. Bhattacharya, B. Mallick, and L. Xie, “Probabilistic hosting capacity analysis via Bayesian optimization,” in IEEE Power Energy Soc. Gen. Meet., pp. 1–16, 2021, https://doi.org/10.1109/PESGM46819.2021.9637907.
- P. Rajakumar et al., “Minimizing power loss in radial power distribution networks via optimal DG allocation using sensitivity indices aided hippopotamus optimization algorithm,” Sci. Rep., vol. 16, Art. no. 16801, pp. 1–31, 2026, https://doi.org/10.1038/s41598-026-47563-x.
- M. A. Mossie, T. T. Yetayew, and G. T. Bitew, “A computational approach to voltage stability enhancement and loss reduction in distribution systems using PSO-optimized STATCOM and DG,” Sci. Rep., vol. 15, no. 1, p. 45031, 2025, https://doi.org/10.1038/s41598-025-30235-7.
- A. K. Karmaker, Y. Du, J. Yang, and M. Jacob, “Challenges and applications of hosting capacity analysis in DER-rich power systems,” Appl. Energy, vol. 407, p. 127323, 2026, https://doi.org/10.1016/j.apenergy.2025.127323.
- N. Saxena, M. Pandit, and L. Srivastava, “Multi-objective DG placement in radial distribution systems using the IbI logic algorithm,” Front. Energy Res., vol. 12, p. 1453715, 2024, https://doi.org/10.3389/fenrg.2024.1453715.
- F. K. Ariyo, A. P. Adeagbo, O. B. Adewuyi, S. O. Ayanlade, and T. U. Badrudeen, “Advanced particle swarm optimization for efficient coordination of distributed generators in power distribution networks,” J. Electr. Syst. Inf. Technol., vol. 12, Art. no. 39, 2025, https://doi.org/10.1186/s43067-025-00231-y.
- A. Demirci, S. M. Tercan, E. E. E. Ahmed, U. Cali, and I. Nakir, “A novel electric vehicle charging management with dynamic active power curtailment framework for PV-rich prosumers,” IEEE Access, vol. 12, pp. 120239–120249, 2024, https://doi.org/10.1109/ACCESS.2024.3450799.
- S. Alizadeh, M. Mahdavian, and E. Ganji, “Optimal placement and sizing of photovoltaic power plants in power grid considering multi-objective optimization using evolutionary algorithms,” J. Electr. Syst. Inf. Technol., vol. 10, no. 7, 2023, https://doi.org/10.1186/s43067-023-00073-6.
- M. Ayalew et al., “Integration of renewable based distributed generation for distribution network expansion planning,” Energies, vol. 15, no. 4, p. 1378, 2022, https://doi.org/10.3390/en15041378.
- F. M. Aboshady, I. Pisica, and F. Ahmed, “Reactive power control of PV inverters in active distribution grids with high PV penetration,” IEEE Access, vol. 11, p. 1, 2023, https://doi.org/10.1109/ACCESS.2023.3299351.
- S. P. Somathilaka, N. T. Senarathna, H. M. W. Banda, and K. T. M. U. Hemapala, “Enhanced particle swarm optimization for minimizing governor actuation in hydropower plants under renewable energy intermittency,” IEEE Access, vol. 14, p. 1, 2026, https://doi.org/10.1109/ACCESS.2026.3663494.
- T. N. Ton, “Optimal allocation of renewable distributed generation considering harmonic distortion and hosting capacity in active distribution networks,” Thail. Electr. Eng. J., vol. 6, no. 2, pp. 20–27, 2026, https://doi.org/10.14456/teej.2026.5.
- K. Wang, Y. Huang, Y. Liu, T. Huang, and S. Zang, “A review of optimization scheduling for active distribution networks with high-penetration distributed generation access,” Energies, vol. 18, no. 15, p. 4119, 2025, https://doi.org/10.3390/en18154119.
Trieu Ngoc Ton (Sensitivity-Guided Distributed Generation Planning for Improved Voltage Performance in Distribution Networks)