ISSN: 2685-9572 Buletin Ilmiah Sarjana Teknik Elektro
Vol. 8, No. 5, October 2026, pp. 1516-1528
TPOT AutoML-Guided Optimization of a Heterogeneous Stacking Ensemble for P2P Lending Default Prediction
Much Aziz Muslim 1, Dwika Ananda Agustina Pertiwi 2, Jumanto 3,
Ari Nugroho Putro 4, Sidiq Noor Kharisma 5, Pramudya Kamal Jumblat 6,
Shahrul Nizam Salahuddin 7, Yosza Dasril 8
1,3,4,5,6 Department of Computer Science, Universitas Negeri Semarang, Semarang, Indonesia
2,7 Faculty of Technology Management and Business, Universiti Tun Hussein Onn Malaysia, Johor, Malaysia
8 Faculty of Electronics and Computer Technology and Engineering, Universiti Teknikal Malaysia Melaka, Melaka, Malaysia
ARTICLE INFORMATION |
| ABSTRACT |
Article History: Received 31 May 2026 Revised 27 August 2026 Accepted 14 October 2026 |
| 
Default risk in peer-to-peer (P2P) lending can cause substantial losses for investors and platforms, requiring classification models with reliable discrimination and probability estimates. However, conventional credit-risk pipelines often use manually configured models and provide limited exploration of complementary algorithm families. The research contribution is a reproducible TPOT AutoML-guided heterogeneous stacking framework that integrates family-constrained pipeline search, leakage-free nested evaluation, calibration, significance testing, and ablation analysis. TPOT was selected because its exportable scikit-learn-compatible pipelines and customizable operator spaces permit explicit control of learner families and feature selection. The experiments used 27 pre-loan attributes from 200,000 unique Lending Club records covering 2007–Q3 2020, divided into 20,000 discovery records and 180,000 locked evaluation records. TPOT optimized Random Forest, CatBoost, and LightGBM pipelines, whose out-of-fold probabilities were combined with a prespecified Hist Gradient Boosting learner using a CatBoost meta-learner and sigmoid calibration. Final performance was estimated using stratified nested cross-validation with 10 outer and three inner folds, while the classification threshold was fixed from the discovery partition. The proposed model achieved a ROC-AUC of 0.7123 (95% CI: 0.7094–0.7152), accuracy of 0.6694, recall of 0.6266, F1-score of 0.4249, and Brier score of 0.1425. Its ROC-AUC gains over Hist Gradient Boosting, LightGBM, Random Forest, and Logistic Regression remained significant after Holm correction, whereas differences from CatBoost and XGBoost were not significant. The framework therefore provides competitive discrimination and reliable calibration, although its gains over the strongest boosting baselines were marginal and external validation beyond a single Lending Club sample remains necessary. |
Keywords: P2P Lending; TPOT AutoML; Heterogeneous Stacking; Credit Risk Prediction; ROC-AUC |
Corresponding Author: Much Aziz Muslim, Department of Computer Science, Universitas Negeri Semarang, Semarang, Indonesia. Email: a212muslim@mail.unnes.ac.id |
This work is open access under a Creative Commons Attribution-Share Alike 4.0 
|
Document Citation: M. Z. Muslim, D. A. A. Pertiwi, J. Jumanto, A. N. Putro, S. N. Kharisma, P. K. Jumblat, S. N. Salahuddin, and Y. Dasril, “TPOT AutoML-Guided Optimization of a Heterogeneous Stacking Ensemble for P2P Lending Default Prediction,” Buletin Ilmiah Sarjana Teknik Elektro, vol. 8, no. 5, pp. 1516-1528, 2026, DOI: 10.12928/biste.v8i5.17316. |
INTRODUCTION
Financial technology (fintech) is growing rapidly as a vehicle for innovation in the financial sector by leveraging advances in information technology [1][2]. One of the most popular forms of financial services is peer-to-peer lending (P2P Lending) [3]-[5]. P2P lending platforms serve as online intermediaries between lenders and borrowers including both individuals and small businesses, by providing access to microcredit in a faster, more transparent, and more flexible manner than conventional financial institutions [6]-[8]. Although they provide easy access to capital, loan transactions on P2P platforms are generally not secured by physical collateral [9][10]. This situation makes default risk a major issue that determines the sustainability of the platform’s operations and the security of investors’ funds [11][12].
In recent years, data mining and machine learning have been widely developed to build default risk classification models [13]-[15]. Gradient boosting algorithms such as XGBoost, LightGBM, and CatBoost are most used because of their reliability in processing high-dimensional data [16]-[18]. Nevertheless, manually configured machine-learning pipelines typically evaluate a predetermined set of predictors, algorithms, and hyperparameters, making the breadth of exploration dependent on the researcher-defined search budget [19][20]. Consequently, potentially competitive pipeline configurations may remain unexplored when the number of possible feature model hyperparameter combinations become large [21][22]. Furthermore, when feature selection and model tuning are conducted independently, interactions between the selected predictors and learner-specific hyperparameters may not be jointly optimized [21][23].
Another fundamental problem in credit risk assessment is class imbalance, where the number of performing loans far exceeds that of nonperforming loans [24]-[26]. Under these conditions, using accuracy as the primary metric is highly misleading because a naive model that predicts all loans as “performing” can achieve high accuracy but completely fail to detect nonperforming loans [27][28]. Therefore, the Area Under the Receiver Operating Characteristic Curve (ROC-AUC) metric is adopted as the primary evaluation metric in this study due to its independence from the decision threshold range and its resilience to class imbalance [29]-[31].
To address these gaps, this study uses the Tree-based Pipeline Optimization Tool (TPOT AutoML) to guide the systematic exploration of heterogeneous stacking architectures for P2P lending default prediction. TPOT represents candidate pipelines as genetic programs and evolves them within predefined family-constrained search spaces using ROC-AUC as the fitness objective [32][33]. TPOT was selected over broader AutoML frameworks such as Auto-sklearn, H2O AutoML, and AutoGluon because its exportable scikit-learn-compatible pipelines and customizable operator spaces provide explicit control over learner families, feature selection, and the evolutionary search process. The resulting four-base architecture combines a TPOT-optimized Random Forest bagging learner with TPOT-optimized CatBoost and LightGBM pipelines and a fixed HistGradientBoosting learner; their out-of-fold probability predictions are integrated by a CatBoost meta-learner followed by sigmoid calibration.
The experiments used a stratified sample of 200,000 unique loan records drawn from the Lending Club dataset covering 2007–Q3 2020, comprising 161,023 fully paid loans and 38,977 charged-off loans. To reduce the risk of target leakage, variables that became available only after loan approval or during repayment were excluded, leaving 27 pre-loan application attributes. The sample was partitioned into 20,000 records for architecture discovery and 180,000 records for locked final evaluation, with no overlap between the two partitions. The locked partition was evaluated using 10 outer stratified folds and three inner folds for generating out-of-fold meta-features, while the architecture, calibration method, and classification threshold were determined exclusively from the discovery partition. The research contribution is a reproducible TPOT-guided framework that integrates family-constrained pipeline search, leakage-free nested stacking, probability calibration, and ablation analysis to evaluate whether heterogeneous learners provide complementary information for P2P lending default prediction.
- LITERATURE REVIEW
Machine learning-based credit risk assessment has shifted from the use of classical statistical models such as logistic regression and linear discriminant analysis [34][35] to the use of tree-based ensemble classifiers [36]-[38]. Research by Serrano-Cinca et al. shows that Lending Club’s internal baseline model yields a ROC-AUC value of 0.6700. The use of single gradient boosting algorithms such as LightGBM and CatBoost has proven capable of improving predictive performance [18]. However, the performance of an individual learner can vary with feature representation, class distribution, and hyperparameter configuration, motivating systematic comparison rather than reliance on a single algorithm.
Heterogeneous stacking combines probabilistic outputs from learners with different inductive biases, allowing the meta-learner to exploit complementary decision patterns; its potential benefit depends on both base-learner accuracy and diversity in their prediction errors [39][40]. In a stacking architecture, out-of-fold probability predictions generated by the first-level base learners form a meta-feature matrix used to train the second-level meta-learner [41]. Muslim et al. reported that combining heterogeneous base learners with a boosting-based meta-learner improved classification accuracy within their evaluation setting. Similarly, Abror et al. applied GA-SVM feature selection before combining multiple base learners through an XGBoost meta-learner for bankruptcy prediction [42]. Nevertheless, many reported stacking studies rely on researcher-defined sets of base learners and meta-learners, leaving limited evidence on whether alternative architecture and hyperparameter combinations could provide comparable or better performance.
- METHODS
The research methods section explains the chronology of the research, including research design, research procedures (in the form of algorithms, block diagrams, flowcharts, pseudocode or others), testing methods and data acquisition [1]-[3]. The description of the research process must be supported by references, so that the explanation can be accepted scientifically [2],[4].
The research procedure consists of five stages: stratified dataset preparation and preprocessing, family-constrained TPOT pipeline discovery, discovery-based architecture and threshold selection, locked nested evaluation, and statistical, calibration, ablation, and interpretability analysis. The complete workflow, including the separation of discovery and locked evaluation partitions and the generation of out-of-fold meta-features, is illustrated in Figure 1.
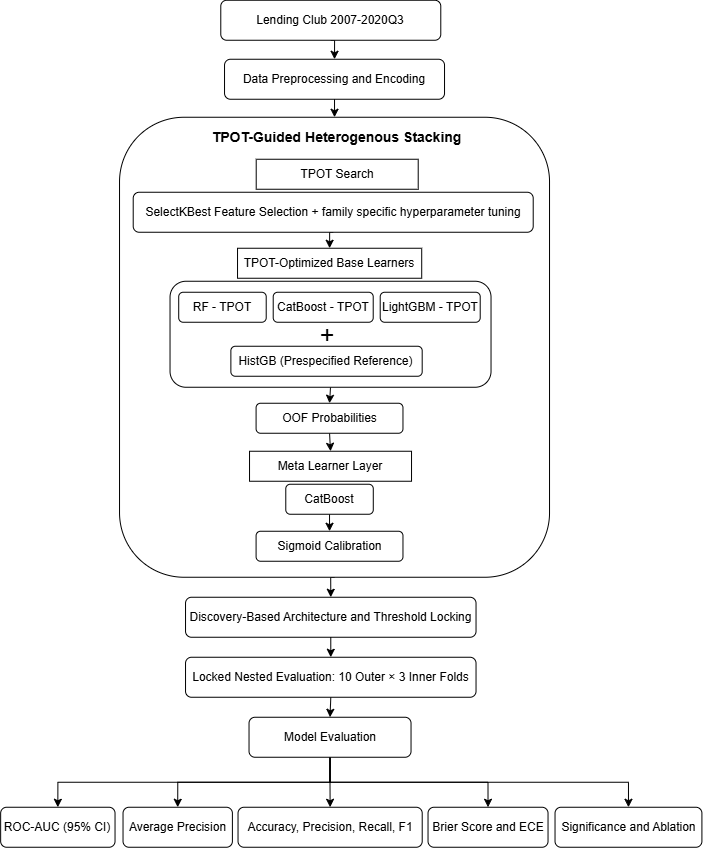
Figure 1. Research Method Workflow
Data Preprocessing and Encoding
The research data were obtained from the Kaggle Lending Club dataset covering 2007 through the third quarter of 2020; the cleaned source file contained 2,925,492 loan records before research sampling. From this source, a stratified random sample of 200,000 records with unique loan IDs was selected, comprising 161,023 fully paid loans (class 0) and 38,977 charged-off loans (class 1) according to the loan_status target. All preprocessing operations were fitted exclusively on the training portion of each fold and then applied unchanged to the corresponding validation or test portion [43], Missing numerical values were imputed using Simple Imputer with the median strategy because the median is less sensitive to skewed distributions and extreme observations than the arithmetic mean [44]. Missing categorical values were imputed using SimpleImputer with the most_frequent strategy, with the modal category estimated only from the corresponding training fold. After imputation, categorical features were transformed using Ordinal Encoder (handle_unknown= "use_encoded_value", unknown_value=-1), allowing categories unseen during training to be represented without using target information. Ordinal Encoder was selected to maintain a compact, fixed-width representation across the tree-based pipelines and avoid the dimensional expansion of one-hot encoding, whereas target encoding was excluded because its use of label statistics would require an additional leakage-controlled estimation procedure [45]. Dataset encoded negative sentinel values were retained as distinct observed values rather than converted to missing values, while only actual missing and infinite numerical values were processed by the imputation pipeline. To restrict prediction to information available at or before loan origination, attributes generated during repayment or after the final loan outcome were excluded from the analysis. After filtering, 27 predictors were retained, while loan identifiers were used only to verify record uniqueness and were excluded from the feature matrix; the complete predictor list is presented in Table 1.
Table 1. Initial loan application features
No. | Attribute | Data Type | Description |
1 | loan_amnt | Numerical | Total loan amount requested by the borrower (USD). |
2 | term | Categorical | Loan repayment term (36 or 60 months). |
3 | int_rate | Numerical | Annual interest rate applied to the loan (%). |
4 | installment | Numerical | Required monthly installment payment (USD). |
5 | grade | Categorical | Lending Club credit risk grade (A–G). |
6 | sub_grade | Categorical | Detailed credit risk subgrade (A1–G5). |
7 | emp_length | Categorical | Borrower's employment duration (years). |
8 | home_ownership | Categorical | Home ownership status (e.g., RENT, OWN, MORTGAGE). |
9 | annual_inc | Numerical | Borrower's annual income (USD). |
10 | verification_status | Categorical | Income verification status of the borrower. |
11 | purpose | Categorical | Purpose of the loan application. |
12 | dti | Numerical | Debt-to-income (DTI) ratio. |
13 | delinq_2yrs | Numerical | Number of delinquencies exceeding 30 days within the past two years. |
14 | fico_range_low | Numerical | Lower bound of the borrower's FICO credit score range. |
15 | fico_range_high | Numerical | Upper bound of the borrower's FICO credit score range. |
16 | inq_last_6mths | Numerical | Number of credit inquiries made during the past six months. |
17 | mths_since_last_delinq | Numerical | Number of months since the borrower's last delinquency. |
18 | open_acc | Numerical | Number of currently active credit accounts. |
19 | pub_rec | Numerical | Number of derogatory public records. |
20 | revol_bal | Numerical | Total revolving credit balance (USD). |
21 | revol_util | Numerical | Revolving credit utilization rate (%). |
22 | total_acc | Numerical | Total number of credit accounts held by the borrower. |
23 | initial_list_status | Categorical | Initial loan listing status (W or F). |
24 | collections_12_mths_ex_med | Numerical | Number of non-medical collections reported within the past 12 months. |
25 | application_type | Categorical | Loan application type (Individual or Joint). |
26 | acc_now_delinq | Numerical | Number of accounts currently delinquent. |
27 | tot_cur_bal | Numerical | Total current balance across all credit accounts (USD). |
TPOT AutoML-Guided Heterogeneous Stacking Ensemble
Candidate base-learner pipelines were explored on the discovery partition using TPOT AutoML, with all preprocessing operations refitted within each cross-validation training split. Rather than conducting an unrestricted search, four family-specific operator spaces were defined in advance to explore Random Forest, CatBoost, LightGBM, and Hist Gradient Boosting candidate pipelines separately. This family constrained design preserved the intended contrast between bagging and gradient-boosting learners while keeping the evolutionary search computationally tractable. The restriction was motivated by the strong empirical performance of tree based learners on financial tabular data, their ability to represent nonlinear relationships and feature interactions, and their compatibility with class-weighted learning for imbalanced classification [36],[46]. Within each family-specific search, TPOT used Genetic Programming to evolve feature-selection and estimator hyperparameter configurations, with mean stratified three-fold cross-validation ROC-AUC as the fitness objective. Each family specific search used a population of 10 pipelines over four generations, with mutation, crossover, mutation then crossover, and crossover-then-mutation probabilities of 0.70, 0.20, 0.05, and 0.05, respectively, and a random seed of 42. Each family was allocated a maximum search budget of 20 minutes, with a four-minute limit for evaluating an individual pipeline and n_jobs=1; all four family searches completed in 903.4 seconds (approximately 15.1 minutes). The TPOT search optimized feature-selection and estimator hyperparameter configurations separately for each base-learner family, whereas the stacking architecture, meta-learner, and calibration method were compared afterward using out-of-fold predictions from the discovery partition. TPOT produced an optimized pipeline for each of the four learner families; discovery evaluation subsequently compared these pipelines with the prespecified reference configurations and retained the TPOT-selected Random Forest, CatBoost, and LightGBM pipelines together with the fixed Hist Gradient Boosting reference configuration for the primary stack. The HistGradientBoosting reference configuration—SelectKBest with k = 25, max_iter = 200, learning_rate = 0.04, class_weight = “balanced”, and random_state = 42—was inherited from the initial experimental design and prespecified before architecture comparison. It was not optimized using the locked evaluation partition. Feature selection was incorporated through SelectKBest using the ANOVA F-statistic with  ; this filter-based method was selected because it has a substantially lower computational cost within repeated evolutionary cross-validation than wrapper methods that require additional estimator fitting. For each TPOT candidate, the search jointly optimized the selected feature count and family-specific estimator hyperparameters; the class-1 out-of-fold probabilities from the four retained base learners subsequently formed a four-dimensional meta-feature matrix. At the meta level, CatBoost and LightGBM candidates with raw or sigmoid-calibrated outputs were fitted to the discovery out-of-fold meta-features; the primary heterogeneous architecture was locked according to the highest discovery ROC-AUC, with the Brier score used as a tiebreaker.
Algorithm 1. TPOT-Guided Heterogeneous Stacking Procedure
Input: Dataset D containing 200,000 unique records.
Output: Locked model, decision threshold, and final out-of-fold predictions.
- Split D into 20,000 discovery and 180,000 locked evaluation records without ID overlap; use 16,000 discovery records for TPOT search and 4,000 for validation.
- Optimize each learner family using three-fold TPOT search with a population of 10, four generations, ROC-AUC objective, and fold-specific preprocessing.
- Retain the TPOT-selected Random Forest, CatBoost, and LightGBM pipelines with the prespecified HistGradientBoosting learner, then generate five-fold discovery out-of-fold probabilities.
- Select and lock the heterogeneous architecture, meta-learner, and calibration method using discovery ROC-AUC and Brier score, and determine the threshold by maximizing discovery F1-score.
- Evaluate the locked model using 10 outer and three inner folds on the 180,000 records, followed by performance, significance, calibration, ablation, and permutation-importance analyses.
The locked evaluation partition was not used during pipeline, architecture, calibration, or threshold selection.
Experimental Environment
All experiments were conducted on Windows 11 using an AMD64 Family 25 Model 80 processor with 16 logical CPUs and 16.54 GB of system memory. The software environment comprised Python 3.13.14, TPOT 1.1.0, scikit-learn 1.9.0, NumPy 2.4.6, pandas 3.0.3, CatBoost 1.2.10, LightGBM 4.6.0, and XGBoost 3.2.0.
Nested Cross-Validation and Discovery Based Decision Threshold Selection
After the architecture was locked, it was evaluated on the 180,000-record final partition using 10 outer stratified folds, with 162,000 records used for training and 18,000 records used for testing in each outer iteration while preserving the class distribution [47]. Within each outer training partition, three inner stratified folds generated out-of-fold base-learner probabilities for training the meta-learner, while predictions for the corresponding outer test fold were produced by base learners refitted only on that outer training partition [48]. The classification threshold was applied only to the sigmoid-calibrated probability produced at the meta level, whereas the base-learner outputs remained continuous probability inputs and were not thresholded. Because charged-off loans represented approximately 19.5% of the sample, a fixed threshold of 0.50 could produce high overall accuracy while yielding low recall for the default class; threshold selection was therefore treated as a separate operational decision [49]. The threshold was determined exclusively from the discovery out of fold predictions by evaluating the empirical thresholds returned by the precision recall curve and selecting the value that maximized the F1-score [50][51]. This procedure produced a threshold of 0.215447, which was locked before final evaluation and applied unchanged to the predictions from all outer test folds.
Model Evaluation
When measuring the performance of a credit risk model, it is crucial to distinguish between primary and secondary metrics [52]. ROC-AUC was used as the primary metric because it evaluates the ranking discrimination of predicted scores across decision thresholds; however, average precision and threshold-dependent metrics were also reported because ROC-AUC alone may obscure performance on the minority class [29]. At the locked threshold, accuracy, balanced accuracy, precision, recall, specificity, F1-score, and Matthews correlation coefficient quantified classification behavior, while the Brier score, log loss, and expected calibration error assessed probability quality. Evaluation estimates can be inflated when synthetic resampling is applied before data partitioning or when post-outcome attributes are included, because either practice can transfer information unavailable at prediction time into the evaluation process [15]. Accordingly, no synthetic oversampling was applied, and all candidate models were evaluated using the same 27 predictors, nested data partitions, and fold-specific preprocessing procedures. The formula for calculating ROC-AUC is given in Equation (1), accuracy is given in Equation (2), precision is given in Equation (3), recall is given in Equation (4), and the F1-score is given in Equation (5).
Statistical and Calibration Analysis
The 95% confidence interval for each ROC-AUC estimate was calculated from the DeLong variance of the pooled out-of-fold prediction scores. Pairwise ROC-AUC differences between the proposed and competing models were evaluated using two-sided paired DeLong tests on the pooled out-of-fold scores and two-sided paired t-tests on the 10 outer-fold ROC-AUC values. To control the family-wise error rate across 24 planned model comparisons, the resulting p-values were adjusted using the Holm step-down procedure, with an adjusted  considered statistically significant. Probability calibration was assessed using the Brier score, log loss, and expected calibration error computed over 10 equal width probability bins, while the sigmoid calibration method was selected exclusively from the discovery partition. A leave one base learner out ablation analysis was conducted by removing each component of the selected four base architecture in turn and refitting the meta-level model and calibration procedure using the remaining out of fold probabilities. Stack-level permutation importance was estimated by permuting each base-learner probability feature 10 times within every outer test fold, measuring the resulting decrease in ROC-AUC, and averaging the importance values across the 10 outer folds.
- RESULT AND DISCUSSION
The final performance estimates were obtained from pooled out of fold predictions on the locked 180,000-record evaluation partition using the 10 outer fold and three inner fold procedure described above; the comparison with the principal baseline models is presented in Table 2.
Table 2 shows that the proposed model achieved the highest ROC-AUC of 0.7123, but its absolute gains over CatBoost TPOT and XGBoost were only 0.0002 and 0.0005, respectively, indicating marginal rather than substantial improvement over the strongest baselines. Logistic Regression produced the lowest ROC-AUC among the reported baselines at 0.7027, while the tree based baseline models ranged from 0.7049 to 0.7120, suggesting a modest advantage from modeling nonlinear relationships under the same evaluation protocol. Among the individual learners, CatBoost TPOT achieved the highest ROC-AUC of 0.7120 and average precision of 0.3685, whereas XGBoost produced the highest recall of 0.7463, showing that no single model dominated all evaluation criteria. The narrow ROC-AUC range among CatBoost, XGBoost, and HistGradientBoosting suggests that the strongest tree-based learners extracted similar discriminative information from the same 27 predictors, thereby limiting the additional gain available to the stacking layer. Nevertheless, complementary prediction errors cannot be inferred from algorithm labels alone and must be examined empirically through component ablation and permutation-based contribution analysis.
Table 2. Performance of The Proposed Model and Baseline Models
Model | ROC-AUC (95% CI) | AP | Accuracy | Precision | Recall | F1-Score | Brier |
Proposed heterogeneous stacking | 0.7123 (0.7094–0.7152) | 0.3671 | 0.6694 | 0.3214 | 0.6266 | 0.4249 | 0.1425 |
CatBoost TPOT | 0.7120 (0.7091–0.7149) | 0.3685 | 0.6420 | 0.3085 | 0.6741 | 0.4232 | 0.2165 |
XGBoost | 0.7118 (0.7089–0.7147) | 0.3684 | 0.5947 | 0.2901 | 0.7463 | 0.4178 | 0.2122 |
HistGradientBoosting | 0.7116 (0.7087–0.7145) | 0.3669 | 0.6548 | 0.3141 | 0.6516 | 0.4239 | 0.2149 |
LightGBM TPOT | 0.7082 (0.7053–0.7112) | 0.3616 | 0.6604 | 0.3159 | 0.6370 | 0.4223 | 0.2177 |
Random Forest TPOT | 0.7049 (0.7020–0.7079) | 0.3585 | 0.5843 | 0.2837 | 0.7435 | 0.4107 | 0.2166 |
Logistic Regression | 0.7027 (0.6997–0.7056) | 0.3497 | 0.6677 | 0.3176 | 0.6142 | 0.4187 | 0.2190 |
The proposed model also obtained a Brier score of 0.1425, lower than the 0.2122–0.2190 range of the uncalibrated individual baselines, indicating that sigmoid calibration substantially improved probability reliability despite the marginal ROC-AUC gain. At the locked threshold of 0.215447, the proposed model achieved an accuracy of 0.6694, recall of 0.6266, and F1-score of 0.4249; in contrast, applying the default threshold of 0.50 increased accuracy to 0.8066 but reduced recall to 0.0383. This contrast demonstrates that threshold selection changes the operational classification trade-off but does not alter ROC-AUC, which depends on the ranking of predicted scores across thresholds. To determine whether all four components were necessary, a leave-one-base-learner-out ablation analysis was performed to quantify the contribution of each retained learner; the results are presented separately in Table 4. Random Forest contributes a bootstrap-aggregation mechanism that differs from the sequential optimization used by the gradient boosting learners, although this architectural difference does not by itself guarantee complementary predictions. Stack-level permutation importance showed mean ROC-AUC decreases of 0.0952 for CatBoost and 0.0358 for HistGradientBoosting, compared with only 0.0011 for Random Forest and 0.0009 for LightGBM, indicating that the meta-learner relied primarily on the two boosting components.
In this framework, TPOT was used for base level pipeline discovery rather than end to end stacking optimization, while the meta learner and calibration method were selected separately using discovery out of fold predictions. Among the heterogeneous candidates evaluated on the discovery partition, the four-base architecture with a CatBoost meta learner and sigmoid calibration was selected with an out of fold ROC-AUC of 0.7028 and a Brier score of 0.1435 before the final partition was evaluated. The CatBoost meta-learner was selected empirically rather than assumed to be superior a priori; it modeled nonlinear interactions among the four probability meta-features, while sigmoid calibration adjusted the resulting probability scale. The meta learner received a four-column matrix of continuous base-learner probabilities rather than the original 27 predictors, reducing input dimensionality while preserving model specific risk estimates. Sigmoid calibration reduced the proposed model’s Brier score from 0.2177 to 0.1425 and expected calibration error from 0.2644 to 0.0054, while ROC-AUC remained essentially unchanged at approximately 0.7123, confirming that calibration improved probability reliability rather than ranking discrimination.
Because the ROC-AUC estimates of the proposed model, CatBoost TPOT, and XGBoost differed by less than 0.001, model ranking alone was insufficient to establish superiority, and the pairwise significance results are therefore reported in Table 5. On discovery validation, the TPOT selected Random Forest, CatBoost, and LightGBM pipelines improved ROC-AUC over their reference configurations by 0.0248, 0.0084, and 0.0295, respectively, whereas the TPOT selected Hist Gradient Boosting pipeline decreased ROC-AUC by 0.0018, showing that the benefit of evolutionary search was family specific. The final proposed model achieved a ROC-AUC of 0.7123 (95% CI: 0.7094–0.7152), average precision of 0.3671, accuracy of 0.6694, F1-score of 0.4249, and recall of 0.6266 at the discovery selected threshold of 0.215447. The final configuration of the three TPOT-selected base pipelines, the fixed Hist Gradient Boosting component, the Cat Boost meta-learner, sigmoid calibration, and the locked classification threshold is summarized in Table 3. To quantify the contribution of each base learner, Table 4 presents the leave one base learner out ablation results relative to the selected four base architecture.
Table 3. Final configuration of the proposed heterogeneous stacking model
Component | Algorithm | Final Configuration | Selection Source |
Base learner 1 | Random Forest | SelectKBest(k=27); n_estimators=200; max_depth=8; max_features=log2; min_samples_split=10; min_samples_leaf=1; class_weight=balanced_subsample | TPOT discovery |
Base learner 2 | CatBoost | SelectKBest(k=27); iterations=500; learning_rate=0.02; depth=6; l2_leaf_reg=10; random_strength=1; auto_class_weights=Balanced | TPOT discovery |
Base learner 3 | LightGBM | SelectKBest(k=27); n_estimators=150; learning_rate=0.02; num_leaves=31; max_depth=14; min_child_samples=40; subsample=0.8; colsample_bytree=0.8; class_weight=balanced | TPOT discovery |
Base learner 4 | HistGradientBoosting | SelectKBest(k=25); max_iter=200; learning_rate=0.04; class_weight=balanced; random_state=42 | Prespecified reference |
Meta-learner | CatBoost | iterations=150; learning_rate=0.05; depth=4; auto_class_weights=Balanced; loss_function=Logloss; eval_metric=AUC | Discovery comparison |
Calibration | Sigmoid | CalibratedClassifierCV(method=sigmoid, cv=3) | Discovery comparison |
Decision threshold | Maximum discovery F1 | threshold=0.215447 | Discovery OOF predictions |
Table 4. Leave One Base Learner Out Ablation Results
Configuration | Retained Base Learners | ROC-AUC | ΔAUC from Full Model | F1-Score | Brier |
Full proposed model | RF + CatBoost + LightGBM + HistGBT | 0.712272 | Reference | 0.424910 | 0.142516 |
Without Random Forest | CatBoost + LightGBM + HistGBT | 0.712336 | +0.000064 | 0.423937 | 0.142484 |
Without CatBoost | RF + LightGBM + HistGBT | 0.711008 | −0.001265 | 0.424053 | 0.142699 |
Without LightGBM | RF + CatBoost + HistGBT | 0.712486 | +0.000214 | 0.424402 | 0.142470 |
Without HistGradientBoosting | RF + CatBoost + LightGBM | 0.711607 | −0.000665 | 0.424827 | 0.142607 |
Removing CatBoost produced the largest ROC-AUC decrease of 0.001265, followed by a decrease of 0.000665 after removing Hist Gradient Boosting, whereas removing LightGBM slightly increased ROC-AUC by 0.000214, consistent with its low permutation importance. The difference between the full model and the variant without LightGBM was significant under the Holm-adjusted DeLong test ( ) but not under the Holm-adjusted paired-fold test (
 ); therefore, the result is interpreted as possible component redundancy rather than robust evidence of superior performance. Table 5 summarizes the Holm-adjusted paired DeLong and outer-fold test results comparing the proposed model with the principal baseline models.
Table 5. Holm-adjusted significance tests comparing the proposed model with the baseline models
Baseline | 
| DeLong  | Paired fold | Interpretation |
CatBoost TPOT | +0.000245 | 0.4241 | 0.4566 | Not significant |
XGBoost | +0.000469 | 0.6499 | 0.4867 | Not significant |
HistGradientBoosting | +0.000668 | 0.0007 | 0.0259 | Significant in both tests |
LightGBM TPOT | +0.004044 | <0.001 | <0.001 | Significant in both tests |
Random Forest TPOT | +0.007354 | <0.001 | <0.001 | Significant in both tests |
Logistic Regression | +0.009579 | <0.001 | <0.001 | Significant in both tests |
The proposed model significantly outperformed Hist Gradient Boosting, LightGBM TPOT, Random Forest TPOT, and Logistic Regression under both statistical tests, but its differences from CatBoost TPOT and XGBoost were not statistically significant after Holm correction. Accordingly, the proposed model should be interpreted as providing competitive discrimination and substantially improved calibration rather than universally superior predictive performance over all modern boosting baselines. The ROC and precision–recall curves of the proposed model and the principal baselines are presented in Figure 2 and Figure 3, respectively, to illustrate their discrimination and minority class ranking performance across decision thresholds.
The ROC curves of the proposed model, CatBoost TPOT, XGBoost, and Hist Gradient Boosting largely overlapped, consistent with their small ROC-AUC differences, while the precision–recall analysis showed slightly higher average precision for CatBoost TPOT (0.3685) and XGBoost (0.3684) than for the proposed model (0.3671). The corresponding precision recall curves are presented in Figure 3.
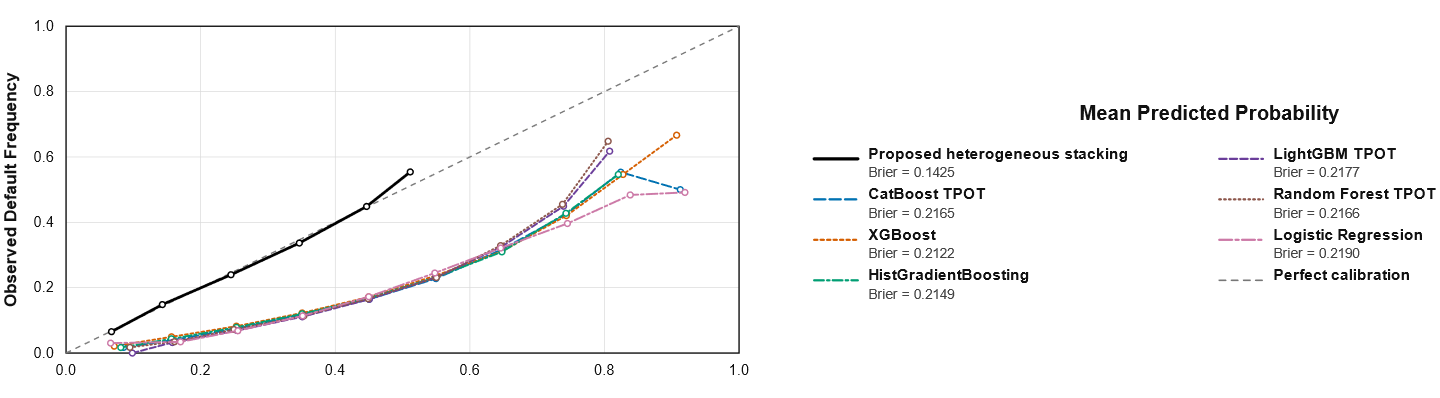
The sigmoid-calibrated curve was substantially closer to the ideal diagonal than the raw meta-learner output, consistent with the reduction in Brier score from 0.2177 to 0.1425 and in expected calibration error from 0.2644 to 0.0054. This improvement is practically relevant because credit-risk decisions require not only correct borrower ranking but also probability estimates that more closely reflect the observed default frequency. Figure 4 presents the calibration curves of the sigmoid-calibrated proposed model and the principal baseline models, comparing the mean predicted default probabilities with the observed default frequencies across 10 equal-width probability bins.
Figure 2. ROC curves of the proposed heterogeneous stacking model and baseline models on the locked evaluation partition
Figure 3. Precision–recall curves of the proposed heterogeneous stacking model and baseline models on the locked evaluation partition
Figure 4. Calibration curves of the proposed heterogeneous stacking model and baseline models on the locked evaluation partition
CatBoost and Hist Gradient Boosting produced the largest mean ROC-AUC decreases after permutation, indicating that they supplied most of the discriminative information used by the meta-learner. In contrast, the small importance values of Random Forest and LightGBM were consistent with the limited changes observed when these learners were removed during ablation. Because this analysis operates at the stacking level, it explains the contribution of base learners rather than the effects of individual borrower attributes; input-level SHAP analysis remains a direction for further interpretability research. The computational cost of the family-specific TPOT searches was compared with fitting the corresponding prespecified reference configurations, as summarized in Table 6.
TPOT required approximately 53–128 times the fitting time of the corresponding reference configurations, with the largest ROC-AUC gain observed for LightGBM and no gain observed for HistGradientBoosting. These findings indicate that the computational benefit of evolutionary optimization is model-family dependent and should be weighed against the available search budget. Compared with Auto-sklearn, H2O AutoML, and AutoGluon, TPOT provides an explicitly customizable evolutionary operator space and exportable scikit-learn-compatible pipelines, which suited the objective of controlling learner families and inspecting the resulting configurations. However, these frameworks were not benchmarked directly in the present experiment; therefore, the selection of TPOT reflects methodological suitability rather than demonstrated predictive or computational superiority over other AutoML systems. To contextualize the findings, Table 7 compares the proposed model with selected Lending Club studies; these values are interpreted cautiously because the studies used different sampling periods, predictor sets, preprocessing procedures, and validation protocols.
Within the selected studies summarized in Table 7, the proposed model’s ROC-AUC of 0.7123 lies at the upper end of the reported range, although direct performance ranking is not appropriate because the studies differ in sampling, feature availability, class distribution, decision thresholds, and validation design. The principal contribution is therefore not a large universal performance gain, but a reproducible leakage-controlled evaluation showing that TPOT-guided heterogeneous stacking can provide competitive discrimination, reliable probability calibration, and transparent component-level evidence through significance and ablation analysis.
Table 6. Computational cost and discovery performance of TPOT searches
Model family | Reference ROC-AUC | TPOT ROC-AUC | ΔAUC | Reference fit time (s) | TPOT search and fit time (s) | Time ratio |
Random Forest | 0.6744 | 0.6991 | +0.0248 | 5.68 | 335.08 | 59.0× |
CatBoost | 0.6961 | 0.7045 | +0.0084 | 6.46 | 341.33 | 52.8× |
LightGBM | 0.6690 | 0.6984 | +0.0295 | 1.22 | 79.56 | 65.1× |
HistGradientBoosting | 0.7016 | 0.6998 | −0.0018 | 1.03 | 131.76 | 127.8× |
Table 7. Comparison with selected Lending Club studies
Study | Model | Reported ROC-AUC | Reported Accuracy |
Serrano-Cinca et al. (2015) [34] | Logistic Regression | 0.6700 | — |
Cho et al. (2019) [53] | Improved Evolutionary Fuzzy SVM | 0.7100 | 0.6950 |
Madaan et al. (2021) [46] | Random Forest | 0.7000 | 0.6800 |
Souadda et al. (2025) [54] | Optuna-optimized LightGBM | 0.7077 | 0.6850 |
Proposed Model | TPOT-guided heterogeneous stacking | 0.7123 | 0.6694 |
- CONCLUSIONS
This study developed a TPOT guided four base heterogeneous stacking model for P2P lending default prediction, combining Random Forest, CatBoost, LightGBM, and Hist Gradient Boosting base learners with a CatBoost meta-learner and sigmoid calibration. Family constrained TPOT searches enabled systematic optimization of the Random Forest, CatBoost, and LightGBM pipelines, while discovery-based model locking and nested out of fold evaluation reduced the risks of preprocessing leakage and evaluation driven model selection. The proposed model achieved a ROC-AUC of 0.7123 (95% CI: 0.7094–0.7152), accuracy of 0.6694, recall of 0.6266, F1-score of 0.4249, and Brier score of 0.1425 on the locked evaluation partition. The ROC-AUC improvement was statistically significant relative to HistGradientBoosting, LightGBM, Random Forest, and Logistic Regression, but not relative to CatBoost and XGBoost, indicating competitive and well calibrated performance rather than substantial universal superiority. The study is limited by its reliance on a single Lending Club data source and a stratified 200,000-record sample, its restriction to tree-based search spaces, the absence of direct experimental comparisons with other AutoML frameworks, and interpretability analysis conducted only at the stacking level. Future research should validate the locked framework on independent P2P lending datasets, compare it directly with broader AutoML systems, and extend interpretability from stack-level contributions to borrower-level feature explanations.
DECLARATION
Sustainable Development Goals
This suitable Sustainable Development Goal can be categorized as Decent Work and Economic Growth (SDG 8) and Industry, Innovation and Infrastructure (SDG 9)
Author Contribution
Much Aziz Muslim: Conceptualization, Methodology, and Final Validation. Dwika Ananda Agustina Pertiwi: Data Curation, Experimental Testing, and Writing. Jumanto Unjung: Methodology, Validation, and Writing. Ari Nugroho Putro: Formal Analysis, Implementation, Visualization, Writing and Editing. Sidiq Noor Kharisma: Software, Writing and Editing. Pramudya Kamal Jumblat: Resources, Validation, Writing, and Editing. Shahrul Nizam Salahuddin: Supervision and Validation. Yosza Dasril: Data Curation and Validation.
Funding
This research was funded by Institute for Research and Community Service (LPPM), grant number 111.8.4/UN37/PPK.11/2026.
Acknowledgement
This research was supported by the Institute for Research and Community Service (LPPM), Universitas Negeri Semarang, Indonesia, through the Budgetary Execution Checklist (DPA) research grant (Grant No. 111.8.4/UN37/PPK.11/2026). The authors gratefully acknowledge this financial support.
REFERENCES
- G. Kou and Y. Lu, “FinTech: a literature review of emerging financial technologies and applications,” Financial Innovation, vol. 11, no. 1, p. 1, 2025, https://doi.org/10.1186/s40854-024-00668-6.
- D. Ha, P. Le, and D. K. Nguyen, “Financial inclusion and fintech: a state-of-the-art systematic literature review: DHT Thieu et al,” Financial Innovation, vol. 11, no. 1, p. 69, 2025, https://doi.org/10.1186/s40854-024-00741-0.
- B. Setiawan et al., “Why do people use P2P lending services? The role of AI literacy and green self identity,” Journal of Financial Services Marketing, vol. 31, no. 2, Jun. 2026, https://doi.org/10.1057/s41264-026-00357-8.
- F. M. J. Teichmann, S. R. Boticiu, and B. S. Sergi, “Compliance concerns in sustainable finance: an analysis of peer-to-peer (P2P) lending platforms and sustainability,” J. Financ. Crime, vol. 31, no. 4, pp. 993–1001, Jun. 2024, https://doi.org/10.1108/JFC-11-2022-0281.
- S. Chung, K. Kim, C. H. Lee, and W. Oh, “Interdependence between online peer‐to‐peer lending and cryptocurrency markets and its effects on financial inclusion,” Prod. Oper. Manag., vol. 32, no. 6, pp. 1939–1957, Jun. 2023, https://doi.org/10.1111/poms.13950.
- G. Klein, Z. Shtudiner, and M. Zwilling, “Why do peer-to-peer (P2P) lending platforms fail? The gap between P2P lenders’ preferences and the platforms’ intentions,” Electronic Commerce Research, vol. 23, no. 2, pp. 709–738, Jun. 2023, https://doi.org/10.1007/s10660-021-09489-6.
- A. A. Taleizadeh, A. Z. Safaei, A. Bhattacharya, and A. Amjadian, “Online peer-to-peer lending platform and supply chain finance decisions and strategies,” Ann. Oper. Res., vol. 315, no. 1, pp. 397–427, Aug. 2022, https://doi.org/10.1007/s10479-022-04648-w.
- N. Eid, J. Yang, and M. Duygun, “Bridging the credit gap: The influence of regional bank structure on the expansion of peer-to-peer lending,” British Accounting Review, vol. 56, no. 6, Nov. 2024, https://doi.org/10.1016/j.bar.2024.101448.
- M. A. Muslim, Y. Dasril, M. Sam’an, and Y. N. Ifriza, “An improved light gradient boosting machine algorithm based on swarm algorithms for predicting loan default of peer-to-peer lending,” Indonesian Journal of Electrical Engineering and Computer Science, vol. 28, no. 2, p. 1002, Nov. 2022, https://doi.org/10.11591/ijeecs.v28.i2.pp1002-1011.
- Z. Zhang, Y. Gu, L. Jiang, W. Yu, and J. Dai, “Internet of Things and Blockchain-Based Smart Contracts: Enabling Continuous Risk Monitoring and Assessment in Peer-to-Peer Lending,” Journal of Emerging Technologies in Accounting, vol. 20, no. 2, pp. 181–194, Oct. 2023, https://doi.org/10.2308/JETA-2022-003.
- T. Bao, Y. Ding, R. Gopal, and M. Möhlmann, “Throwing Good Money After Bad: Risk Mitigation Strategies in the P2P Lending Platforms,” Information Systems Frontiers, vol. 26, no. 4, pp. 1453–1473, Aug. 2024, https://doi.org/10.1007/s10796-023-10423-4.
- B. Prasetiyo, Alamsyah, M. A. Muslim, Subhan, and N. Baroroh, “Artificial neural network model for banckrupty prediction,” J. Phys. Conf. Ser., vol. 1567, no. 3, p. 032022, Jun. 2020, https://doi.org/10.1088/1742-6596/1567/3/032022.
- P. C. Ko, P. C. Lin, H. T. Do, and Y. F. Huang, “P2P Lending Default Prediction Based on AI and Statistical Models,” Entropy, vol. 24, no. 6, Jun. 2022, https://doi.org/10.3390/e24060801.
- A. Alonso Robisco and J. M. Carbó Martínez, “Measuring the model risk-adjusted performance of machine learning algorithms in credit default prediction,” Financial Innovation, vol. 8, no. 1, p. 70, Dec. 2022, https://doi.org/10.1186/s40854-022-00366-1.
- A. Akinjole, O. Shobayo, J. Popoola, O. Okoyeigbo, and B. Ogunleye, “Ensemble-Based Machine Learning Algorithm for Loan Default Risk Prediction,” Mathematics, vol. 12, no. 21, p. 3423, Oct. 2024, https://doi.org/10.3390/math12213423.
- A.-H. Chang, L.-K. Yang, R.-H. Tsaih, and S.-K. Lin, “Machine learning and artificial neural networks to construct P2P lending credit-scoring model: A case using Lending Club data,” Quantitative Finance and Economics, vol. 6, no. 2, pp. 303–325, 2022, https://doi.org/10.3934/qfe.2022013.
- Y. Dasril, M. A. Muslim, M. F. Al Hakim, J. Jumanto, and B. Prasetiyo, “Credit Risk Assessment in P2P Lending Using LightGBM and Particle Swarm Optimization,” Register: Jurnal Ilmiah Teknologi Sistem Informasi, vol. 9, no. 1, pp. 18–28, Feb. 2023, https://doi.org/10.26594/register.v9i1.3060.
- I. H. Sugozu, C. Verberi, and S. Yasar, “Machine learning approaches to credit risk: Evaluating Turkish participation and conventional banks,” Borsa Istanbul Review, vol. 25, no. 3, pp. 497–512, May 2025, https://doi.org/10.1016/j.bir.2025.02.001.
- A. M. Vincent and P. Jidesh, “An improved hyperparameter optimization framework for AutoML systems using evolutionary algorithms,” Sci. Rep., vol. 13, no. 1, Dec. 2023, https://doi.org/10.1038/s41598-023-32027-3.
- X. He, K. Zhao, and X. Chu, “AutoML: A survey of the state-of-the-art,” Knowl. Based. Syst., vol. 212, Jan. 2021, https://doi.org/10.1016/j.knosys.2020.106622.
- M. M. Taye, “Understanding of Machine Learning with Deep Learning: Architectures, Workflow, Applications and Future Directions,” Computers, vol. 12, no. 5, p. 91, Apr. 2023, https://doi.org/10.3390/computers12050091.
- M. Baratchi et al., “Automated machine learning: past, present and future,” Artif. Intell. Rev., vol. 57, no. 5, May 2024, https://doi.org/10.1007/s10462-024-10726-1.
- M. Sabzevari, G. Martínez-Muñoz, and A. Suárez, “Building heterogeneous ensembles by pooling homogeneous ensembles,” International Journal of Machine Learning and Cybernetics, vol. 13, no. 2, pp. 551–558, Feb. 2022, https://doi.org/10.1007/s13042-021-01442-1.
- S. Shi, R. Tse, W. Luo, S. D’Addona, and G. Pau, “Machine learning-driven credit risk: a systemic review,” Springer Science and Business Media Deutschland GmbH, Sep. 01, 2022, https://doi.org/10.1007/s00521-022-07472-2.
- Y. Chen, R. Calabrese, and B. Martin-Barragan, “Interpretable machine learning for imbalanced credit scoring datasets,” Eur. J. Oper. Res., vol. 312, no. 1, pp. 357–372, Jan. 2024, https://doi.org/10.1016/j.ejor.2023.06.036.
- V. La Gatta, M. Postiglione, and G. Sperlì, “A novel augmentation strategy for credit scoring modeling,” Neural Comput. Appl., vol. 37, no. 9, pp. 6663–6675, Mar. 2025, https://doi.org/10.1007/s00521-024-10452-3.
- N. Suhadolnik, J. Ueyama, and S. Da Silva, “Machine Learning for Enhanced Credit Risk Assessment: An Empirical Approach,” Journal of Risk and Financial Management, vol. 16, no. 12, Dec. 2023, https://doi.org/10.3390/jrfm16120496.
- U. Soni and G. Jethava, “Enhancing credit risk prediction via voting classifier and meta-dynamic ensemble selection on imbalanced data,” Discover Artificial Intelligence, vol. 6, no. 1, p. 138, Jan. 2026, https://doi.org/10.1007/s44163-026-00849-5.
- V. Moscato, A. Picariello, and G. Sperlí, “A benchmark of machine learning approaches for credit score prediction,” Expert Syst. Appl., vol. 165, Mar. 2021, https://doi.org/10.1016/j.eswa.2020.113986.
- E. Richardson, R. Trevizani, J. A. Greenbaum, H. Carter, M. Nielsen, and B. Peters, “The receiver operating characteristic curve accurately assesses imbalanced datasets,” Patterns, vol. 5, no. 6, p. 100994, Jun. 2024, https://doi.org/10.1016/j.patter.2024.100994.
- W. Chen, K. Yang, Z. Yu, Y. Shi, and C. L. P. Chen, “A survey on imbalanced learning: latest research, applications and future directions,” Artif. Intell. Rev., vol. 57, no. 6, Jun. 2024, https://doi.org/10.1007/s10462-024-10759-6.
- D. Tymoshchuk, I. Didych, O. Yasniy, A. Mykytyshyn, and V. Kovtun, “AutoML TPOT with XAI analysis: optimization and interpretation of a machine learning model for the classification of epoxy composites,” In ITTAP, pp. 286-295, 2025, https://doi.org/10.3390/modelling6040118.
- J. G. Hernandez, A. K. Saini, A. Ghosh, and J. H. Moore, “The tree-based pipeline optimization tool: Tackling biomedical research problems with genetic programming and automated machine learning,” Patterns, vol. 6, no. 7, Jul. 2025, https://doi.org/10.1016/j.patter.2025.101314.
- C. Serrano-Cinca, B. Gutiérrez-Nieto, and L. López-Palacios, “Determinants of default in P2P lending,” PLoS One, vol. 10, no. 10, Oct. 2015, https://doi.org/10.1371/journal.pone.0139427.
- H. Ayari, P. R. Guetari, and P. N. Kraïem, “Machine learning powered financial credit scoring: a systematic literature review,” Artif. Intell. Rev., vol. 59, no. 1, Jan. 2026, https://doi.org/10.1007/s10462-025-11416-2.
- Y. Xia, C. Liu, Y. Y. Li, and N. Liu, “A boosted decision tree approach using Bayesian hyper-parameter optimization for credit scoring,” Expert Syst. Appl., vol. 78, pp. 225–241, Jul. 2017, https://doi.org/10.1016/j.eswa.2017.02.017.
- I. Emmanuel, Y. Sun, and Z. Wang, “A machine learning-based credit risk prediction engine system using a stacked classifier and a filter-based feature selection method,” J. Big Data, vol. 11, no. 1, Dec. 2024, https://doi.org/10.1186/s40537-024-00882-0.
- V. Chang, Q. A. Xu, S. H. Akinloye, V. Benson, and K. Hall, “Prediction of bank credit worthiness through credit risk analysis: an explainable machine learning study,” Ann. Oper. Res., vol. 354, no. 1, pp. 247–271, Nov. 2025, https://doi.org/10.1007/s10479-024-06134-x.
- Y. Yang, H. Lv, and N. Chen, “A Survey on ensemble learning under the era of deep learning,” Artif. Intell. Rev., vol. 56, no. 6, pp. 5545–5589, Jun. 2023, https://doi.org/10.1007/s10462-022-10283-5.
- A. A. Khan, O. Chaudhari, and R. Chandra, “A review of ensemble learning and data augmentation models for class imbalanced problems: Combination, implementation and evaluation,” Elsevier Ltd, Jun. 15, 2024, https://doi.org/10.1016/j.eswa.2023.122778.
- M. A. Muslim et al., “New model combination meta-learner to improve accuracy prediction P2P lending with stacking ensemble learning,” Intelligent Systems with Applications, vol. 18, May 2023, https://doi.org/10.1016/j.iswa.2023.200204.
- W. F. Abror, A. Alamsyah, and M. Aziz, “Bankruptcy Prediction Using Genetic Algorithm-Support Vector Machine (GA-SVM) Feature Selection and Stacking,” Journal of Information System Exploration and Research, vol. 1, no. 2, Jul. 2023, https://doi.org/10.52465/joiser.v1i2.180.
- T. Emmanuel, T. Maupong, D. Mpoeleng, T. Semong, B. Mphago, and O. Tabona, “A survey on missing data in machine learning,” J. Big Data, vol. 8, no. 1, Dec. 2021, https://doi.org/10.1186/s40537-021-00516-9.
- S. Alam, M. S. Ayub, S. Arora, and M. A. Khan, “An investigation of the imputation techniques for missing values in ordinal data enhancing clustering and classification analysis validity,” Decision Analytics Journal, vol. 9, Dec. 2023, https://doi.org/10.1016/j.dajour.2023.100341.
- H. L. Smith, P. J. Biggs, N. P. French, A. N. H. Smith, and J. C. Marshall, “Lost in the Forest: Encoding categorical variables and the absent levels problem,” Data Min. Knowl. Discov., vol. 38, no. 4, pp. 1889–1908, Jul. 2024, https://doi.org/10.1007/s10618-024-01019-w.
- M. Madaan, A. Kumar, C. Keshri, R. Jain, and P. Nagrath, “Loan default prediction using decision trees and random forest: A comparative study,” in IOP Conference Series: Materials Science and Engineering, IOP Publishing Ltd, Jan. 2021, https://doi.org/10.1088/1757-899X/1022/1/012042.
- M. J. Lewis, A. Spiliopoulou, K. Goldmann, C. Pitzalis, P. McKeigue, and M. R. Barnes, “Nestedcv: An R package for fast implementation of nested cross-validation with embedded feature selection designed for transcriptomics and high-dimensional data,” Bioinformatics Advances, vol. 3, no. 1, 2023, https://doi.org/10.1093/bioadv/vbad048.
- S. Zian, S. A. Kareem, and K. D. Varathan, “An Empirical Evaluation of Stacked Ensembles With Different Meta-Learners in Imbalanced Classification,” IEEE Access, vol. 9, pp. 87434–87452, 2021, https://doi.org/10.1109/ACCESS.2021.3088414.
- M. R. Mathibela and D. Maposa, “Predictive Modelling of Credit Default Risk Using Machine Learning and Ensemble Techniques,” Mathematical and Computational Applications, vol. 31, no. 2, p. 45, Mar. 2026, https://doi.org/10.3390/mca31020045.
- K. M. Sujon, R. Hassan, K. Choi, and M. A. Samad, “Accuracy, precision, recall, f1-score, or MCC? empirical evidence from advanced statistics, ML, and XAI for evaluating business predictive models,” J. Big Data, vol. 12, no. 1, Dec. 2025, https://doi.org/10.1186/s40537-025-01313-4.
- G. Mulugeta, T. Zewotir, A. S. Tegegne, L. H. Juhar, and M. B. Muleta, “Classification of imbalanced data using machine learning algorithms to predict the risk of renal graft failures in Ethiopia,” BMC Med. Inform. Decis. Mak., vol. 23, no. 1, Dec. 2023, https://doi.org/10.1186/s12911-023-02185-5.
- H. M. Daryani, A. A. Taleizadeh, and M. Afsharian, “A general profit evaluation metric for optimizing profitability of machine learning classifiers in credit risk management,” Inf. Sci. (N. Y.)., vol. 741, p. 123183, Jun. 2026, https://doi.org/10.1016/j.ins.2026.123183.
- P. Cho, W. Chang, and J. W. Song, “Application of Instance-Based Entropy Fuzzy Support Vector Machine in Peer-To-Peer Lending Investment Decision,” IEEE Access, vol. 7, pp. 16925–16939, 2019, https://doi.org/10.1109/ACCESS.2019.2896474.
- L. I. Souadda, A. R.alitim, B. Benilles, J. M. Oliveira, and P. Ramos, “Optimizing Credit Risk Prediction for Peer-to-Peer Lending Using Machine Learning,” Forecasting, vol. 7, no. 3, Sep. 2025, https://doi.org/10.3390/forecast7030035.
Much Aziz Muslim (TPOT AutoML-Guided Optimization of a Heterogeneous Stacking Ensemble for P2P Lending Default Prediction)