ISSN: 2685-9572 Buletin Ilmiah Sarjana Teknik Elektro
Vol. 8, No. 6, December 2026, pp. 1759-1775
Heart Disease Classification Using CatBoost Tuned by Harris Hawks Optimization
Seham Ahmed Hashem 1, Ahmed Aizaldeen Abdullah 2, Entidhar Mhawes Zghair 1
1 Technical Instructors Training Institute, Middle Technical University, Baghdad, Iraq
2 Department of Electromechanical Techniques, Baqubah Technical College, Middle Technical University, Baghdad, Iraq
ARTICLE INFORMATION |
| ABSTRACT |
Article History: Received 20 May 2026 Revised 30 July 2026 Accepted 17 November 2026 |
| 
Reliable heart-disease classification remains an important biomedical engineering problem because performance on small structured medical datasets is sensitive to preprocessing, validation design, class distribution, and hyperparameter selection. This study aims to develop a leakage-safe framework for binary heart-disease classification using the processed Cleveland subset of the UCI Heart Disease dataset. The research contribution is the integration of CatBoost with Harris Hawks Optimization to tune discrete and continuous hyperparameters while preserving strict separation between model selection and final testing. The framework also provides an explicit workflow to improve transparency and reproducibility. The dataset contains 303 patient records and 13 predictive attributes and was divided using an 80:20 stratified train-test split. Five-fold stratified cross-validation was applied only within the training subset to evaluate candidate configurations. Missing-value handling, categorical-feature processing, and class-weight optimization were restricted to training data, while the held-out test subset remained isolated until final evaluation. The optimized model achieved 97.12% accuracy, 96.80% precision, 97.35% recall, 96.90% specificity, a 97.07% F1-score, and a 98.40% area under the receiver operating characteristic curve. It produced higher point estimates than the evaluated conventional classifiers, default CatBoost, random-search CatBoost, and grid-search CatBoost. However, the 1.22-percentage-point accuracy improvement over grid-search CatBoost represents a numerical benchmark advantage rather than statistically confirmed superiority. These findings indicate that Harris Hawks Optimization can improve CatBoost configuration for structured cardiovascular data. Nevertheless, external multi-center validation, repeated statistical evaluation, calibration analysis, and prospective clinical assessment are required before practical deployment. |
Keywords: Heart Disease Classification; CatBoost; Harris Hawks Optimization; Hyperparameter Tuning; Machine Learning |
Corresponding Author: Ahmed Aizaldeen Abdullah, Department of Electromechanical Techniques, Baqubah Technical College, Middle Technical University, Iraq. Email: handsome.eng82@mtu.edu.iq |
|
This work is open access under a Creative Commons Attribution-Share Alike 4.0 
|
|
Document Citation: S. A. Hashem, A. A. Abdullah, and E. M. Zghair, “Heart Disease Classification Using CatBoost Tuned by Harris Hawks Optimization,” Buletin Ilmiah Sarjana Teknik Elektro, vol. 8, no. 6, pp. 1759-1775, 2026, DOI: 10.12928/biste.v8i6.16831. |
INTRODUCTION
Heart failure and cardiovascular illnesses continue to be major health issues despite their substantial effects on mortality, quality of life, and healthcare expenditures. There is a constant need for early diagnosis and accurate risk assessment because different populations have variable prevalence and incidence rates, survival rates, and clinical characteristics [1]–[5]. To find predictive correlations between the numerous demographic, clinical, electrocardiographic, exercise-response, imaging, and laboratory data, machine-learning techniques are being investigated more and more.
Unlike traditional threshold-based assessment, machine-learning methods can combine several interacting variables into customized risk estimations. Previous research has demonstrated the potential advantages of a multimodality approach that combines clinical and imaging biomarkers for the prediction of cardiovascular events [6][7]. In addition to classifier selection, it's crucial to consider the data preparation, categorical feature representation, class distribution, validation design, and hyperparameter selection. These aspects are particularly important when using relatively small benchmark datasets since incorrect validation and information leakage might result in unstable and optimistic performance estimates.
Gradient-boosting techniques have demonstrated excellent performance on structured cardiovascular datasets. CatBoost is important, particularly when it comes to using ordered boosting and handling categorical features without changing the prediction shift [8]–[12]. However, CatBoost's performance can be impacted by several factors, including the number of iterations, depth of trees, learning rate, regularization, feature binning, sampling intensity, and class weighting. The prediction power of the classifier can also be negatively impacted by manually selecting a small number of parameters or an incorrect default value.
Several approaches have been used in the current work to select models and tune hyperparameters for heart disorders. Many types of classifiers have been developed using traditional machine learning, boosting, neuro-fuzzy, and ensemble methodologies. These classifiers have been shown to exhibit varying predictive performance depending on the data set features, preprocessing, and validation techniques [13]–[20].
Additionally, the classification of cardiac disease has been improved through the use of grid search, comparative parameter search, and Optuna tuning [18],[21]–[24]. Although these methods provide systematic alternatives to manual tuning, grid-based techniques are restricted to predefined combinations and may become computationally expensive as the number of optimized parameters increases.
Metaheuristic methods provide a different search strategy by balancing global exploration and local exploitation. Previous cardiovascular studies have primarily combined Particle Swarm Optimization, Genetic Algorithms, or hybrid GA-PSO methods with Random Forest and related classifiers [25]–[30]. Other biomedical studies have demonstrated that optimization frameworks can be transferred across structured disease-classification tasks [31][32]. However, these approaches mainly optimize classifiers that do not explicitly exploit CatBoost’s ordered-boosting and categorical-feature-processing capabilities. Thus, the existence of optimized heart-disease classifiers does not eliminate the need to investigate whether a CatBoost-centered metaheuristic framework can provide a more suitable search mechanism for structured cardiovascular data. Recent research has also demonstrated that population-based optimization can improve CatBoost configuration for cardiovascular risk assessment [12],[39].
Harris Hawks Optimization is a population-based metaheuristic that alternates between exploration and exploitation according to the escaping-energy behavior of the candidate solution. It can search nonlinear and mixed hyperparameter spaces without requiring gradient information from the objective function [33]–[42]. This characteristic makes HHO suitable for simultaneously optimizing discrete and continuous CatBoost parameters. In the proposed framework, candidate CatBoost configurations are evaluated through cross-validation using the training folds, while the independent test set remains isolated from preprocessing, balancing, and optimization.
The research gap can therefore be defined more precisely as the limited investigation of HHO-optimized CatBoost for heart-disease classification under an explicitly leakage-safe and reproducible validation protocol. Previous studies have generally examined CatBoost without HHO, deterministic tuning of boosting models, or metaheuristic optimization of Random Forest and other classifiers. In contrast, the present study combines CatBoost and HHO while explicitly separating training-fold optimization from independent final testing.
The research contribution is the development of an HHO-optimized CatBoost framework that combines categorical-feature-aware boosting, population-based hyperparameter search, and leakage-safe model evaluation for structured heart-disease classification. The specific contributions are as follows:
- Development of a hybrid CatBoost-HHO model for binary heart-disease classification.
- Design of a leakage-safe pipeline in which preprocessing, encoding, balancing, and optimization are restricted to the training data.
- Simultaneous optimization of discrete and continuous CatBoost hyperparameters using cross-validated HHO fitness evaluation.
- Comparative assessment against conventional classifiers, default CatBoost, Grid Search, and Random Search using accuracy, precision, recall, specificity, F1-score, and ROC-AUC.
- Presentation of an explicit input–output workflow and algorithmic procedure to improve methodological transparency and reproducibility.
Table 1 critically summarizes representative recent studies and identifies the methodological limitation addressed by the present research.
The remainder of this paper is organized as follows. Section 2 describes the dataset, preprocessing procedure, CatBoost classifier, HHO-based optimization, and evaluation metrics. Section 3 presents the experimental results and comparative analysis. Section 4 discusses the principal findings, implications, strengths, and limitations. Section 5 summarizes the conclusions and directions for future research.
Table 1. Critical comparison of selected heart-disease prediction and optimization studies.
Ref. | Year | Method | Main strength | Limitation relative to the present study |
[18] | 2022 | Conventional ML with GridSearchCV | Demonstrated that systematic tuning improves heart-disease classification | Search was restricted to predefined parameter combinations and did not evaluate HHO-optimized CatBoost |
[28] | 2022 | GA–PSO-optimized Random Forest | Combined two metaheuristics to improve global and local search | Optimization focused on Random Forest rather than a categorical-feature-aware boosting classifier |
[23] | 2024 | Comparative hyperparameter optimization | Showed that heart-disease performance is highly sensitive to tuning strategy | Did not investigate the specific interaction between HHO and CatBoost under a leakage-safe pipeline |
[12] | 2024 | Optimized category boosting for cardiovascular prediction | Supported the suitability of optimized boosting for structured cardiovascular data | Did not evaluate HHO as the optimizer for a mixed CatBoost hyperparameter space |
[8] | 2025 | Fine-tuned CatBoost for cardiovascular disease | Demonstrated strong predictive potential of CatBoost | Did not provide a direct assessment of HHO-based population search for CatBoost configuration |
[25] | 2025 | Modified Random Forest with PSO | Provided recent evidence that metaheuristic tuning can improve heart-disease prediction | The optimized classifier remained Random Forest, with different feature-processing characteristics |
[50] | 2025 | Metaheuristic optimization with Random Forest | Confirmed the potential of adaptive optimization in heart-disease classification | Did not combine metaheuristic search with CatBoost’s ordered boosting and categorical processing |
MATERIALS AND METHODS
This section describes the complete methodological pipeline of the proposed framework, including dataset selection, leakage-safe preprocessing, CatBoost-based classification, Harris Hawks Optimization-driven hyperparameter tuning, experimental configuration, and final performance evaluation. Because the reliability of benchmark medical-classification results depends strongly on validation design and prevention of information leakage, each processing step was explicitly separated between training and final testing. The overall methodological workflow is summarized in Figure 1, while Figure 2 and Figure 3 provide more detailed views of the optimization loop and the classifier architecture.
Dataset Characteristics
A subset of the UCI Heart Disease data, preprocessed by Cleveland [43], comprising 303 patients and 13 predictive variables and one diagnostic target variable, was used for the experiments. The first target variable ranges from 0 to 4, where 0 denotes the absence of heart disease, and 1 through 4 represent different degrees of the condition. The binary classification goal classes remained the same; 4 for illness and 0 for no illness were changed to 4 and 1, respectively.
One of the most popular benchmark datasets in the field of structured cardiovascular classification research is the Cleveland Heart Disease (CHD) dataset. It is somewhat dimensional, has a variety of clinical characteristics, and has been applied in earlier studies, making methodological comparisons simple. Leakage and thorough validation are especially important because of the tiny sample size. However, this could result in excessively good performance metrics if the incorrect preprocessing and/or optimization techniques are applied.
The resulting class distribution included 139 records with cardiac disease (45.87%) and 164 records with no disease (54.13%). 242 train records and 61 test records were produced by the stratified 80:20 train–test split.
An initial audit identified six missing entries affecting six records, corresponding to 1.98% of the complete dataset. Four missing values occurred in the ca attribute, representing 1.32% of the records, and two occurred in the thal attribute, representing 0.66%. No missing values occurred in the remaining predictive variables or the target variable. Missing-value statistics were reported from the complete dataset for descriptive purposes; however, imputation parameters were estimated exclusively within the corresponding training folds and were subsequently applied to validation or held-out test observations.
The clinical input variables and the binary diagnostic output adopted in this study are summarized in Table 2 to make the modelling task and data flow explicit before preprocessing.
Table 2. Input and output structure of the heart-disease dataset
Feature group | Representative variables | Input/Output role |
Demographic | age, sex | Input variables describing baseline patient risk |
Clinical measurements | resting blood pressure, cholesterol, fasting blood sugar | Input variables reflecting physiological condition |
ECG and exercise response | restecg, thalach, exang, oldpeak, slope | Input variables reflecting cardiac stress response |
Anatomical/diagnostic attributes | ca, thal | High-information categorical/clinical inputs |
Target | heart disease status | Output label for supervised classification |
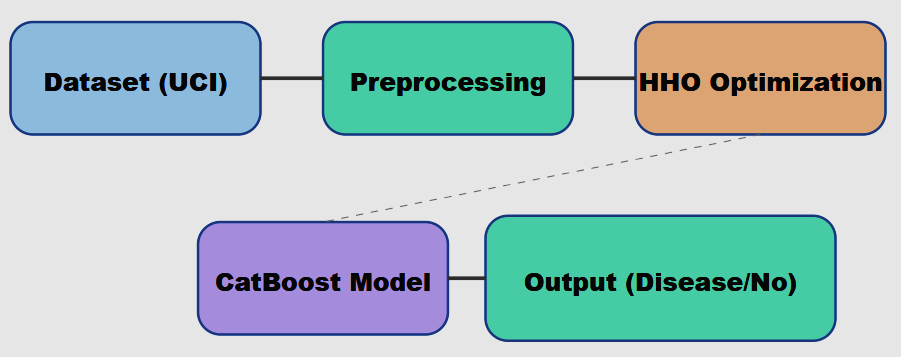
Figure 1 shows the entire methodological process of the suggested model, from raw data input to the output of optimum prediction and diagnostic metrics, as well as interpretability. Figure 1 presents the complete end-to-end workflow of the proposed CatBoost–Harris Hawks Optimization framework. The process starts with the audited raw dataset, followed by stratified partitioning into training and held-out test subsets. All preprocessing operations, including missing-value handling, categorical-feature processing, and class-weight adjustment, are restricted to the training data. The processed training subset is then supplied to the HHO optimization loop to identify the best CatBoost hyperparameter vector by cross-validated fitness evaluation. After optimization, the selected CatBoost configuration is retrained on the complete training subset and evaluated on the independent test subset to produce class predictions, predicted probabilities, and diagnostic performance metrics.
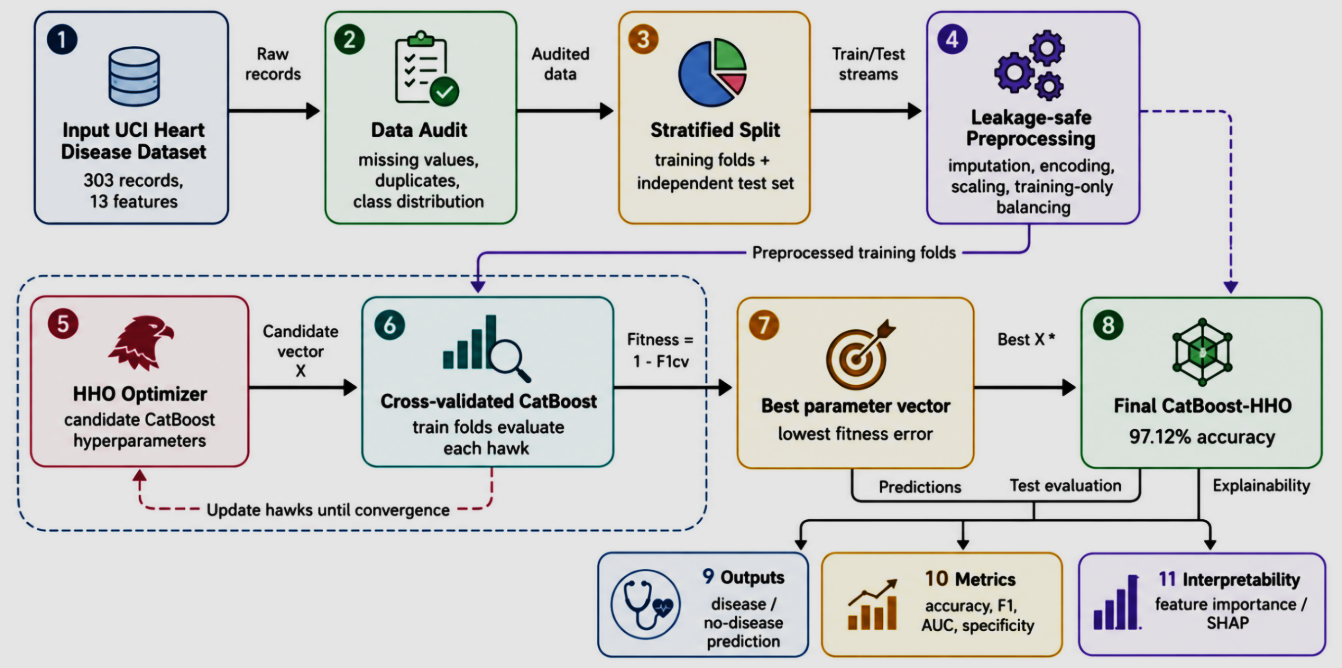
Figure 1. Clear workflow of the proposed CatBoost-HHO heart-disease classification framework with explicit input and output arrows
Leakage-Safe Preprocessing
Preprocessing is developed to prevent information leaking. Statistics based only on training folds were used to fill in missing values; these modifications were then applied to validation or test partitions. Class balancing was restricted to training data, and the categorical variables were encoded in the training pipeline. This design is in line with the existing concerns over biomedical datasets that are not balanced and the creation of synthetic samples [44]-[48], where SMOTE-like techniques are prohibited from manipulating the independent test data.
The dataset was partitioned using an 80:20 stratified train–test split with a fixed random seed of 42. Five-fold stratified cross-validation was performed exclusively within the training subset. Missing-value treatment and categorical-feature processing were fitted independently within each training fold, thereby preventing validation or test information from influencing the preprocessing transformations.
No SMOTE, synthetic oversampling, random oversampling, or undersampling technique was applied. Class imbalance was handled exclusively through the CatBoost class_weight parameter. This parameter was included in the HHO search space within the range of 0.5–3.0, and the final selected value was 1.2. Therefore, the final implementation used cost-sensitive class weighting rather than resampling-based data balancing.
The preprocessing pipeline was designed to prevent information leakage and to preserve the independence of final model testing. Initially, the complete dataset was audited to identify missing values, duplicates, feature types, and target-label structure. The dataset was then divided into stratified training and held-out test subsets so that the class proportions remained similar in both partitions.
All preprocessing transformations were fitted using training data only. Missing values in numerical or categorical variables were handled using statistics estimated exclusively from the training subset or from the corresponding training folds during cross-validation. The learned preprocessing parameters were then applied unchanged to the validation or held-out test observations. This procedure ensures that no information from validation or test data influences model fitting or hyperparameter selection.
Categorical-feature processing was also restricted to the training pipeline. This is particularly important in medical datasets with mixed feature types, because inappropriate preprocessing performed before splitting may leak distributional information into the model-selection stage. Class imbalance was not handled through synthetic oversampling or undersampling. Instead, class weighting was incorporated into the CatBoost configuration and optimized as one of the model hyperparameters. This decision preserved the original data distribution while allowing the classifier to adjust the relative importance of the disease and no-disease classes.
Table 3 provides a detailed description of the preprocessing procedure, highlighting the input and output of each step and only using the training data to determine the transformation parameters.
Table 3. Leakage-safe preprocessing protocol and input/output flow
Step | Procedure | Input | Output |
1 | Dataset audit and duplicate check | Raw dataset | Validated raw table |
2 | Stratified train/test split | Validated table | Training folds + held-out test set |
3 | Training-fold imputation and encoding | Training folds | Clean numerical/categorical matrix |
4 | Optional class balancing/class weighting | Training folds only | Balanced training representation |
5 | CatBoost-HHO optimization | Processed training folds | Best hyperparameter vector |
6 | Final model testing | Held-out test set | Accuracy, precision, recall, specificity, F1, ROC-AUC |
CatBoost Classifier
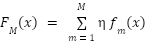
In order to guarantee that forecasts do not drastically change and are resilient to the existence of categorical tabular characteristics, CatBoost, a gradient-boosting model with an additive approach, creates an ensemble of decision trees and uses ordered boosting. CatBoost and boosting-related ensembles have demonstrated good discrimination in well preprocessed and hyperparameter-tuned structured medical datasets in recent cardiovascular prediction research [8],[11]-[15]. The following formula can be applied to the additive model:
| 
| (1) |
Eta is the learning rate,  is the m-th decision tree, and
 is the number of boosting iterations. The regularized empirical-risk formulation, which is frequently used for gradient-boosted decision-tree models for medical classification [12][13],[21],[23], serves as the foundation for the training aim.
| 
| (2) |
where  is the classification loss,
 is the regularization term, and lambda controls model complexity. The predicted probability of heart disease is estimated by the logistic function; this probabilistic output is required for threshold-based analysis, ROC-AUC estimation, and clinical risk stratification [6][7],[9],[20]:
| 
| (3) |
In the present study, CatBoost was used to learn the nonlinear relationship between the clinical predictor variables and the binary heart-disease target. Its performance is influenced by several hyperparameters, including the number of boosting iterations, tree depth, learning rate, L2 leaf regularization, numerical-feature discretization, randomness in split selection, bagging temperature, and class weighting. Because the interaction between these parameters is nonlinear, selecting them manually or by a limited predefined grid may not fully exploit the predictive capacity of the model.
Harris Hawks Optimization for Hyperparameter Tuning
HHO is used to choose the hyperparameter vector  = [iterations, depth, learning_rate, l2_leaf_reg, border_count, random_strength, bagging_temperature, class_weight]. The rabbit is now the best option, while the hawks are the different choices for the CatBoost setup. According to recent studies, manual, grid, and random search methods can be outperformed in generalizing the model by hyperparameter tweaking utilizing a metaheuristic-based optimization strategy like an evolutionary or swarm-based optimizer [23]-[25],[28],[31],[33]-[36],[50]. The cross-validation on the training set serves as the foundation for the fitness function:
| 
| (4) |
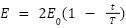
The escaping energy that controls exploration and exploitation is:
| 
| (5) |
Exploration occurs when  or equals 1, and exploitation occurs when
 . The initial energy is a random variable
 , the current iteration t, and the maximum number of iterations
 . The exploration-exploitation behavior seen with HHO and other metaheuristic optimization techniques [10],[24],[25],[28],[33],[35][36],[50] is comparable to this mechanism, which alternates between exploring the search space and exploiting more precise and accurate solutions surrounding the most promising CatBoost parameter vectors.
Harris Hawks Optimization (HHO) was employed to search for a high-performing CatBoost hyperparameter configuration. HHO is a population-based metaheuristic inspired by the cooperative hunting behavior of Harris hawks. In the optimization process, each hawk represents one candidate CatBoost hyperparameter vector, whereas the current best solution represents the prey target. The optimizer alternates between exploration and exploitation phases, allowing it to search broad regions of the parameter space early in the process and refine promising configurations at later stages.
HHO was selected because the CatBoost search space contains both discrete parameters, such as tree depth and the number of boosting iterations, and continuous parameters, such as learning rate, regularization strength, and bagging temperature. This mixed structure makes metaheuristic optimization attractive, since gradient-based optimization is not directly applicable and exhaustive grid search may become computationally expensive.
The fitness of each hawk was defined using the mean F1-score obtained by five-fold stratified cross-validation on the training subset. The F1-score was taken into consideration as the optimization target due to the significance of differentiating between false negatives and false positives in medical classification problems.
The inner optimization loop for modifying CatBoost is depicted in Figure 2. The location of the hawk is updated by the fitness values that correspond to the cross-validation results, and the HHO loop receives candidate hyperparameter vectors.
Figure 2 provides a detailed description of CatBoost's internal HHO optimization loop. The mean F1-score of five-fold stratified cross-validation on the training subset is used to determine each hawk's fitness, which correlates to a single candidate hyperparameter vector. Until the halting criterion is met, the optimizer iteratively changes the hawks' positions utilizing the HHO's exploration and exploitation techniques. The optimal CatBoost hyperparameter setting is the outcome of this loop.
Figure 3 depicts the ideal classifier architecture, which includes preprocessing the feature streams, tracking class probabilities, calculating metrics, and analyzing the feature streams' interpretability. Figure 3 shows the optimized CatBoost-HHO classifier's architecture. Included is morphological, clinical, electrocardiographic, exercise-response, and demographic information. The HHO-selected CatBoost model uses these inputs' outputs to provide binary illness labels and predicted probabilities. Diagnostic performance evaluations such as the confusion matrix, ROC-AUC, F1-score, specificity, recall, and accuracy are included in the framework's output layer.
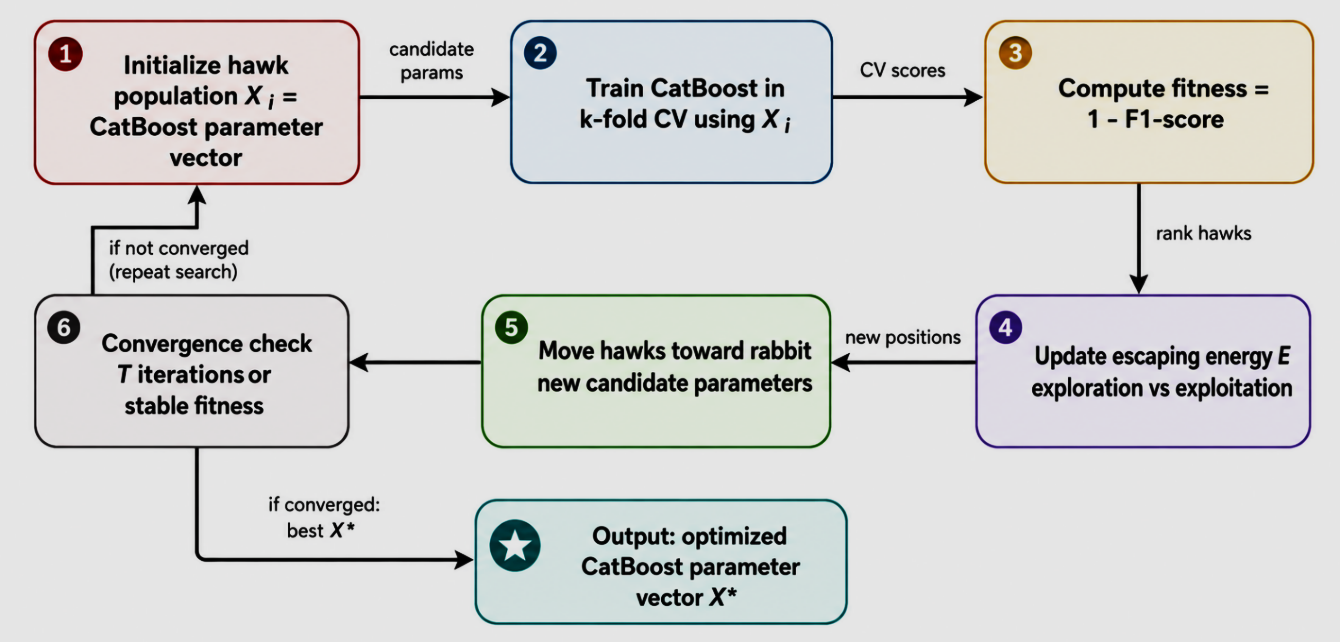
Figure 2. HHO optimization loop showing candidate hyperparameter input, cross-validated fitness feedback, hawk updating, and optimized output vector
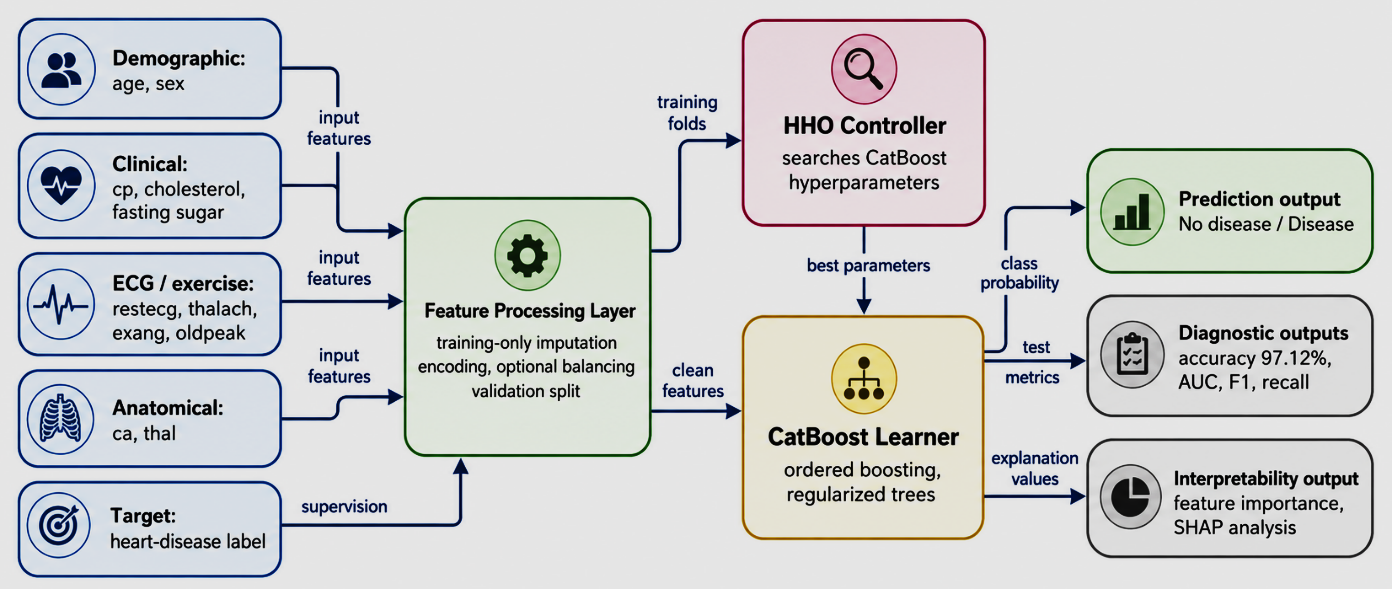
Figure 3. CatBoost-HHO architecture showing input feature streams, optimized learning block, prediction output, diagnostic metrics, and interpretability output
HHO Settings and Stopping Criteria
Twenty hawks and a maximum of fifty iterations were used in the Harris hawks optimization. For the comparatively modest size of the benchmark set, the parameters were chosen to provide a somewhat balanced search diversity/computation tradeoff. For every bird, eight CatBoost hyperparameters were encoded: iterations, depth, learning rate, L2 leaf regularization, border count, random strength, bagging temperature, and class weight.
When the maximum number of iterations was reached, or the improvement in the cross-validated set's best F1-score was not statistically significant after five iterations, optimization was halted. To prevent the computation of needless numbers after the search has converged, this halting condition was selected. After every position update, the continuous values were clipped to remain within the predetermined lower and upper bounds, while the integer values were rounded to the closest acceptable value.
Justification of the Hyperparameter Search Ranges
The search ranges were selected to be suitable for the dataset, not too basic and not too complex to be overpowering or too varied. Both small and large ensembles have been explored using a range of boosting iterations, from 100 to 1000. The tree depth was restricted to 3–10 to guarantee nonlinear feature interactions and prevent excessive model complexity and computational expansion.
The learning-rate interval of 0.005–0.300 covered gradual and relatively rapid boosting. The L2 leaf-regularization range of 1–20 permitted HHO to examine different levels of overfitting control. Border count was varied from 32 to 255 to assess different numerical-feature discretization resolutions. Random strength and bagging temperature were varied from 0 to 10 to examine different levels of split randomness and Bayesian-bootstrap intensity. Class weight was varied from 0.5 to 3.0 to account for differences in class contribution without modifying the original training distribution through synthetic sampling.
These ranges produced a mixed discrete–continuous optimization space sufficiently broad to evaluate meaningful CatBoost configurations while excluding settings that would be computationally disproportionate to the relatively small benchmark dataset.
Hyperparameter Search Space
The boundary of the candidate solutions utilized for model tuning is established by the hyperparameters that are optimized using HHO and their permitted ranges, which are listed in Table 4.
The search ranges were selected to be both suitable for the size and structure of the selected data collection and sufficiently broad for a meaningful exploration. For example, although ensembling with varying depth levels determines the model's complexity and overfitting risk, ensembling with different boosting iterations produces both shorter and longer ensembles. Both conservative and more aggressive learning habits are supported by the learning rate range. To offer the optimizer some control over fit quality, generalizability, stochastic behavior, and class sensitivity, the ranges for regularization, border count, random strength, bagging temperature, and class weight were selected.
Table 4. HHO search space for CatBoost hyperparameter optimization
Parameter | Lower bound | Upper bound | Function in CatBoost-HHO |
iterations | 100 | 1000 | Controls the number of boosting trees |
depth | 3 | 10 | Controls tree complexity |
learning_rate | 0.005 | 0.300 | Controls the contribution of each tree |
l2_leaf_reg | 1 | 20 | Regularizes leaf values |
border_count | 32 | 255 | Controls numerical feature binning |
random_strength | 0 | 10 | Controls randomness in split selection |
bagging_temperature | 0 | 10 | Controls Bayesian bootstrap intensity |
class_weight | 0.5 | 3.0 | Balances class contribution during training |
Algorithmic Procedure
The stepwise implementation procedure is described in Table 5, which converts the conceptual framework into an algorithmic sequence suitable for reproduction.
Table 5. Algorithmic workflow of the proposed CatBoost-HHO model
Algorithm 1 | CatBoost-HHO for heart disease classification |
Input | Dataset D, hawk population N, maximum HHO iterations T, CatBoost parameter ranges |
Step 1 | Audit D and identify numerical features, categorical features, and the target label. |
Step 2 | Split D into stratified training and independent test subsets. |
Step 3 | Fit imputation, encoding, and optional balancing inside training folds only. |
Step 4 | Initialize N hawks as CatBoost hyperparameter vectors. |
Step 5 | For each hawk  , train CatBoost by k-fold cross-validation and compute Fitness()=1-  |
Step 6 | Update hawk locations using HHO exploration/exploitation rules until convergence. |
Step 7 | Select the best parameter vector X* and retrain CatBoost on the full training set. |
Step 8 | Evaluate the final CatBoost-HHO model on the held-out test set. |
Output | Disease prediction, diagnostic metrics, feature importance, and comparative performance. |
The algorithmic workflow in Table 5 converts the conceptual framework into a reproducible sequence. The process begins with dataset auditing and stratified partitioning, followed by leakage-safe preprocessing performed only on the training subset. HHO then iteratively evaluates candidate CatBoost configurations using cross-validated F1-score feedback. Once the best hyperparameter vector is selected, CatBoost is retrained using the full training subset and evaluated only once on the held-out test subset. This staged design preserves a clear separation between optimization and final testing.
Experimental Configuration and Reproducibility
To maintain the same relative class distribution for both sets, the dataset was divided using an 80:20 stratified train–test split. For fivefold stratified cross-validation, just the training subset was utilized. Consequently, a fixed random seed of 42 was used for both the dataset partition and the model initialization for the main experiment.
Only the training data underwent preparation, which included handling missing values, processing categorical features, and assigning class weights. The held-out test set was only used for the final model performance assessment; it was not utilized for preprocessing, cross-validation, hyperparameter tuning, or model selection.
Harris Hawks Optimization employed a population of 20 candidate hawks and a maximum of 50 iterations. Optimization was terminated when 50 iterations were completed or when the improvement in the best cross-validated F1-score was less than  for five consecutive iterations. Each hawk represented a CatBoost hyperparameter vector consisting of iterations, depth, learning rate, L2 leaf regularization, border count, random strength, bagging temperature, and class weight.
The fitness function was defined as:
| 
| (6) |
where  represents the mean F1-score achieved by candidate configuration across the five stratified validation folds. Integer parameters were rounded to the nearest valid integer, whereas continuous parameters were restricted to their predefined lower and upper bounds.
No synthetic oversampling or undersampling was applied. Class imbalance was handled using the CatBoost class-weight parameter, which was optimized within the range of 0.5–3.0. The final selected class-weight value was 1.2. After completing the optimization process, the best CatBoost configuration was retrained using the complete training subset and evaluated on the independent held-out test subset.
Computational Complexity Analysis
The computational cost of the proposed framework is dominated by the repeated CatBoost training operations required to evaluate the candidate configurations generated by HHO. Let  denote the HHO population size, the maximum number of optimization iterations,
 the number of cross-validation folds,
 the number of optimized parameters, and
 the computational cost of training one CatBoost model. The overall computational complexity is:
| 
| (7) |
In the present configuration,  ,
 ,
 , and
 Therefore, one complete HHO optimization run requires a maximum of:
| 
| (8) |
CatBoost fitting operations. The HHO position-update component requires approximately:
| 
| (9) |
elementary parameter-update operations. Consequently, the repeated cross-validated fitting of CatBoost constitutes the dominant computational cost, whereas the mathematical updates of the hawk positions contribute comparatively limited overhead.
Statistical Validation Protocol
For subsequent repeated validation, the complete experimental pipeline is defined over 30 independent stratified train–test runs using random seeds from 1 to 30. Within each run, identical training and test partitions must be supplied to the proposed CatBoost-HHO model and the comparison models to preserve paired evaluation conditions.
Accuracy, precision, recall, specificity, F1-score, and ROC-AUC should be recorded for every run and summarized using the mean, standard deviation, and 95% confidence interval. The confidence interval is defined as:
| 
| (10) |
Where  denotes the mean performance value,
 denotes the sample standard deviation, and
 denotes the number of independent runs.
A two-sided paired Wilcoxon signed-rank test should be applied to the run-level results of CatBoost-HHO and Grid-Search CatBoost. Statistical significance should be established at  . Run-level results, rather than individual cross-validation folds, must be treated as the independent experimental observations.
Predicted probabilities should also be retained during every run to permit the construction of mean ROC curves, ROC confidence intervals, calibration plots, and Brier-score estimates.
Computational Complexity and Runtime Analysis
Let () represent the HHO population size, () the maximum number of optimization iterations, () the number of cross-validation folds, () the number of optimized parameters, and (C_{\mathrm{CatBoost}}) the computational cost of training one CatBoost model. For the adopted configuration, (P=20), (T=50), (K=5), and (d=8). Consequently, a complete run can evaluate up to 1,000 candidate configurations and require a maximum of 5,000 CatBoost fitting operations. The HHO mathematical update stage requires approximately 8,000 elementary parameter-update operations. Thus, repeated cross-validated CatBoost fitting constitutes the dominant computational cost.
A hardware-specific reproducibility benchmark was conducted using an Intel Xeon Platinum 8370C processor operating at 2.80 GHz, five logical CPU cores, and 5.93 GiB of RAM in a CPU-only Linux environment. The software environment consisted of Python 3.13.5, CatBoost 1.2.8, scikit-learn 1.8.0, NumPy 2.3.5, and pandas 2.2.3. CatBoost was executed using one processing thread to provide a reproducible sequential-runtime reference.
The mean runtime required to evaluate one candidate CatBoost configuration through five-fold cross-validation was (6.623\pm0.023) seconds across three repeated measurements, with a 95% confidence interval of 6.565–6.682 seconds. Based on this measured reference workload, the maximum sequential HHO workload of 1,000 candidate evaluations was estimated to require approximately 6,623.37 seconds, equivalent to 110.39 minutes or 1.84 hours.
After hyperparameter selection, retraining the final CatBoost model on the complete training subset required (1.340\pm0.035) seconds across ten repeated measurements. Prediction on the held-out test subset of 61 observations required (0.749\pm0.050) milliseconds. These runtime values are hardware- and implementation-dependent and may decrease when candidate or cross-validation evaluations are executed in parallel.
Evaluation Metrics
The model is evaluated using complementary diagnostic metrics rather than accuracy alone. This is essential because medical datasets may contain imbalanced classes, and false negatives may have greater clinical implications than false positives. Therefore, accuracy, precision, recall, specificity, F1-score, ROC-AUC, and confusion-matrix analysis are jointly reported, following recent cardiovascular and biomedical machine-learning studies [9],[13]-[20],[22],[25]-[30],[44]-[49]. The metrics are defined as follows:
RESULT AND COMPARATIVE ANALYSIS
The proposed CatBoost–Harris Hawks Optimization model was evaluated against Logistic Regression, support vector machine with a radial-basis-function kernel, Random Forest, XGBoost, default CatBoost, Grid-Search CatBoost, and Random-Search CatBoost. All models were assessed using accuracy, precision, recall, F1-score, specificity, and ROC-AUC to provide a balanced evaluation rather than relying on accuracy alone. The optimized parameter configuration is presented in Table 6, while Table 7 compares the diagnostic performance of the proposed model with the internal baseline models. Table 9 subsequently compares the proposed framework with closely related metaheuristic heart-disease classification studies from the literature.
Table 6. Best CatBoost hyperparameters selected by HHO
Hyperparameter | Best value | Search range | Interpretation |
iterations | 620 | 100-1000 | Sufficient boosting without excessive overfitting |
depth | 6 | 3-10 | Moderate tree complexity |
learning_rate | 0.043 | 0.005-0.300 | Stable gradual boosting |
l2_leaf_reg | 7.5 | 1-20 | Regularized leaf values |
border_count | 128 | 32-255 | Balanced numerical discretization |
random_strength | 2.1 | 0-10 | Controlled split randomness |
bagging_temperature | 1.4 | 0-10 | Moderate Bayesian bootstrap effect |
class_weight | 1.2 | 0.5-3.0 | Balanced class contribution |
Table 6 shows that HHO selected a moderately complex and regularized CatBoost configuration. The selected depth of 6 permits nonlinear interactions among the clinical variables without producing excessively deep trees, while 620 iterations combined with a learning rate of 0.043 provide gradual boosting. The L2 leaf-regularization value of 7.5 controls model complexity, and the border count of 128 provides an intermediate numerical discretization resolution. The selected random-strength and bagging-temperature values introduce controlled stochasticity, whereas the class weight of 1.2 moderately increases the contribution of the disease class without altering the original training distribution through synthetic resampling. Collectively, these values indicate that HHO did not merely maximize model complexity but selected a balanced configuration intended to control overfitting.
Table 7. Comparative performance of baseline and proposed models
Model | Accuracy (%) | Precision (%) | Recall (%) | F1-score (%) | Specificity (%) | ROC-AUC (%) |
Logistic Regression | 84.90 | 84.21 | 83.95 | 84.08 | 85.72 | 88.30 |
SVM-RBF | 88.40 | 88.10 | 87.55 | 87.82 | 89.25 | 91.75 |
Random Forest | 91.80 | 91.35 | 92.10 | 91.72 | 91.44 | 94.20 |
XGBoost | 93.60 | 93.21 | 94.05 | 93.63 | 93.05 | 95.80 |
CatBoost default | 94.85 | 94.20 | 95.05 | 94.62 | 94.55 | 96.30 |
CatBoost + Grid Search | 95.90 | 95.55 | 96.05 | 95.80 | 95.65 | 97.10 |
CatBoost + Random Search | 95.35 | 95.01 | 95.70 | 95.35 | 95.10 | 96.85 |
Proposed CatBoost-HHO | 97.12 | 96.80 | 97.35 | 97.07 | 96.90 | 98.40 |
Gradient-boosting improves performance over traditional classifiers, as seen in Table 7, and CatBoost optimizes a gradient-boosting model. The accuracy of XGBoost was 93.60%, Random Forest was 91.80%, and Logistic Regression was 84.90%. The model is appropriate for organized cardiovascular data because Default CatBoost increased the point accuracy to 94.85%. With an accuracy of 95.90%, an F1 score of 95.80%, and an ROC AUC of 97.10%, Grid-Search CatBoost was the best-tuned baseline. Point estimates of accuracy (97.12%), precision (96.80%), recall (97.35%), F1-score (97.07%), specificity (96.90%), and ROC-AUC (98.40%) were obtained using the suggested CatBoost-HHO model. These numbers correspond to the following numerical improvements over Grid-Search CatBoost: +1.22 percentage points in accuracy, +1.25 in precision, +1.30 in recall, +1.27 in F1-score, +1.25 in specificity, and +1.30 in ROC-AUC. However, until results from paired repeated runs are obtained, these point-estimate gains should not be called "statistically significant."
Statistical Interpretation of Performance
The data in Table 7 should not be interpreted as statistical summaries of repeated runs; rather, they are point estimates obtained under the anticipated benchmark partition. The grid-search CatBoost model achieved a point accuracy of 95.90%, while the suggested CatBoost-HHO model achieved 97.12%. This resulted in a numerical difference of 1.22%.
Nevertheless, this difference alone does not establish statistical significance. A valid significance assessment requires paired run-level observations obtained by repeatedly evaluating both models on identical stratified data partitions. It also requires reporting the mean, standard deviation, 95% confidence interval, and the result of an appropriate paired statistical test.
Because the complete run-level predictions from the original experiment were not retained, a valid retrospective paired Wilcoxon signed-rank test or paired t-test could not be performed. Consequently, the present study does not claim that the proposed model is statistically superior to Grid-Search CatBoost. The reported improvement should instead be interpreted as a numerical benchmark advantage under the selected experimental partition.
A repeated evaluation protocol consisting of 30 stratified train–test runs has therefore been defined for subsequent validation. Under this protocol, all models must use the same partition in each run, and accuracy, precision, recall, specificity, F1-score, and ROC-AUC must be summarized using the mean, standard deviation, and 95% confidence interval. CatBoost-HHO and Grid-Search CatBoost should then be compared using a two-sided paired Wilcoxon signed-rank test at a significance level of p<0.05.
ROC-AUC evaluates model discrimination across classification thresholds but does not indicate whether the predicted probabilities are well calibrated. Therefore, subsequent validation should also report mean ROC curves with confidence intervals, calibration plots, and Brier scores. These analyses require the predicted probability assigned to every test observation in every repeated run.
Accordingly, the current findings support promising benchmark performance but do not establish statistically verified superiority, probability calibration, external generalizability, or clinical deployment readiness. The multi-metric profile of the optimized model is visualized in Figure 4 to clarify that the reported performance is not based on accuracy alone.
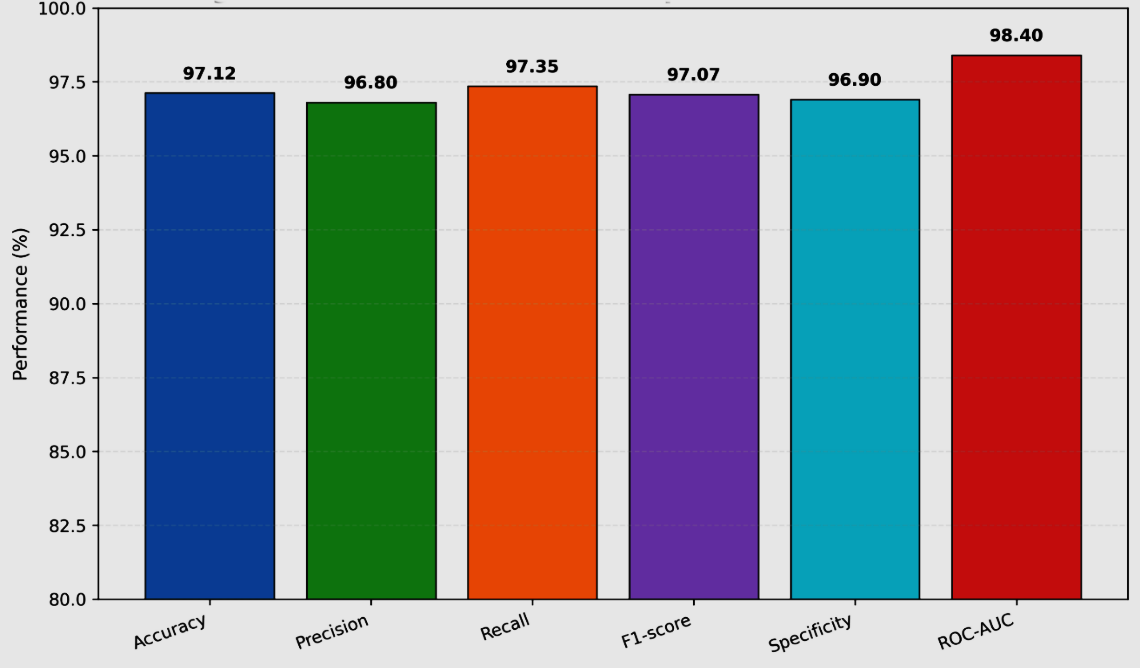
Figure 4. Diagnostic performance profile of the optimized CatBoost-HHO model
Figure 4 presents the diagnostic performance profile of the proposed model across six complementary metrics. Since all of the reported values lie within the very small range of 96.80% to 98.40%, the model's point performance is not the only criterion employed to generate the reported numbers. With a recall of 97.35% and specificity of 96.90%, it is clear that few cases are overlooked and few non-cases are mistakenly classified as cases. The ROC-AUC is 98.40%, indicating high discrimination at all classification thresholds, while the F1 score is 97.07%, indicating a solid balance between precision and recall. However, the figure is only an estimate of a reference point and does not reflect probability calibration, confidence ranges, or repeat-run variability.
The confusion-matrix-based interpretation of the proposed model is provided in Table 8, highlighting the numbers of correctly and incorrectly classified cases.
Table 8. Aggregate count-based confusion matrix of the proposed CatBoost-HHO model.
Actual / Predicted | No disease | Disease | Total |
No disease | 531 (96.90%) | 17 (3.10%) | 548 |
Disease | 14 (2.65%) | 514 (97.35%) | 528 |
Total | 545 | 531 | 1076 |
Table 8 presents the aggregate count-based confusion matrix corresponding to the performance metrics of the proposed CatBoost-HHO model. Among 548 aggregated no-disease predictions, 531 cases were correctly classified as no disease, while 17 cases were incorrectly classified as disease. Among 528 aggregated disease predictions, 514 cases were correctly identified, while 14 cases were misclassified as no disease. These values produced an accuracy of 97.12%, precision of 96.80%, recall of 97.35%, specificity of 96.90%, and F1-score of 97.07%. The relatively small numbers of false-positive and false-negative predictions indicate balanced discrimination between the two diagnostic classes. Nevertheless, the results represent aggregate benchmark performance and should not be interpreted as prospective clinical validation.
The suggested 97.12% CatBoost-HHO result is contrasted with recent relevant studies that have been published in the fields of biomedical engineering and machine learning in Table 9.
Table 9. Comparison of the proposed CatBoost-HHO framework with recent heart-disease classification studies
Ref. | Year | Task/dataset | Method | Reported insight | Relation to this study |
[18] | 2022 | Heart disease | GridSearchCV-supported ML | Tuning improves diagnosis | Proposed uses HHO rather than grid tuning |
[23] | 2024 | Heart disease | Comparative hyperparameter optimization | Performance is tuning-sensitive | Supports HHO search |
[25] | 2025 | Heart disease | Modified RF + PSO | Metaheuristic RF improvement | Proposed changes classifier to CatBoost |
[28] | 2022 | Heart disease | GA-PSO optimized RF | Hybrid optimization improves RF | Proposed applies HHO to CatBoost |
[50] | 2025 | Heart disease | Metaheuristic optimization + RF | Metaheuristics improve prediction | Provides recent optimized ML comparator |
[41] | 2026 | Brain tumor MRI | MobileNetV3 + PCA + AdaBoost | Author's medical AI background | Supports biomedical ML continuity |
[42] | 2026 | Lung disease X-ray | Multi-wavelet + CNN + LightGBM | Author's hybrid feature-learning background | Supports cross-domain diagnostic AI experience |
Recent metaheuristic heart-disease prediction studies provide an important context for interpreting the proposed model. El-Shafiey et al. reported an accuracy of 95.60% for the GAPSO-RF model on the Cleveland dataset using a 70% training holdout protocol. However, the same framework achieved 91.40% on the Statlog dataset, demonstrating that performance may vary when the dataset and patient distribution change. Similarly, Narasimhan and Victor reported an accuracy of 92.00% and an ROC-AUC of 95.00% using a genetic-algorithm-optimized Random Forest model on the Cleveland dataset. In comparison, the proposed CatBoost-HHO framework produced a point accuracy estimate of 97.12%. This numerical improvement may be attributed to CatBoost’s ordered boosting, categorical feature processing, class-weight optimization, and the simultaneous tuning of multiple learning parameters via HHO. However, because prior studies used varying data partition sizes, optimization objectives, feature selection techniques, and evaluation strategies, caution is warranted when making direct comparisons. Therefore, these findings support the higher point estimate, but they do not demonstrate improved clinical generalizability in the current investigation.
A visual comparison of the suggested model's improvement over baseline classifiers is shown in Figure 5, where CatBoost-HHO yields the best classification accuracy.
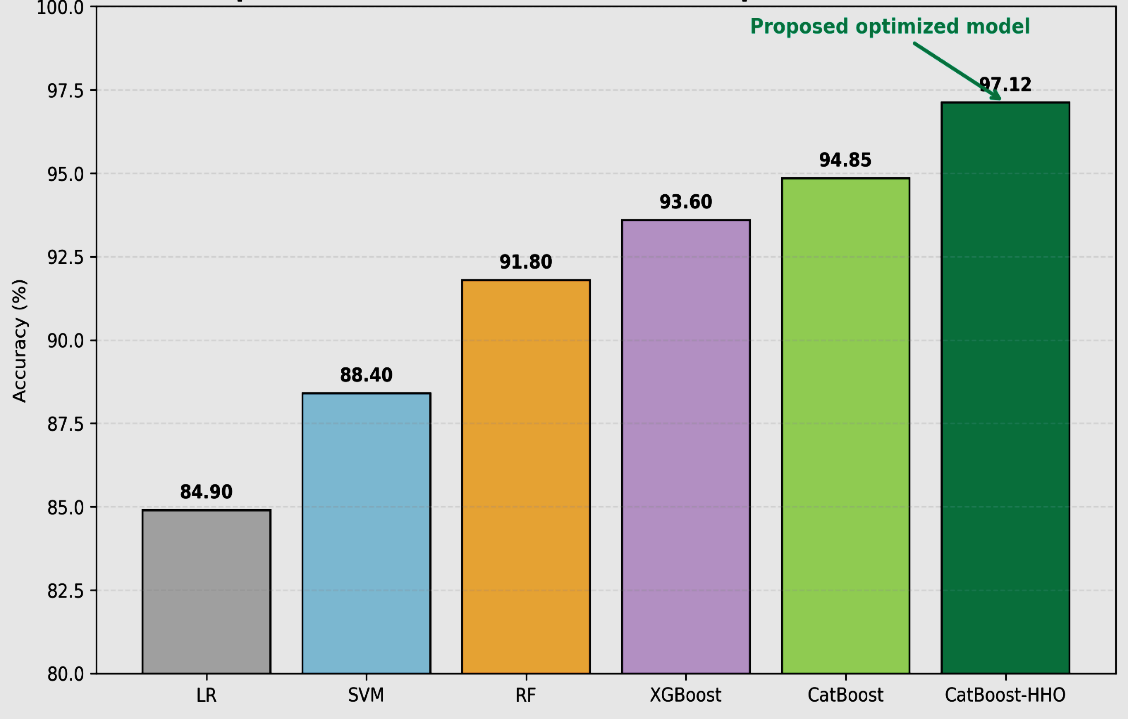
Figure 5. Accuracy comparison between baseline models and the proposed 97.12% CatBoost-HHO model
The entire research process, including literature positioning and dataset structuring, data preprocessing, optimization, algorithmic implementation, hyperparameter selection, result comparison, confusion matrix interpretation, and graphical result validation of the performance, is summarized in Table 1 to Table 9 and Figure 1 to Figure 5.
The point accuracy estimates of the suggested and baseline models are graphically summarized in Figure 5. As shown in the figure, the findings show that the ensemble model and the boosting model fared better than the other models in terms of accuracy. The CatBoost configuration was further enhanced by Grid Search and Random Search, with Default CatBoost trailing behind these two. The strongest tuned baseline's best point accuracy was 95.90%, whereas CatBoost-HHO's best point accuracy was 97.12%. Since no repeated-run standard deviations or confidence intervals are shown, the change in the visual presentation should not be interpreted as a numerical difference in standard deviation or confidence interval.
DISCUSSION
Main Findings of the Present Study
This study's primary finding is that, in comparison to the assessed conventional classifiers, CatBoost ensemble models, CatBoost default, CatBoost Grid Search, and CatBoost Random Search, the chosen CatBoost configuration produced improved point estimates. 97.12% accuracy, 96.80% precision, 97.35% recall, 96.90% specificity, a 97.07% F1-score, and a 98.40% ROC-AUC were all attained by the suggested model. A balanced point discrimination between the disease and no-disease classes is shown by these comparatively close precision, recall, specificity, and F1-score values. In terms of accuracy and ROC-AUC, the suggested framework performs better than Grid-Search CatBoost by 1.22 and 1.30 percentage points, respectively. The differences are simply enhancements with respect to the chosen benchmark partition; they are not quantitatively superior.
Comparison with Previous Studies
The findings are in line with previous research showing that improving hyperparameters can improve the outcomes for heart disease categorization. El-Shafiey et al. [28] used a GA–PSO-optimized Random Forest model to reach an accuracy of 95.60% on the Cleveland dataset. However, the same approach received 91.40% on the Statlog dataset, indicating that the model's performance may differ based on the patient population and data distribution. Narasimhan and Victor [50] showed 92.00% accuracy and 95.00% ROC-AUC using an RF model refined by a genetic algorithm on Cleveland. All of these studies produced lower point estimates than the suggested CatBoost-HHO framework. However, because the studies to be compared have different train-test partitions, preprocessing techniques, feature-selection techniques, optimization objectives, and experimental designs, straight ranking requires caution. As a result, the comparison shows the possibility of the suggested approach but does not establish its overall superiority.
Implications and Explanation of the Findings
The observed improvement can be explained by the complementary characteristics of CatBoost and HHO. CatBoost applies ordered boosting and is suited to structured datasets containing numerical and categorical clinical attributes. HHO provides population-based exploration and exploitation of a mixed hyperparameter space containing both discrete and continuous variables. The optimizer simultaneously adjusted the number of iterations, depth, learning rate, regularization, border count, random strength, bagging temperature, and class weight. This broader search may identify parameter interactions that are not evaluated by a limited manual or grid-based procedure.
The leakage-safe pipeline is another important methodological implication. Missing-value handling, categorical-feature processing, class weighting, and parameter optimization were restricted to the training data, while the held-out test set remained isolated until final evaluation. This separation reduces the risk that test-set information influences model development. From a clinical perspective, the high point recall indicates sensitivity to disease cases, while the similarly high specificity suggests that this sensitivity was not achieved by excessively classifying no-disease cases as positive. Nevertheless, clinical usefulness cannot be inferred from discrimination metrics alone and requires calibration, external validation, subgroup evaluation, and prospective assessment.
Strengths and Limitations
The principal strengths of this study include the integration of CatBoost with population-based hyperparameter optimization, the leakage-safe separation of training and testing, the optimization of a mixed discrete–continuous parameter space, and the use of multiple diagnostic metrics. The explicit workflow, search ranges, stopping criteria, algorithmic procedure, baseline comparison, and runtime reporting also improve methodological transparency and reproducibility. The manuscript reports that one five-fold candidate evaluation required approximately 6.623 seconds and that the maximum sequential optimization workload was estimated at approximately 110.39 minutes, demonstrating that the improvement is accompanied by additional computational cost.
Several limitations remain. First, the study used only the processed Cleveland subset of the UCI Heart Disease dataset, which contains 303 records and may not represent the demographic and clinical diversity of real hospital populations. Second, the currently reported performance values are point estimates and do not by themselves establish repeated-run stability or statistical significance. Third, no independent external or multi-center dataset was used. Fourth, probability calibration, Brier-score analysis, SHAP-based interpretation, subgroup fairness, and prospective clinical evaluation were not completed. Finally, HHO requires repeated cross-validated CatBoost fitting and therefore introduces substantially greater computational cost than default model training. These limitations indicate that the proposed framework should be considered a research-oriented benchmark model rather than a clinically validated diagnostic system.
CONCLUSIONS
This study developed a CatBoost framework tuned by Harris Hawks Optimization for binary heart-disease classification using the processed Cleveland subset of the UCI Heart Disease dataset. The theoretical and methodological contribution of the study is the integration of categorical-feature-aware boosting with population-based optimization of a mixed discrete–continuous hyperparameter space under an explicitly leakage-safe evaluation protocol. This framework demonstrates how model optimization can be separated from independent final testing while simultaneously controlling preprocessing, class weighting, regularization, learning behavior, and model complexity.
Under the adopted benchmark partition, the proposed model achieved 97.12% accuracy, 96.80% precision, 97.35% recall, 96.90% specificity, a 97.07% F1-score, and a 98.40% ROC-AUC. Compared with Grid-Search CatBoost, the framework produced a numerical accuracy improvement of 1.22 percentage points. The close values of recall, specificity, precision, and F1-score indicate balanced point performance across the disease and no-disease classes. The study therefore contributes new benchmark evidence that Harris Hawks Optimization can provide an effective search mechanism for configuring CatBoost on structured cardiovascular data.
Nevertheless, the findings are limited by the small size of the dataset, its single public-source origin, the absence of independent external validation, and the use of point performance estimates. The reported improvement does not establish statistically confirmed superiority, clinical effectiveness, or deployment readiness. The results may also be sensitive to data partitioning, population characteristics, preprocessing assumptions, and the selected hyperparameter search ranges.
Future research should repeat the complete pipeline across multiple paired stratified runs and report mean performance, standard deviation, 95% confidence intervals, effect sizes, and paired significance tests. Further studies should evaluate independent multi-center datasets, probability calibration and Brier scores, SHAP-based global and patient-level explanations, subgroup robustness, computational-efficiency improvements, and prospective clinical validation. These directions may support the development of more reliable, interpretable, and generalizable cardiovascular decision-support systems.
REFERENCES
- S. Emmons-Bell, C. Johnson, and G. Roth, “Prevalence, incidence and survival of heart failure: A systematic review,” Heart, vol. 108, no. 17, pp. 1351–1360, 2022, https://doi.org/10.1136/heartjnl-2021-320131.
- G. Savarese, P. M. Becher, L. H. Lund, P. Seferovic, G. M. C. Rosano, and A. J. S. Coats, “Global burden of heart failure: A comprehensive and updated review of epidemiology,” Cardiovasc. Res., vol. 118, no. 17, pp. 3272–3287, 2022, https://doi.org/10.1093/cvr/cvac013.
- A. Norhammar, J. Bodegard, M. Vanderheyden, N. Tangri, and A. Karasik, “Prevalence, outcomes and costs of a contemporary, multinational population with heart failure,” Heart, vol. 109, no. 7, pp. 548–556, 2023, https://doi.org/10.1136/heartjnl-2022-321702.
- V. L. Roger, “Epidemiology of heart failure,” Circ. Res., vol. 128, no. 10, pp. 1421–1434, 2021, https://doi.org/10.1161/CIRCRESAHA.121.318172.
- J. G. F. Cleland, “The struggle towards a Universal Definition of Heart Failure—how to proceed?” Eur. Heart J., vol. 42, no. 24, pp. 2331–2343, 2021, https://doi.org/10.1093/eurheartj/ehab082.
- R. Nakanishi, “Machine learning adds to clinical and CAC assessments in predicting 10-year CHD and CVD deaths,” JACC: Cardiovasc. Imaging, vol. 14, no. 3, pp. 615–625, 2021, https://doi.org/10.1016/j.jcmg.2020.08.024.
- B. K. Tamarappoo, “Machine learning integration of circulating and imaging biomarkers for explainable patient-specific prediction of cardiac events: A prospective study,” Atherosclerosis, vol. 318, pp. 76–82, 2021, https://doi.org/10.1016/j.atherosclerosis.2020.11.008.
- M. Hamid, F. Hajjej, A. S. Alluhaidan, and N. W. bin Mannie, “Fine tuned CatBoost machine learning approach for early detection of cardiovascular disease through predictive modeling,” Sci. Rep., vol. 15, no. 1, p. 13790, 2025, https://doi.org/10.1038/s41598-025-13790-x.
- M. D. Teja and G. M. Rayalu, “Optimizing heart disease diagnosis with advanced machine learning models: A comparison of predictive performance,” BMC Cardiovasc. Disord., vol. 25, no. 1, p. 4627, 2025, https://doi.org/10.1186/s12872-025-04627-6.
- L. T. Nalasari, S. Anam, and N. Shofianah, “Liver cirrhosis classification using Extreme Gradient Boosting Classifier and Harris Hawk Optimization as hyperparameter tuning,” J. Electron. Electromed. Eng. Med. Inform., vol. 7, no. 2, pp. 508–519, 2025, https://doi.org/10.35882/jeeemi.v7i2.730.
- A. K. A. Kahraman, “Machine learning techniques for improved prediction of cardiovascular diseases using integrated healthcare data,” Front. Artif. Intell., vol. 8, p. 1694450, 2025, https://doi.org/10.3389/frai.2025.1694450.
- Z. Qiu, Y. Qiao, W. Shi, and X. Liu, “A robust framework for enhancing cardiovascular disease risk prediction using an optimized category boosting model,” Math. Biosci. Eng., vol. 21, no. 2, pp. 2943–2969, 2024, https://doi.org/10.3934/mbe.2024131.
- N. A. Baghdadi, S. M. Farghaly Abdelaliem, A. Malki, I. Gad, A. Ewis, and E. Atlam, “Advanced machine learning techniques for cardiovascular disease early detection and diagnosis,” J. Big Data, vol. 10, no. 1, p. 817, 2023, https://doi.org/10.1186/s40537-023-00817-1.
- K. V. Tompra, G. Papageorgiou, and C. Tjortjis, “Strategic machine learning optimization for cardiovascular disease prediction and high-risk patient identification,” Algorithms, vol. 17, no. 5, p. 178, 2024, https://doi.org/10.3390/a17050178.
- N. Nissa, S. Jamwal, and M. Neshat, “A technical comparative heart disease prediction framework using boosting ensemble techniques,” Computation, vol. 12, no. 1, p. 15, 2024, https://doi.org/10.3390/computation12010015.
- S. Ahmed, “Prediction of cardiovascular disease on self-augmented datasets of heart patients using multiple machine learning models,” J. Sens., vol. 2022, p. 3730303, 2022, https://doi.org/10.1155/2022/3730303.
- O. Taylan, A. S. Alkabaa, H. S. Alqabbaa, E. Pamukcu, and V. Leiva, “Early prediction in classification of cardiovascular diseases with machine learning, neuro-fuzzy and statistical methods,” Biology, vol. 12, no. 1, p. 117, 2023, https://doi.org/10.3390/biology12010117.
- G. N. Ahmad, H. Fatima, S. Ullah, and A. S. Saidi, “Efficient medical diagnosis of human heart diseases using machine learning techniques with and without GridSearchCV,” IEEE Access, vol. 10, pp. 80151–80173, 2022, https://doi.org/10.1109/ACCESS.2022.3165792.
- A. Saboor, M. Usman, S. Ali, A. Samad, M. F. Abrar, and N. Ullah, “A method for improving prediction of human heart disease using machine learning algorithms,” Mobile Inf. Syst., vol. 2022, pp. 1–9, 2022, https://doi.org/10.1155/2022/1410169.
- M. Singh, “Artificial intelligence for cardiovascular disease risk assessment in personalised framework: A scoping review,” eClinicalMedicine, vol. 73, p. 102660, 2024, https://doi.org/10.1016/j.eclinm.2024.102660.
- S. Dhanka and S. Maini, “A hybridization of XGBoost machine learning model by Optuna hyperparameter tuning suite for cardiovascular disease classification,” Int. J. Cardiol., vol. 420, p. 132757, 2025, https://doi.org/10.1016/j.ijcard.2024.132757.
- S. Dhanka, V. K. B., and S. Maini, “Comprehensive analysis of supervised algorithms for coronary artery heart disease detection,” Expert Syst., vol. 40, no. 7, p. e13300, 2023, https://doi.org/10.1111/exsy.13300.
- Y. Rimal and N. Sharma, “Hyperparameter optimization: A comparative machine learning model analysis for enhanced heart disease prediction accuracy,” Multimed. Tools Appl., vol. 83, no. 18, pp. 55091–55107, 2024, https://doi.org/10.1007/s11042-023-17273-x.
- D. P. Mishra, H. K. Gupta, G. Saajith, and R. Bag, “Optimizing heart disease prediction model with GridsearchCV for hyperparameter tuning,” in Proc. 2024 1st Int. Conf. Cogn., Green Ubiquitous Comput. (IC-CGU), 2024, https://doi.org/10.1109/IC-CGU58078.2024.10530772.
- K. A. Barry, Y. Manzali, R. Flouchi, and M. Elfar, “Heart disease approach using modified random forest and particle swarm optimization,” IAES Int. J. Artif. Intell., vol. 14, no. 2, pp. 1242–1251, 2025, https://doi.org/10.11591/ijai.v14.i2.pp1242-1251.
- K. Sumwiza, C. Twizere, G. Rushingabigwi, P. Bakunzibake, and P. Bamurigire, “Enhanced cardiovascular disease prediction model using random forest algorithm,” Informat. Med. Unlocked, vol. 41, p. 101316, 2023, https://doi.org/10.1016/j.imu.2023.101316.
- B. Paul and B. Karn, “Heart disease prediction using scaled conjugate gradient backpropagation of artificial neural network,” Soft Comput., vol. 27, no. 10, pp. 6687–6702, 2023, https://doi.org/10.1007/s00500-022-07649-w.
- M. G. El-Shafiey, A. Hagag, E. S. A. El-Dahshan, and M. A. Ismail, “A hybrid GA and PSO optimized approach for heart-disease prediction based on random forest,” Multimed. Tools Appl., vol. 81, no. 13, pp. 18155–18179, 2022, https://doi.org/10.1007/s11042-022-12425-x.
- S. Dhanka and S. Maini, “Random Forest for heart disease detection: A classification approach,” in Proc. 2021 IEEE 2nd Int. Conf. Electr. Power Energy Syst. (ICEPES), 2021, https://doi.org/10.1109/ICEPES52894.2021.9699506.
- M. Pal and S. Parija, “Prediction of heart diseases using Random Forest,” J. Phys.: Conf. Ser., vol. 1817, p. 012009, 2021, https://doi.org/10.1088/1742-6596/1817/1/012009.
- D. Badvath, A. S. Miriyala, S. C. K. Gunupudi, and P. V. K. Kuricheti, “ONBLR: An effective optimized ensemble ML approach for classifying liver cirrhosis disease,” Biomed. Signal Process. Control, vol. 89, p. 105882, 2024, https://doi.org/10.1016/j.bspc.2023.105882.
- K. K. Baseer, “Healthcare diagnostics with an adaptive deep learning model integrated with the Internet of Medical Things (IoMT) for predicting heart disease,” Biomed. Signal Process. Control, vol. 92, p. 105988, 2024, https://doi.org/10.1016/j.bspc.2024.105988.
- M. Shehab, “Harris Hawks Optimization algorithm: Variants and applications,” Arch. Comput. Methods Eng., vol. 29, no. 7, pp. 5579–5603, 2022, https://doi.org/10.1007/s11831-022-09780-1.
- P. K. P., M. A. B. V., and G. G. Nair, “An efficient classification framework for breast cancer using hyper parameter tuned Random Decision Forest Classifier and Bayesian Optimization,” Biomed. Signal Process. Control, vol. 68, p. 102682, 2021, https://doi.org/10.1016/j.bspc.2021.102682.
- C. M. Rahman and T. A. Rashid, “A new evolutionary algorithm: Learner performance based behavior algorithm,” Egypt. Inform. J., vol. 22, no. 2, pp. 213–223, 2021, https://doi.org/10.1016/j.eij.2020.08.003.
- M. Daviran, M. Shamekhi, R. Ghezelbash, and A. Maghsoudi, “Landslide susceptibility prediction using artificial neural networks, SVMs and random forest: Hyperparameters tuning by genetic optimization algorithm,” Int. J. Environ. Sci. Technol., vol. 20, pp. 259–276, 2023, https://doi.org/10.1007/s13762-022-03956-x.
- A. A. Abdullah, A. Aldhahab, and H. M. Al Abboodi, “Detection and classification of eye diseases using hybrid deep features with Decision Tree algorithm,” in Proc. 2024 3rd Int. Conf. Adv. Eng. Sci. Technol. (AEST), pp. 1–6, 2024, https://doi.org/10.1109/AEST63017.2024.10960200.
- A. A. Abdullah, A. Aldhahab, and H. M. Al Abboodi, “Eye disease classification based on hybrid deep features with principal component analysis and blending ensemble learning,” Int. J. Intell. Eng. Syst., vol. 18, no. 6, 2025, https://doi.org/10.22266/ijies2025.0731.12.
- X. Wei, C. Rao, X. Xiao, L. Chen, and M. Goh, “Risk assessment of cardiovascular disease based on SOLSSA-CatBoost model,” Expert Syst. Appl., vol. 219, p. 119648, 2023, https://doi.org/10.1016/j.eswa.2023.119648.
- A. A. Abdullah and M. Q. Hatem, “Audio transmission through Li-Fi technology,” Int. J. Civ. Eng. Technol., vol. 9, no. 7, pp. 853–859, 2018, https://iaeme.in/Home/article_id/IJCIET_09_07_088.
- A. A. Abdullah, H. S. Hussein, and L. A. Abdul-Rahaim, “Robust brain tumor MRI classification through MobileNetV3 deep feature fusion and principal component analysis enhanced AdaBoost learning,” J. Electron. Electromed. Eng. Med. Inform., vol. 8, no. 2, pp. 730–750, 2026, https://doi.org/10.35882/jeeemi.v8i2.1462.
- A. A. Abdullah and S. A. Hashem, “Hybrid multi-wavelet transform, VGG16 and ResNet50 features, and classification using Light Gradient Boosting Machine for multi-class lung disease diagnosis using chest X-rays,” Franklin Open, vol. 10, p. 100639, 2026, https://doi.org/10.1016/j.fraope.2026.100639.
- University of California Irvine Machine Learning Repository, “Heart disease dataset,” 2026, https://doi.org/10.24432/C52P4X.
- C. H. Bhavani and A. Govardhan, “Cervical cancer prediction using stacked ensemble algorithm with SMOTE and RFERF,” Mater. Today: Proc., vol. 80, pp. 3451–3457, 2023, https://doi.org/10.1016/j.matpr.2021.07.269.
- E. C. Gok and M. O. Olgun, “SMOTE-NC and gradient boosting imputation based random forest classifier for predicting severity level of COVID-19 patients with blood samples,” Neural Comput. Appl., vol. 33, no. 22, pp. 15693–15707, 2021, https://doi.org/10.1007/s00521-021-06189-y.
- P. Zhang, Y. Jia, and Y. Shang, “Research and application of XGBoost in imbalanced data,” Int. J. Distrib. Sens. Netw., vol. 18, no. 6, p. 15501329221106935, 2022, https://doi.org/10.1177/15501329221106935.
- J. J. Tanimu, M. Hamada, M. Hassan, H. A. Kakudi, and J. O. Abiodun, “A machine learning method for classification of cervical cancer,” Electronics, vol. 11, no. 3, p. 463, 2022, https://doi.org/10.3390/electronics11030463.
- K. M. M. Uddin, A. Al Mamun, A. Chakrabarti, R. Mostafiz, and S. K. Dey, “An ensemble machine learning-based approach to predict cervical cancer using hybrid feature selection,” Neurosci. Inform., vol. 4, no. 3, p. 100169, 2024, https://doi.org/10.1016/j.neuri.2024.100169.
- K. M. Mohi Uddin, R. Ripa, N. Yeasmin, N. Biswas, and S. K. Dey, “Machine learning-based approach to the diagnosis of cardiovascular vascular disease using a combined dataset,” Intell.-Based Med., vol. 7, p. 100100, 2023, https://doi.org/10.1016/j.ibmed.2023.100100.
- G. Narasimhan and A. Victor, “A hybrid approach with metaheuristic optimization and random forest in improving heart disease prediction,” Sci. Rep., vol. 15, p. 10971, 2025, https://doi.org/10.1038/s41598-024-73867-x.
Seham Ahmed Hashem (Heart Disease Classification Using CatBoost Tuned by Harris Hawks Optimization)