ISSN: 2685-9572 Buletin Ilmiah Sarjana Teknik Elektro
Vol. 8, No. 3, June 2026, pp. 765-780
Machine Learning Approaches for Binary Classification of Portion Size and Cooking Time in Indonesian Recipes
Devi Dwi Purwanto 1,2, Aji Prasetya Wibawa 1, Mazarina Devi 3
1 Department of Electrical Engineering and Informatics, Universitas Negeri Malang, Malang, East Java, Indonesia
2 Department of Informatics, Universitas Katolik Widya Mandala Surabaya, Surabaya, East Java, Indonesia
3 Departement of Culinary, Faculty of Vocational Studies, Universitas Negeri Malang, Malang, East Java, Indonesia
ARTICLE INFORMATION |
| ABSTRACT |
Article History: Received 18 February 2026 Revised 18 May 2026 Accepted 08 June 2026 |
| 
Estimating portion sizes and cooking times are goals for smart kitchen assistants, enabling better meal planning and reducing food waste due to over-portioning. Existing approaches in computational gastronomy often struggle to provide estimates from prepared ingredient data. This study uses XGBoost to extract features from a dataset containing 1,400 Indonesian recipes to predict binary classification targets for portion sizes and required cooking times. The dataset used for the prediction includes information on ingredients and their quantities, as well as preparation steps. In addition to the recipe dataset, the TKPI dataset is also used to help determine the category of food ingredients, protein content, and cooking technique complexity. This dataset is then further optimized with hyperparameters to maximize model performance. This paper conducted trials with 6 models where the best model for portion size had an accuracy of 0.7821 with a balanced accuracy of 0.4929, and an F1 Score of 0.8763, while the accuracy for cooking time was 0.6929 with a balanced accuracy of 0.6445, and an F1 Score of 0.7737. From the best model, it was found that the quantity of weighted ingredients and the distribution of ingredients per step were among the most influential features, while step-based and technique-based features were the most important features for cooking time. The contribution of this research is the development of an interpretable model for meal planning efficiency in culinary applications. These results indicate that feature aggregation combined with XGBoost provides actionable insights for smart kitchen assistants and recommendation systems. |
Keywords: XGBoost; Feature Engineering; Computational Gastronomy; Predictive Analytics; Indonesian Cuisine |
Corresponding Author: Aji Prasetya Wibawa, Department of Electrical Engineering and Informatics, Universitas Negeri Malang, Malang, Indonesia Email: aji.prasetya.ft@um.ac.id |
This work is open access under a Creative Commons Attribution-Share Alike 4.0 
|
Document Citation: D. D. Purwanto, A. P. Wibawa, and M. Devi, “Machine Learning Approaches for Binary Classification of Portion Size and Cooking Time in Indonesian Recipes,” Buletin Ilmiah Sarjana Teknik Elektro, vol. 8, no. 3, pp. 765-780, 2026, DOI: 10.12928/biste.v8i3.16013. |
INTRODUCTION
Predicting serving sizes and cooking times remains a significant challenge in culinary data science due to the variability in recipe ingredients and preparation methods. Recent studies have applied deep learning models on large-scale food datasets to estimate portion size from images [1][2]. This study focuses on addressing these challenges by utilizing machine learning to predict these key aspects from recipe data. The sheer number of recipe data generated by data-driven platforms in the modern digital world provides the means to discover novel cooking patterns through recipe process analysis. A key component of the process analysis is the prediction of recipe portion sizes and cooking times. The ability to make these predictions is extremely valuable in improving personalized services in the culinary world, such as recipe suggestions, kitchen organization, and meal planning through data assessment [3]-[5]. The sheer number of recipe data generated by data-driven platforms in the modern digital world provides the means to discover novel cooking patterns through recipe process analysis [6][7]. The ability to make these predictions is extremely valuable in improving personalized services in the culinary world, such as recipe suggestions, kitchen organization, and meal planning through data assessment [8].
Predicting portion sizes and cooking times from recipe text features with numerical outputs can be done with machine learning models due to their capacity to learn complex functions. One of the newer methods of recipe data analysis is a blend of culinary data analysis and machine learning, referred to as computational gastronomy, which aims to elucidate recipe prediction features [9][10]. This method, called predictive analytics, is capable of converting text features to structured data and containing the protein, step complexity, and methods of cooking along with the ingredient amounts. These structured data features allow precise predictions of cooking times and portion sizes, and thus the prediction of culinary analytics and recommendation services [11]. Recent advancements in recipe recommendation also utilize multimodal approaches in which prediction and recommendation are improved by integrating both text and images to personalize the recommendations [12]. In this context, machine learning models have been used to predict numerical variables such as cooking time and portion size, although the results still need improvement in terms of accuracy and generalizability [13], particularly in terms of accuracy and measurability. For example, machine learning has been applied to predict micronutrient profiles in food after processing, demonstrating the potential of predictive models in complex food systems [14], or the potential for predictive culinary analytics to extend to operational planning and personalized nutrition in food systems [15]. Similarly, studies have demonstrated that both visual–non‑visual factors such as ingredient usage patterns and recipe popularity have been shown to influence digital recipe attributes including popularity and ingredient usage patterns [16]. Other studies have focused on improving recipe features extraction using deep learning, such as optimizing ingredient recognition via direct F‑score optimization for ingredient recognition, which improves the accuracy of identifying ingredients and their relationships with the recipes [17]. Also, machine learning models have been proposed for short-term demand forecasting to reduce food waste in catering services, showing that predictive culinary analytics can be used to operational planning beyond particular recipes [18]. These findings underscore the necessity of merging advanced data analytics, text representation, and feature engineering for enhanced prediction capabilities in culinary applications.
Choi et al. [3] proposed the KitchenScale model for predicting ingredient quantities from recipe steps using NLP. However, this model does not address critical parameters such as cooking time and portion size, which are necessary for holistic meal planning though beneficial for ingredient prediction. We address this issue by integrating NLP with XGBoost to estimate cooking time and amount size, providing a more comprehensive solution for recipe recommendation. Another work by Ispirova et al. [19] has been done to estimate the nutritional content of the recipes by training a model on one dataset and verifying its generalizability. But it overlooks other important components such as cooking time and portion size, which are essential for practical kitchen applications like meal planning. We build on this by estimating also the cooking time and the size of a dish, combining structured and unstructured data to make best possible recipe recommendations in a more practical way. Furthermore, De Clercq et al. [20] built a machine learning model to anticipate missing recipe elements, but this method does not directly forecast cooking durations and portion sizes that depend on the interaction of the ingredients and the application of the cooking procedures. Our approach takes this into account by accounting for both cooking time and amount size, using deeper, structural variables such as cooking techniques and ingredient composition. Conversely, a systematic study by Tao et al. [21] investigated text mining and big data analytics in relation to recipe data analysis. Yet, their methods predominantly target textual data, lacking the integration of numerical data, which is essential for precise prediction of cooking time and portion size. Our work fills this gap by leveraging both textual and numerical data to predict both crucial recipe outcomes. Finally, Cabeza-Gil et al. [22] proposed a digital twin model that predicts cooking times based on sensor data and neural networks. This strategy is intriguing but is mainly based on sensor data and does not include textual recipe data, which offers vital information on processes and ingredient interactions. In this paper, we overcome this limitation by adding textual information to estimate the cooking duration and the serving size, opening up a wider potential for applications such as recipe recommendation and kitchen management.
The uniqueness of this study lies in the development of a predictive model. Unlike the conventional numerical analysis of recipe data, the model takes into account the structural element of recipe texts including ingredient and associated cooking methods to reflect the variability of output targets such as cooking time and servings. Ingredient names are extracted using fuzzy matching techniques with a threshold of > 90% similarity, ensuring accurate identification even when there are slight variations in spelling or phrasing. For quantities, the LLM Gemma 4:3B model is employed to interpret and predict ingredient amounts, while a portion conversion database is used to standardize servings across different recipes. Cooking methods are categorized based on their complexity and influence on cooking time, which are then used to help predict cooking time and portion size more accurately. By leveraging these engineered features, the model captures complex relationships between ingredients, cooking methods, and the final cooking outcomes. Previous studies like KitchenScale have used NLP to forecast ingredients, but this work is unique in integrating machine learning to concurrently estimate cooking times and portion sizes, filling the gaps in recipe data interpretation. Furthermore, this work contributes to the field of computational gastronomy by providing a more advanced model for bettering the performance of recipe recommendation systems and data-driven applications in kitchen management and meal planning. The model provides more refined, data-driven guidance for users to balance ingredient selection with cooking time, optimizing both aspects of meal preparation.
Although modern Sequence-to-Sequence models and Transformers are commonly used for prediction on raw text-based recipes, they need large datasets, and are less interpretable for tabular structured data and provide clearer feature importance, especially for smaller datasets common in culinary analytics [23][24]. In this approach, recipe texts are converted into structured numerical and categorical variables such as ingredient quantities, cooking processes and protein technique interactions that allow us to leverage XGBoost. This approach is efficient with tabular data, gives interpretable feature importance, and is appropriate for the size of our data set, striking a good balance between predicting performance and transparency for practical culinary applications.
METHODS
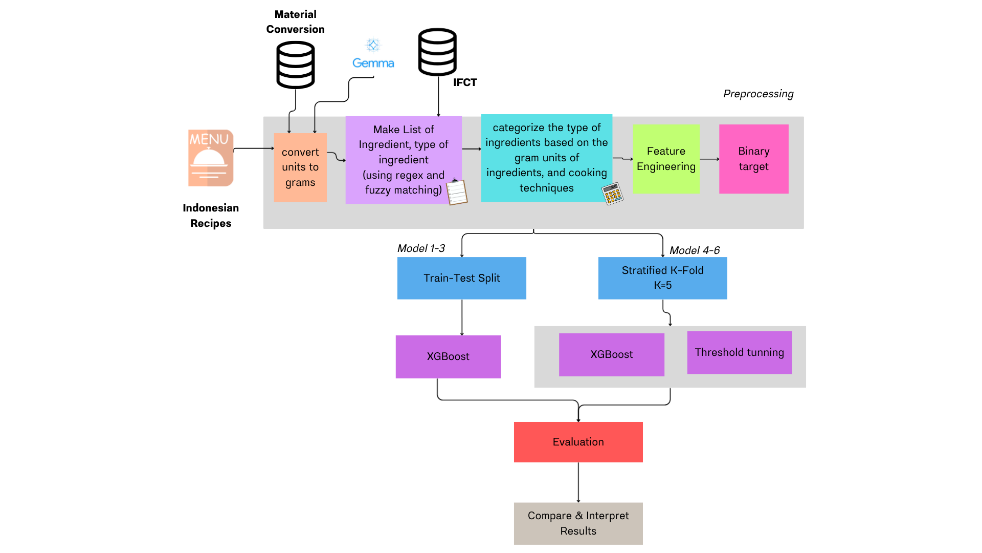
The methodology used in this research is a systematic method to forecast portion size and cooking time using Indonesian recipe data. For preprocessing, we first normalized ingredient units to grams with a large language model (Gemma) for unit normalization, based on the recent approach LLM-assisted feature standardization [25]. We also generated a comprehensive list of ingredients and cooking techniques via regex and fuzzy matching [26]. Then the ingredients are grouped according to their gram units and cooking methods, and feature engineering is applied to derive informative features [27]. These features are used to generate binary targets for categorization. We used Stratified K-Fold cross-validation ( ) to guarantee a balanced dataset for training and testing. The model is based on XGBoost, then threshold adjustment for best performance. Finally, the model effectiveness is tested by several performance criteria. The predictive capacity of the models is further improved by the combination of machine learning techniques and food science knowledge [28], especially in the context of food consumer demand analysis. Besides, the system also includes algorithms for predicting complicated food properties [29] which increases the precision of the final predictions.
Data Collection
This study uses a dataset of 1,400 traditional Indonesian recipes taken from Cookpad and validated by experts, consisting of a list of ingredients, step-by-step cooking procedures, number of servings, and estimated cooking times and their variability. The variation of these recipes provides an opportunity to study various aspects of diversity in local culinary traditions, consistent with the approach of other large-scale recipe datasets that include nutritional attributes and other detailed attributes that influence [30].
For accurate prediction of the recipes nutritional value, the study cites the Indonesian Food Composition Table (IFCT) which organizes macronutrients and micronutrients, and ranges of typical Indonesian food ingredients classifications. Similar to previous work using standardized food composition databases, machine learning models can estimate nutrient contents and analyze relationship between ingredients and nutritional outcomes [31]. The recipe dataset and the IFCT can be merged to analyze the quantity of the relationship of food ingredients and food preparation method to the recipe attributes such as number of servings and cooking time.
The study aims to identify the relationship of food ingredients, food preparation method and culinary attributes. The study also aims to create a digital recipe-based nutritional value prediction model. Therefore, the study aims to utilize the online recipe datasets for nutritional value planning, recipe time optimization, and to create data-based culinary problems. Based on Table 1, of the 1400 Indonesian recipes, each recipe uses an average of 16.32 ingredients, yielding 4.95 servings with 48.02 minutes of cooking time and 15.53 steps. Each recipe can involve more than one cooking technique and various types of ingredients, so the total distribution of techniques and ingredients far exceeds the number of recipes. The most frequently used techniques in this dataset are mixing, sautéing, stirring, and boiling, while the dominant ingredients in this recipe dataset are spices, vegetables, fat, and sugar, reflecting the characteristics of Indonesian cuisine which is rich in spices, ingredients, and complexity. The combination of ingredient quantity, technique variation, and ingredient type is correlated with cooking duration and recipe complexity, thus providing a strong basis for conducting systematic analysis to predict nutritional value and provide cooking efficiency.
Table 1. Data Distribution
Variable | Mean | Max | Min |
Ingredients per Recipe | 16.32 | 29 | 4 |
Servings per Recipe | 4.95 | 60 | 1 |
Estimated Cooking Time (minutes) | 48.02 | 300 | 3 |
Number of Cooking Steps | 15.53 | 86 | 1 |
|
|
|
Techniques | Distribution | Type of Material | Distribution |
Boil | 810 | Meat | 289 |
Fry | 702 | Eggs | 443 |
Sauté | 880 | Fat | 899 |
Grill | 111 | Spices | 6360 |
Steam | 136 | Vegetables | 1347 |
Slice | 899 | Sugar | 860 |
Stir | 950 | Tubers | 179 |
Shake | 42 | Fish etc. | 311 |
Mix | 1262 | Nuts | N |
Poach | 0 | Cereals | 212 |
Blender | 671 | Fruit | 138 |
Marinate | 109 | Milk | 12 |
Roast/Broil/Sous-vide/Deep-fry/Sear | 2 | Drinks | 5 |
Braise | 19 |
|
|
Simmer | 219 |
|
|
Data Preprocessing
Data preprocessing is a crucial stage in data analysis, aimed at ensuring the quality of the data used in training predictive models. This process involves a series of steps to ensure that the data involved is error-free, consistent, and well-structured to facilitate model processing. In this study, the data used comes from Indonesian recipes, which have various forms of non-uniformity in format and units. Therefore, this data preprocessing stage involves several important aspects: data cleaning, handling missing and non-standard values, converting ingredient units to grams, normalization and standardization, and categorical data transformation, weighting cooking techniques [32] and ingredient types, as seen in Figure 1 in the preprocessing section.
The first step is data cleaning that begins by removing columns that are irrelevant or provide useful information. Furthermore, missing values in the time_to_cook and portion columns will be manually verified by an expert. The next important step is handling the unit values of ingredients. This is because recipes are recorded in non-uniform units. This ensures consistency in ingredient naming (e.g., for chicken, some call it "large chicken," "meat chicken," "chicken thigh," etc.) in accordance with the IFCT measurement standards, while avoiding data inconsistencies and maintaining data quality [33]. This conversion process was performed using LLM, Gemma 3:4B, to recognize non-standard/household ingredient amounts and convert them automatically and correctly to standard units, i.e., grams [34]. The conversion results to grams were checked by an expert and had an accuracy of 63.88%. Ingredients that were not detected by the IFCT standard or those lacking units or quantities were extracted from the ingredient matrix, but they were nevertheless incorporated into the ingredient feature as binary indicators. With this strategy, the presence of unknown ingredients was still accounted for in the model without impacting the accuracy of portion determination.
Once the ingredients were validated, an ingredient matrix was constructed with the ingredient amounts in grams for each recipe. At this point, each recipe would contain a numerical representation of the items utilized in grams. This would make for more effective modelling with structured data [35]. Next, ingredients and cooking techniques are grouped by category. For the types of ingredients are grouped based on the grouping of IFCT, namely meat, eggs, fat, spices, sugar, tubers, fish, etc., nuts, cereals, fruits, drinks, and milk. As for cooking techniques, details and weights can be seen in Table 2. These weight assignments in Table 2 are based on expert consultation, culinary principles, and the impact of techniques and ingredients on cooking time and portion size. These ingredients and cooking techniques can be used as informative input features for the model, so that they can improve the quality of machine learning model predictions through more meaningful and representative features of the phenomena that can be analyzed [36].
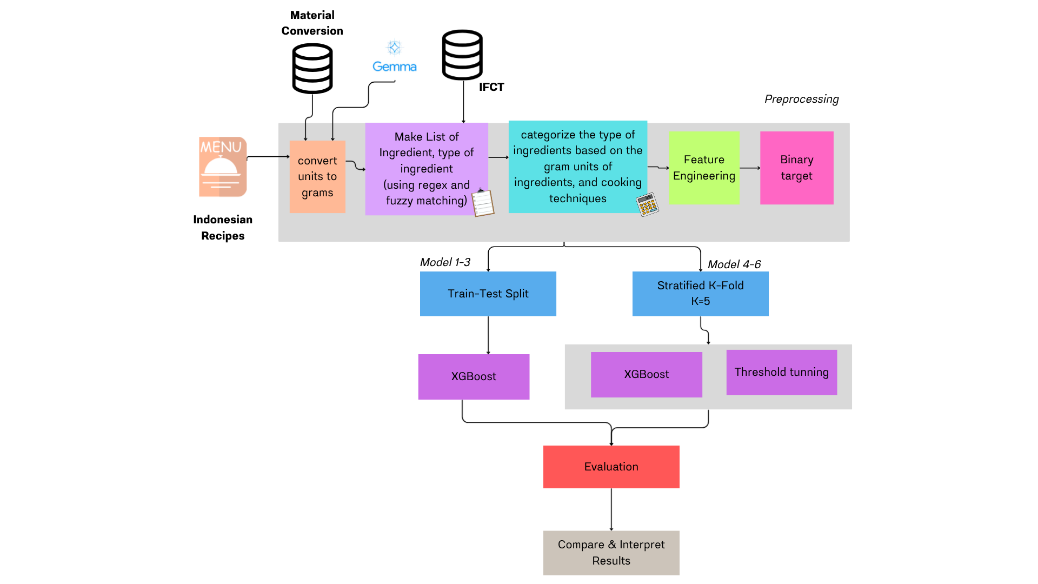
Figure 1. Modeling Approach Pipeline for Predicting Portion Sizes and Cooking Time Using XGBoost
Table 2. Weighting of Cooking Techniques and Types of Materials
Weight (W) | Techniques (T) | Type of Materials (J) |
1 | Slice; Mix | Fruit; Sugar; Milk; Drink |
2 | Stir; Shake; Blender; Marinate | Spices; Fat; Vegetables |
3 | Boil | Nuts; Eggs |
4 | Fry; Stir-fry; Steam; Poach; Saute; Sear | Fish etc |
5 | Grill; Broil; Roast; Deep-fry | Cereals; Tubers |
6 | Braise; Sous-vide | Meat |
7 | Simmer | - |
Feature and Target Selection
Feature Selection is an important process in selecting relevant features for machine learning models, which aims to reduce model complexity, increase accuracy, and speed up training time [37][38]. In the context of predicting portion and cooking time of Indonesian recipes, feature selection is carried out to select features that have the greatest contribution to the target variable [39], namely cooking time and number of portions. The new features used are total_gram, weighted ingredients, number of techniques, interaction between protein and cooking technique, and calculated technique complexity. Some features added from the aggregate results of other features can be seen in Table 3. The target of this prediction will be converted into binary form, with portion classifications being small/large and cooking time classifications being quick/long. This is done to convert continuous variables into binary categories based on thresholds.
Table 3. Aggregate Features
Features | Equation | Description |
Protein_source_total (pct) | 
| Helps the model see the contribution of the dominant main ingredient in a portion. |
weighted_ingredient (wi) | 
| The influence of ingredients, for example meat or cereals, is considered to be heavier on the portion than sugar or spices. |
ingredients_per_step (ips) | 
| Scale ingredients against cooking processes to see if a recipe is large but has few steps, or vice versa. |
Weighted_technique(wt) | 
| Giving weight to each technique which greatly influences cooking time |
Num_techniques (nt) | 
| The number of techniques used in a recipe |
protein_per_step (pps) | 
| Intensity of main ingredients in each stage of the process |
avg_gram_per_ing (agpi) | 
| Density of material composition |
protein_per_ing (ppi) | 
| Shows how protein heavy each ingredient in a recipe is. |
protein_tech_interaction (pti) | 
| Certain protein ingredients often require more complicated or longer processing techniques |
steps_per_technique (spt) | 
| How long each technique is performed in a recipe. Can help distinguish recipes with few techniques but long steps |
tech_per_step (tps) | 
| Variation of techniques in each step. Recipes with many techniques in a few steps can be a complex process. |
tech_per_1000g (tp1000) | 
| The intensity of the technique relative to the scale of the ingredients to distinguish small, complex recipes from large, simple recipes. |
protein_step_complexity (psc) | 
| This indicates how much protein is cooked in a recipe overall. This is relevant because protein often determines cooking time. |
num_slow_techniques (nst) | 
| Some techniques are synonymous with long cooking times. |
Sapi_kambing_tech_score (skts) | 
| Determining the level of complexity of techniques using cow/goat materials |
Tech_complexity (tc) | 
| Determining the complexity of a technique based on the number of steps |
Model Selection
Model selection is a crucial step in building an accurate prediction system. In this study, model selection was conducted to select the most appropriate machine learning algorithm such as gradient boosting models, which have been shown to perform well on structured tabular data [40][41] to predict two main targets: cooking time and number of servings in Indonesian recipes. Several factors to consider in model selection are the model's ability to handle numerical and categorical data, its ability to avoid overfitting, and its ability to handle large and unstructured datasets [42]-[44].
The algorithms used in this study are XGBoost, Logistic Regression, and Random Forest, which are applied to classification problems. XGBoost is a gradient boosting method that is effective in handling large and complex datasets. XGBoost works by gradually combining several decision trees, where each new tree tries to correct the errors of the previous tree [45], and has L1 and L2 regularization mechanisms to prevent overfitting and improve generalization [46].
In this study, XGBoost was used for classification, where the targets were portion size and cooking time categories. Using XGBoost for classification, the model predicts the category of each target based on the provided features. To maximize accuracy, XGBoost was optimized through hyperparameter tuning using GridSearch, including parameters such as n_estimators, learning_rate, max_depth, subsample, and colsample_bytree, so that the model can perform optimally on the training data while maintaining performance on the testing data. In this study, hyperparameter tuning using GridSearch was conducted prior to the model evaluation stage. The optimal parameter configuration obtained from GridSearch was then applied to the model for further evaluation. This tuning process was performed separately and was not nested within the cross-validation framework.
Moreover, XGBoost provides feature importance analysis for identifying the most relevant variables in predicting the portion size and cooking time. This is essential in the culinary setting, since it can hint to which ingredients or cooking processes most affect the final output of a recipe [47]. As illustrated in Figure 1, after the preprocessing and feature selection, the next step was to split the data into training and testing sets. The XGBoost model was trained using threshold tuning and the model was evaluated with cross validation and testing on the test set utilising metrics such as accuracy, recall, F1 score and precision to verify the accuracy and generalisability of the model in classification tasks [48].
Cross Validation
To validate the XGBoost Regressor model for predicting cooking time and portion size,  cross-validation is used as a validation method to evaluate the ability of the model to generalise to an independent data set and to evaluate the stability of the overall performance of the [49]. In this approach, the training data is divided into k subsets, and the model is trained on
  subsets while being validated on the remaining subsets repeatedly so that each piece of data is tested at least once [50]. K-fold cross-validation is used to reduce variance in performance estimation and improve generalization assessment, as demonstrated in [51]. Then, the values of metrics such as accuracy, recall, precision, and F1 score are averaged to provide more stable performance estimates and reduce the risk of overfitting or bias due to single data division [52]. This technique not only helps to select the optimal tuning combination but also provides a more realistic picture of performance estimates on real data, where empirically cross-validation evaluation is proven to be a valid method for model selection such as XGBoost which is sensitive to parameter configuration [53], in understanding the overall prediction performance even though the results still depend on data sharing [54], so that cross-validation remains an integral part of the modern machine learning model evaluation process [55]. After determining the optimal hyperparameters using GridSearch, model evaluation was conducted using Stratified K-Fold cross-validation (
 ) to preserve class distribution across folds. This evaluation was performed separately from the tuning process to compare model performance with and without cross-validation [56].
Evaluation Model
XGBoost model evaluation is performed using standard classification metrics, namely accuracy, recall, precision, and F1 score, as recommended for imbalanced classification problems in [57][58]. Given the potential class imbalance in portion size and cooking time classification, the primary evaluation criterion for model selection was the F1-score. These metrics provide an overview of the accuracy of the classification, the model's ability to handle minority classes, and the balance between precision and recall. Accuracy is used to measure the percentage of correct predictions from all data and the formula can be seen in Equation (1). Recall is used to measure the model's ability to identify the true positive class, where the formula can be seen in Equation (2) [59]. Meanwhile, precision is used to measure how many positive class predictions are correct in Equation (3), and F1 Score is the harmonic mean between precision and recall, which provides a better measure when dealing with class imbalance problems in Equation (4) [60][61].
- RESULT AND DISCUSSION
In the course of preparing the recipe datasets, ingredient recognition was carried out using fuzzy matching to handle discrepancies in ingredient name spellings, typographical errors, or ingredient abbreviations in different recipes. Fuzzy matching enables name comparison of each ingredient in the database to a reference list of ingredients, assigning a similarity score between 0 and 100. The score threshold was initially set to 70, meaning that ingredients with a similarity score of ≥ 70 were classified as identical. Nevertheless, the threshold proved to be inaccurate for several ingredient identifications, particularly for ingredients with identical spellings or ambiguous abbreviations.
During preprocessing, a higher fuzzy matching threshold was adjusted to ≥92, which resulted in improved ingredient consistency and reduced misclassification in the feature extraction stage. So that only ingredients with exceptionally high similarity would be considered a match to the standard list. Such enhancement enabled the system to be more precise when identifying ingredients, decreased the errors in features regarding ingredient quantity and type, and enhanced the input data quality for the predictive model. Thus, high threshold fuzzy matching is important for model improvement and for lessening the effect of spelling outliers in the ingredient list.
From the preprocessing results, a dataset was obtained in the form of a feature matrix as shown in Table 4. This matrix represents each recipe as one row, with columns containing various important attributes for prediction. The  column represents the amount of a particular type of ingredient contained in the recipe in grams that derived from IFCT data, while
  represents binary indicators of cooking techniques such as boil, fry, stir, etc. The portion column shows the number of servings of the recipe, and the is_sapi_kambing column is a Boolean variable that indicates whether the recipe contains beef or goat, because these ingredients usually require a longer cooking time. The time column represents the cooking duration of the recipe, the ingredients indicate how many types of ingredients are used, the steps indicate the number of stages in the recipe, and the column reflects the cooking technique used in the recipe.
Table 4. Recipe Preprocessing Result Matrix
id | 
| 
| 
| … | portion | Is_sapi_kambing | time | ingredients | steps | 
| 
| … |
0 | 100 | 60 | 0 | … | 3 | 0 | 60 | 16 | 11 | 1 | 0 | … |
1 | 0 | 1000 | 80 | … | 4 | 1 | 95 | 14 | 10 | 1 | 0 | … |
… | … | … |
| … | … | … | … | … | … | … | … | … |
The next stage is to run trials to predict two major targets: cooking time and serving size, when the data is in the form of a feature matrix. The prediction model is XGBoost, which is very effective in classification and regression problems in huge and complex data structures. In this experiment, all cooking techniques and all types of ingredients are weighted according to their complexity and normal cooking time. This weighting is intended to increase the model’s accuracy in forecasting time duration and portion size.
An additional experiment was also undertaken to tune the threshold and optimize the model. The purpose of threshold tuning is to find the best threshold to distinguish the classes in the prediction results so that the model can output more accurate results according to the prediction objectives. In this work different algorithms were explored to forecast two main targets, portion size and cooking time. The essential features were used to apply multiple modelling techniques and evaluation procedures to examine the predicted accuracy and consistency of the model. Table 5 presents the results of the model performance evaluation with the use of different features and parameters. For each target, accuracy, precision, recall, F1 score and balanced accuracy were employed as evaluation criteria.
Model 1 had a hard time predicting portion sizing and cooking time. Model 1 decided to use an XGBoost Regressor with rounding of predictions, however the results were sadly unsatisfactory. The portion size prediction accuracy was 0.1679 and F1 score was 0.0503. The cooking time prediction was significantly worse with accuracy 0.014 and F1 score 0.00189. In general, the rounding approach was bad and the forecasts were sub-par for the intricacy of the data. We added ±1 adjustment for piece size and ±5 minutes for time for model 2, which modestly improved performance using the XGBoost Regressor with a rounding method. This model had an accuracy of 0.575 for portion size and 0.2357 for duration. This is still quite low, especially for predictions of cooking time, which require more fine-grained research.
Model 3 employed classifiers and divided time categories into quick, medium and long ones and size categories into small, medium and large ones. This helped the model to better capture the variations in the data. The portion categorization scores were 0.51 (accuracy), 0.3661 (balanced accuracy) and 0.3637 (F1 score). The accuracy score on the time classification part of the model was 0.5857 and 0.4338 on the F1 score. The model does show some better performance, however there are still many more potential optimizations including balanced accuracy.
Table 5. Prediction Test (1400 data)
No. | Portion Feature | Time Feature | Model | Evaluation (portion) using XGBoost | Evaluation (Time) using XGBoost | Evaluation (portion) using Logistic Regression | Evaluation (Time) using Logistic Regression | Evaluation (portion) using Random Forest | Evaluation (Time) using Random Forest |
1 | total_gram, pct, wi, ips, pps, agpi, ppi | num_steps, wt, pti, nt, skts, tc, nst | Regressor with predicted rounding | Acc.: 0.196 Precision: 0.0909 Recall: 0.063 F1 Score: 0.0547 | Acc.: 0.014 Precision: 0.0176 Recall: 0.0010 F1 Score: 0.00189 | Acc.: 0.168 Precision: 0.05199 Recall: 0.0516 F1 Score: 0.0503 | Acc.: 0.579 Precision: 0.5116 Recall: 0.4700 F1 Score: 0.4804 | Acc.: 0.246 Precision: 0.0718 Recall: 0.068 F1 Score: 0.0548 | Acc.: 0.679 Precision: 0.4398 Recall: 0.4134 F1 Score: 0.4102 |
2 | total_gram, pct, wi, ips, pps, agpi, ppi | num_steps, wt, pti, nt, skts, tc, nst | Regressor portion ± 1 and time ± 5 minutes | Acc.: 0.575
| Acc.: 0.236
|
|
|
|
|
3 | total_gram, pct, wi, ips, pps, agpi, ppi | num_steps, wt, pti, nt, skts, tc, nst | Portion: small, medium, large Time: quick, medium, long | Acc.: 0.51 Bal. Acc: 0.3661 Precision: 0.3654 Recall: 0.3661 F1 Score :0.3637 | Acc.: 0.586 Bal. Acc: 0.5018 Precision: 0.4305 Recall: 0.5018 F1 Score: 0.4338 | Acc.: 0.389 Bal. Acc: 0.3655 Precision: 0.3571 Recall: 0.3655 F1 Score :0.3439 | Acc.: 0.579 Bal. Acc: 0.7276 Precision: 0.4721 Recall: 0.7276 F1 Score: 0.4592 | Acc.: 0.482 Bal. Acc: 0.3379 Precision: 0.3394 Recall: 0.3379 F1 Score :0.3378 | Acc.: 0.579 Bal. Acc: 0.6000 Precision: 0.4625 Recall: 0.6000 F1 Score: 0.4932 |
4 | total_gram, pct, wi, ingredients, agpi, protein_ratio, ips, pps, ppi | num_steps, nt, wt, pti, skts, spt, tps, tc, tp1000, psc, nst | Portion: small, large Time: quick, long SMOTE | Acc.: 0.782 Bal. Acc: 0.4929 Precision: 0.8372 Recall: 0.9191 F1 Score :0.8763 | Acc.: 0.693 Bal. Acc: 0.6445 Precision: 0.7101 Recall: 0.8497 F1 Score: 0.7737 | Acc.: 0.593 Bal. Acc: 0.5329 Precision: 0.8538 Recall: 0.6213 F1 Score :0.7192 | Acc.: 0.704 Bal. Acc: 0.6924 Precision: 0.7711 Recall: 0.7399 F1 Score: 0.7552 | Acc.: 0.796 Bal. Acc: 0.5284 Precision: 0.8477 Recall: 0.9234 F1 Score :0.8839 | Acc.: 0.675 Bal. Acc: 0.6300 Precision: 0.7030 Recall: 0.8208 F1 Score: 0.7573 |
5 | total_gram, pct, wi, ips, pps
| num_steps, wt, pti, skts, tc | Portion: small, large Time: quick, long k-fold = 5 | Acc.: 0.5050 Bal. Acc: 0.5116 Precision: 0.5209 Recall: 0.5116 F1 Score: 0.4667 | Acc.: 0.806 Bal. Acc: 0.5696 Precision: 0.5589 Recall: 0.5696 F1 Score: 0.5630 | Acc.: 0.513 Bal. Acc: 0.5584 Precision: 0.5654 Recall: 0.5584 F1 Score: 0.5044 | Acc.: 0.721 Bal. Acc: 0.6196 Precision: 0.5675 Recall: 0.6196 F1 Score: 0.5589 | Acc.: 0.517 Bal. Acc: 0.4855 Precision: 0.4836 Recall: 0.4855 F1 Score: 0.4741 | Acc.: 0.786 Bal. Acc: 0.5878 Precision: 0.5599 Recall: 0.5878 F1 Score: 0.5657 |
6 | total_gram, pct, wi, ips, pps
| num_steps, wt, pti, skts, tc | Portion: small, large Time: quick, long k-fold=5 SMOTE | Acc.: 0.3929 Bal. Acc: 0.5100 Precision: 0.5307 Recall: 0.5100 F1 Score: 0.3418 | Acc.: 0.664 Bal. Acc: 0.6608 Precision: 0.5697 Recall: 0.6608 F1 Score: 0.5436 | Acc.: 0.611 Bal. Acc: 0.4884 Precision: 0.4557 Recall: 0.4884 F1 Score: 0.4184 | Acc.: 0.707 Bal. Acc: 0.6442 Precision: 0.5686 Recall: 0.6442 F1 Score: 0.5598 | Acc.: 0.443 Bal. Acc: 0.5168 Precision: 0.5213 Recall: 0.5168 F1 Score: 0.4345 | Acc.: 0.846 Bal. Acc: 0.6411 Precision: 0.6306 Recall: 0.6411 F1 Score: 0.6355 |
The application of a two-class classification for portion (little, large) and time (fast, long) with two thresholds, one for portion and one for time, also yielded pretty excellent results for model 4. The size of a portion is based on the number of servings a dish yields, with 3 servings or less considered a small portion size and more than 6 servings considered a large portion size. This is based on how portions are normally created in households. Cooking Time is classified as rapid (cooking time less than or equal to 52 minutes) and lengthy (cooking time greater than 52 minutes). This threshold was calculated using Figure 2 with K-Means (k=2) clustering, which found two natural groups, with centroids close to 36 minutes (for rapid recipes) and 95 minutes (for long dishes). That 52 minute barrier is roughly halfway between the clusters, essentially creating a divide between common simple meals and lengthier, more sophisticated recipes. Analysis of the histograms also indicated a bimodal distribution with peaks at 30 to 45 minutes for short dishes and 70 to 90 minutes for long meals. With this threshold, the model classifies recipes in a statistically and practically meaningful way and provides a starting point for addressing class imbalance in the minority (long) class. These thresholds were chosen based on dataset distribution and culinary practices, which distribution of the dataset are 1173 small and 227 large portions, 866 quick recipes and 534 long recipes. The model achieved an accuracy of 0.7821 for portion, and an F1 score of 0.8763. This means it achieved high accuracy but showed poor balanced accuracy in predicting the correct portion. For time prediction, Model 4 achieved a high accuracy of 0.6929 with its balanced accuracy was relatively low (0.4742), indicating that the model struggled to correctly classify the minority class. This suggests that the high accuracy is misleading due to class imbalance, where the model is biased toward the majority class (quick recipes) and performs poorly on the minority class (long cooking time). Therefore, despite its high accuracy, Model 4 does not provide a well-balanced prediction performance.
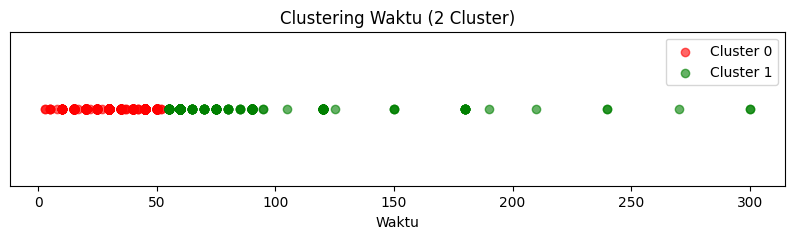
Figure 2. Distribution of Cooking Time Using K-Means
Model 5 using specifically threshold for portion ≥0.5, time ≥0.55, and the inclusion of k-fold cross-validation, Model 5 achieved a more balanced performance. For portion, achieving an accuracy of 0.5050, a balanced accuracy of 0.5116, and an F1 score of 0.4667. Time prediction accuracy increased to 0.8064, balanced accuracy to 0.5696, and F1 score to 0.5630. Both thresholding and cross-validation techniques helped the model to be more adaptable to data changes. Model 6 employed a combination of k-fold cross validation, thresholding, and SMOTE (Portion score >=0.799, time score >=0.25). The results showed a portion accuracy of 0.3929, a balanced accuracy of 0.5100, and an F1 score of 0.3418. For time prediction, the model accuracy was 0.6643, balanced accuracy was 0.6608, and the F1 score was 0.5436. While there was a reduction in partial accuracy compared to the previous model, the application of SMOTE enhanced balanced accuracy, resulting in better handling of minority classes.
For the Portion goal, the experimental findings reveal that the regression models such as XGBoost Regressor and Logistic Regression are less effective as the continuous output has to be rounded which makes numerous classification errors. The Random Forest model is significantly more stable but the highest performance is obtained from XGBoost Classification with feature engineering and thresholding (Model 4). This model employs domain-specific variables including protein_ratio, amount of ingredients and other technical indicators to characterise portion changes properly. The F1 score for Portion attained 0.8763 and an accuracy of 0.7821, which indicates that the combination of boosting, thresholding and domain-relevant characteristics can predict Portion classes (small/large) with high precision, while retaining business logic consistency. The XGBoost hyperparameters for Model 4 were set at n_estimators=250, max_depth=4, learning_rate=0.05, subsample=0.85, colsample_bytree=0.85, and random_state=42.
For the Time target, simple regression failed to capture the distribution of the categorical classes (quick/long), as indicated by very low F1 scores ranging from 0.0019 to 0.4804. Logistic Regression provided marginal improvement, but was still inferior to the tree-based model. Random Forest and XGBoost with SMOTE helped stabilize predictions for the minority class, but XGBoost Classification with thresholding and additional features (Model 4) remained superior with an F1 score of 0.7737 and a balanced accuracy of 0.6445. This indicates that for the Time target, a boosting approach that adjusts thresholds and utilizes domain-specific features is very effective in addressing class imbalance and the complexity of feature interactions.
When compared algorithmically, XGBoost excels because it is able to capture complex interactions between numerical and domain-specific features that affect both targets, and provides flexibility through thresholding for minority categories. Logistic Regression tends to be linear and thus fails to capture non-linearity, while Random Forest is stable for categories but does not fully utilize the advantages of boosting in reducing bias and improving predictions for minority classes. This combo (XGBoost + feature engineering + thresholding) is the best solution for this dataset, for both Portion and Time, with deep thinking logic, as it systematically combines the domain information, handles the imbalance and generates more accurate and consistent predictions.
Models were built sequentially to show the course of the experiment. Model 1 and Model 2 were developed from regression methods with rounding and adjustment procedures. Model 3 added categorisation with multi-class targets. In Model 4, we increased the performance with binary classification and more expanded feature sets and SMOTE. Model 5 greatly improved the model utilising threshold tweaking and K-Fold cross validation. Finally, in Model 6, SMOTE was used to solve the class imbalance. These improvements offered a systematic means to assess the influence of various modelling methodologies on performance. The differences between Model 1 and Model 6 are outlined in Table 6. These advances illustrate the transition from regression to classification, along with the addition of feature engineering and validation procedures, resulted in a significant enhancement of model performance.
For Time, the leading features are tech_per_1000g (tp1000), Tech_complexity (tc), step_per_technique(spt), tech_per_step(tps), protein_step_complexity (psc), and Weighted_technique (wt), all of which relate to the Tech-Intensity and Tech-complexity of the cooking process. Tech_per_1000g is a measure of tech intensity, and is slighted to large complex recipes vs general small recipes. Tech_complexity is the sum of a recipe’s steps and the techniques of the recipe. Weighted_technique is a measure of traction, that is the duration of the technique. Contextually, the duration is determined more by Tech-complexity and the interactions of the ingredients and the Tech than the number of steps or the number of ingredients can be seen in Figure 3.
Table 6. Summary of Model Variations
Model | Feature Set | Target Type | Threshold | Validation | Special Technique |
Model 1 | Basic features | Regression | Rounding | Train-test | - |
Model 2 | Basic features | Regression | ± adjustment | Train-test | - |
Model 3 | Basic features | Multi-class | Fixed threshold | Train-test | - |
Model 4 | Extended features | Binary | Defined threshold | Train-test | Feature engineering + SMOTE |
Model 5 | Selected features | Binary | Tuned threshold | K-Fold | Threshold tuning |
Model 6 | Selected features | Binary | Tuned threshold | K-Fold | SMOTE |
Figure 3. Feature Importance for Portion and Time
Model 4 used a full suite of features for Portion and Time prediction, including variables related to ingredient distribution, protein ratio, number of steps, technique complexity, and protein-technique interactions. The model was applied in a binary classification with thresholds ≥0.6 for Portion and ≥0.52 for Time, and used SMOTE to balance the class distribution. The findings indicate that this model performed well with an accuracy of 78.2% and an F1 score of 0.8763 for Portion and an accuracy of 69.3% and F1 score of 0.7737 for Time. Figure 4 illustrates the confusion matrix and reveals that most of the minority classes (big for Portion, long for Time) have been forecasted better than the prior model, but, there were still some mispredictions for the long cooking time and large portion categories. This indicates that SMOTE and thresholding were useful, although bias towards the dominant class was not fully removed.
Future study recommendations include increasing the amount of conversion data to generate more accurate conversions to grams and hence improve the conversion of household units to grams. One can use oversampling or more adaptive cost sensitive learning methods for minority class prediction. In addition, ensemble models or deep learning can be studied to capture non-linear correlations between complex information. Optimising the dynamic or probabilistic threshold may result in a better balancing accuracy. Finally, the addition of additional, better aggregate attributes to better characterise the complexity of techniques and the interactions between ingredients and processes, thereby enhancing the accuracy of prediction of portions and duration.
Figure 4. Confusion Matrix for Portion and Time Prediction
CONCLUSIONS
The results of this study show that the binary classification approach in XGBoost model can accurately predict the portion size and cooking duration, especially when the features used are representative of the distribution of ingredients, ratio of proteins, number of steps, complexity of techniques, and interactions between proteins and techniques. The feature importance analysis showed that portion size is primarily impacted by ingredient features such as total_grams, weighted_ingredient, avg_gram_per_ing and ingredients_per_step since these features directly represent the main ingredient contribution, material density and ingredient distribution per step, which are key factors in deciding the portion size. Cooking time depends on the processes and techniques used. num_steps, the relationship of protein and technique, tech_complexity, and tech_per_1000g show how process complexity and protein - technique interactions impact preparation time. These results emphasise that a domain-informed feature engineering method helps the model to identify useful patterns and enhances the interpretability of predictions in a kitchen operating environment.
However, there are certain drawbacks in this study. First, the dataset size, although increased to 1,400 recipes, is very small for a sophisticated model like XGBoost, which can limit the model’s ability to capture sparse patterns and increase the danger of overfitting. Second, the dataset is geographically and culturally unique, mostly consisting of Indonesian food, and so the generalizability of the model to recipes from other cultures is still limited. Third, the performance of the minority classes (especially large parts and long recipes) is still not optimal, even with the use of SMOTE and K-Fold Cross-Validation. Finally, the model was not verified on an external dataset, therefore its predictive ability on independent recipes is still unknown.
Future work could consider class imbalance to improve the prediction of minority classes, broaden the cross-cultural dataset to increase the generalizability of the model, and generate further characteristics that highlight ingredient-technique connections. These improvements will allow the model to more accurately predict the portion sizes and durations which can be operationalized for the Free Nutritious Meals (MBG) program or meal planning for diets for people with limited time. This will allow for optimization of appropriate food distribution, efficient cooking time management and more systematic fulfilment of recipients’ nutritional needs.
DECLARATION
Supplementary Materials
The supporting information can be download at Mendeley data with the title “Nutritional Analysis and Macro-Micro Nutrient Profiling of Indonesian Culinary Recipes” (https://doi.org/10.17632/8b4ztns76h.3)
Sustainable Development Goals
The suitable development goal for this research can be categorized as Responsible Consumption and Production (SDG 12), as it contributes to optimizing recipe portioning and cooking time, promoting more sustainable food practices and reducing food waste by enhancing the accuracy of portion size predictions and cooking time estimations
Author Contribution
Devi Dwi Purwanto: Conceptualization, Data Curation, Methodology, Writing. Aji Prasetya Wibawa: Supervision, Validation, Project Administration, Writing. Mazarina Devi: Quality Control, Data Verification.
Funding
This author gratefully acknowledge financial support for this research was funded by the Doctoral Dissertation Grant of Malang State University, which enabled the data collection, analysis, and preparation of this study.
Conflicts of Interest
The authors declare no conflict of interest
REFERENCES
- A. Sanatbyek et al., “A Multitask Deep Learning Model for Food Scene Recognition and Portion Estimation—the Food Portion Benchmark (FPB) Dataset,” IEEE Access, vol. 13, pp. 152033–152045, 2025, https://doi.org/10.1109/ACCESS.2025.3603287.
- J. Sultana, B. Md. Ahmed, M. M. Masud, A. K. O. Huq, M. E. Ali, and M. Naznin, “A Study on Food Value Estimation From Images: Taxonomies, Datasets, and Techniques,” IEEE Access, vol. 11, pp. 45910–45935, 2023, https://doi.org/10.1109/ACCESS.2023.3274475.
- D. Choi, M. Gim, S. Badreddine, H. Kim, D. Park, and J. Kang, “KitchenScale: Learning to predict ingredient quantities from recipe contexts,” Expert Systems with Applications, vol. 224, p. 120041, 2023, https://doi.org/10.1016/j.eswa.2023.120041.
- H. Ding et al., “The Application of Artificial Intelligence and Big Data in the Food Industry,” Foods, vol. 12, no. 24, p. 4511, 2023, https://doi.org/10.3390/foods12244511.
- N. U. Gilal et al., “Evaluating machine learning technologies for food computing from a data set perspective,” Multimed Tools Appl, vol. 83, no. 11, pp. 32041–32068, 2023, https://doi.org/10.1007/s11042-023-16513-4.
- N. Sakib, G. M. Shahariar, Md. M. Kabir, Md. K. Hasan, and H. Mahmud, “Towards automated recipe genre classification using semi-supervised learning,” PLoS ONE, vol. 20, no. 1, p. e0317697, 2025, https://doi.org/10.1371/journal.pone.0317697.
- D. Liu, E. Zuo, D. Wang, L. He, L. Dong, and X. Lu, “Deep Learning in Food Image Recognition: A Comprehensive Review,” Applied Sciences, vol. 15, no. 14, p. 7626, 2025, https://doi.org/10.3390/app15147626.
- Y. Feng, Y. Wang, X. Wang, J. Bi, Z. Xiao, and Y. Luo, “Large-scale image classification and nutrient estimation for Chinese dishes,” Journal of Agriculture and Food Research, vol. 19, p. 101733, Mar. 2025, https://doi.org/10.1016/j.jafr.2025.101733.
- G. Bagler and M. Goel, “Computational gastronomy: capturing culinary creativity by making food computable,” npj Syst Biol Appl, vol. 10, no. 1, p. 72, 2024, https://doi.org/10.1038/s41540-024-00399-5.
- M. Bellingeri, A. Bidon-Chanal Badia, M. V. Rigat, R. Alfieri, M. Turchetto, and D. Cassi, “The recipe similarity network: a new algorithm to extract relevant information from cookbooks,” Sci Rep, vol. 15, no. 1, p. 34380, 2025, https://doi.org/10.1038/s41598-025-17189-6.
- N. Jia, J. Chen, and R. Wang, “An attention-based convolutional neural network for recipe recommendation,” Expert Systems with Applications, vol. 201, p. 116979, 2022, https://doi.org/10.1016/j.eswa.2022.116979.
- R. Ouyang, H. Huang, W. Ou, and Q. Liu, “Multimodal Recipe Recommendation with Heterogeneous Graph Neural Networks,” Electronics, vol. 13, no. 16, p. 3283, 2024, https://doi.org/10.3390/electronics13163283.
- B. K. Rai, N. S. Chandan, D. N. Marangappanavar, S. Indira, and G. Kumar, “Classifying food ingredients using machine learning on nutritional and biochemical data,” Discov Food, vol. 5, no. 1, p. 382, 2025, https://doi.org/10.1007/s44187-025-00661-7.
- T. Naravane and I. Tagkopoulos, “Machine learning models to predict micronutrient profile in food after processing,” Current Research in Food Science, vol. 6, p. 100500, 2023, https://doi.org/10.1016/j.crfs.2023.100500.
- V. Zatsu et al., “Revolutionizing the food industry: The transformative power of artificial intelligence-a review,” Food Chemistry: X, vol. 24, p. 101867, 2024, https://doi.org/10.1016/j.fochx.2024.101867.
- M. Rostami, M. Akbari, M. Akbari, M. Faramarzzadeh, I. Virtanen, and M. Oussalah, “Recipe popularity prediction in Finnish social media: integrating visual and non-visual features,” Soc. Netw. Anal. Min., vol. 15, no. 1, p. 107, 2025, https://doi.org/10.1007/s13278-025-01534-8.
- N. Theera-Ampornpunt and P. Treepong, “Visual Food Ingredient Prediction Using Deep Learning with Direct F-Score Optimization,” Foods, vol. 14, no. 24, p. 4269, 2025, https://doi.org/10.3390/foods14244269.
- M. Rodrigues, V. Miguéis, S. Freitas, and T. Machado, “Machine learning models for short-term demand forecasting in food catering services: A solution to reduce food waste,” Journal of Cleaner Production, vol. 435, p. 140265, 2024, https://doi.org/10.1016/j.jclepro.2023.140265.
- G. Ispirova, T. Eftimov, S. Džeroski, and B. K. Seljak, “MsGEN: Measuring generalization of nutrient value prediction across different recipe datasets,” Expert Systems with Applications, vol. 237, p. 121507, 2024, https://doi.org/10.1016/j.eswa.2023.121507.
- M. De Clercq, M. Stock, B. De Baets, and W. Waegeman, “Data-driven recipe completion using machine learning methods,” Trends in Food Science & Technology, vol. 49, pp. 1–13, 2016, https://doi.org/10.1016/j.tifs.2015.11.010.
- D. Tao, P. Yang, and H. Feng, “Utilization of text mining as a big data analysis tool for food science and nutrition,” Comp Rev Food Sci Food Safe, vol. 19, no. 2, pp. 875–894, 2020, https://doi.org/10.1111/1541-4337.12540.
- I. Cabeza-Gil, I. Ríos-Ruiz, M. Á. Martínez, B. Calvo, and J. Grasa, “Digital twins for monitoring and predicting the cooking of food products: A case study for a French crêpe,” Journal of Food Engineering, vol. 359, p. 111697, 2023, https://doi.org/10.1016/j.jfoodeng.2023.111697.
- J. Pasaribu, N. Yudistira, and W. F. Mahmudy, “Tabular Data Classification and Regression : XGBoost or Deep Learning with Retrieval-Augmented Generation,” IEEE Access, pp. 1–1, 2024, https://doi.org/10.1109/ACCESS.2024.3518205.
- A. Shmuel, O. Glickman, and T. Lazebnik, “A comprehensive benchmark of machine and deep learning models on structured data for regression and classification,” Neurocomputing, vol. 655, p. 131337, 2025, https://doi.org/10.1016/j.neucom.2025.131337.
- M. Yamaguchi, M. Araki, K. Hamada, T. Nojiri, and N. Nishi, “Development of a Machine Learning Model for Classifying Cooking Recipes According to Dietary Styles,” Foods, vol. 13, no. 5, p. 667, 2024, https://doi.org/10.3390/foods13050667.
- C. Trattner, T. Kusmierczyk, and K. Nørvåg, “Investigating and predicting online food recipe upload behavior,” Information Processing & Management, vol. 56, no. 3, pp. 654–673, 2019, https://doi.org/10.1016/j.ipm.2018.10.016.
- J. Zhou, X. Xin, S. Yu, J. Liu, W. Li, and X. Cui, “Advancing Authentic Recipe Ideation across Culinary Styles using a Mathematical Model: RecipeMT,” Journal of Future Foods, p. S2772566925001338, 2025, https://doi.org/10.1016/j.jfutfo.2025.07.004.
- X. Wu et al., “Transforming Food Consumer Analysis: The Role of Machine Learning in Food Consumer Demand 4.0,” Journal of Future Foods, p. S2772566925001454, 2025, https://doi.org/10.1016/j.jfutfo.2024.12.008.
- E. Kirtil, “Machine learning-driven integration of GC–MS and sensory panel data for aroma prediction in food systems,” Journal of Food Composition and Analysis, vol. 148, p. 108594, 2025, https://doi.org/10.1016/j.jfca.2025.108594.
- L. Huang et al., “Dish-level carbon and nutrition dataset for 4,403 Asian recipes,” Sci Data, vol. 12, no. 1, p. 1917, 2025, https://doi.org/10.1038/s41597-025-06180-5.
- P. Ma et al., “Application of machine learning for estimating label nutrients using USDA Global Branded Food Products Database, (BFPD),” Journal of Food Composition and Analysis, vol. 100, p. 103857, 2021, https://doi.org/10.1016/j.jfca.2021.103857.
- K. Sugioka, S. Kamei, and Y. Morimoto, “BERT Pre-Training for Cooking Time Prediction from Japanese Cooking Recipes,” IEICE Trans. Inf. & Syst., vol. E109.D, no. 4, pp. 531–540, 2026, https://doi.org/10.1587/transinf.2025EDP7055.
- P. Koukaras and C. Tjortjis, “Data Preprocessing and Feature Engineering for Data Mining: Techniques, Tools, and Best Practices,” AI, vol. 6, no. 10, p. 257, 2025, https://doi.org/10.3390/ai6100257.
- D. Li, Z. Tan, and H. Liu, “Exploring Large Language Models for Feature Selection: A Data-centric Perspective,” SIGKDD Explor. Newsl., vol. 26, no. 2, pp. 44–53, 2025, https://doi.org/10.1145/3715073.3715077.
- T. Liu, T. Chong, G. Xu, X. Wang, P. Peng, and J. Ma, “XGBoost-LR: A method for network traffic anomaly detection,” International Journal of Cognitive Computing in Engineering, vol. 7, pp. 325–333, 2026, https://doi.org/10.1016/j.ijcce.2025.11.007.
- Q. A. Hidayaturrohman and E. Hanada, “Impact of Data Pre-Processing Techniques on XGBoost Model Performance for Predicting All-Cause Readmission and Mortality Among Patients with Heart Failure,” BioMedInformatics, vol. 4, no. 4, pp. 2201–2212, 2024, https://doi.org/10.3390/biomedinformatics4040118.
- F. E. Bezerra et al., “Impacts of Feature Selection on Predicting Machine Failures by Machine Learning Algorithms,” Applied Sciences, vol. 14, no. 8, p. 3337, 2024, https://doi.org/10.3390/app14083337.
- M. C. Barbieri, B. I. Grisci, and M. Dorn, “Analysis and comparison of feature selection methods towards performance and stability,” Expert Systems with Applications, vol. 249, p. 123667, 2024, https://doi.org/10.1016/j.eswa.2024.123667.
- M. Yamaguchi, M. Araki, K. Hamada, T. Nojiri, and N. Nishi, “Development of a Machine Learning Model for Classifying Cooking Recipes According to Dietary Styles,” Foods, vol. 13, no. 5, p. 667, 2024, https://doi.org/10.3390/foods13050667.
- M. Alizamir et al., “An interpretable XGBoost-SHAP machine learning model for reliable prediction of mechanical properties in waste foundry sand-based eco-friendly concrete,” Results in Engineering, vol. 25, p. 104307, 2025, https://doi.org/10.1016/j.rineng.2025.104307.
- K. Le Nguyen, M. Shakouri, and L. S. Ho, “Investigating the effectiveness of hybrid gradient boosting models and optimization algorithms for concrete strength prediction,” Engineering Applications of Artificial Intelligence, vol. 149, p. 110568, 2025, https://doi.org/10.1016/j.engappai.2025.110568.
- P. Sridevi, Z. Arefin, and S. I. Ahamed, “An integrated machine learning and hyperparameter optimization framework for noninvasive creatinine estimation using photoplethysmography signals,” Healthcare Analytics, vol. 7, p. 100395, 2025, https://doi.org/10.1016/j.health.2025.100395.
- C. B. Arachchilage, G. Huang, J. Zhao, C. Fan, and W. V. Liu, “Hybrid extreme gradient boosting regressor models for the multi-objective mixture design optimization of cementitious mixtures incorporating mine tailings as fine aggregates,” Cement and Concrete Composites, vol. 154, p. 105787, 2024, https://doi.org/10.1016/j.cemconcomp.2024.105787.
- M. Gertz et al., “Using the XGBoost algorithm to classify neck and leg activity sensor data using on-farm health recordings for locomotor-associated diseases,” Computers and Electronics in Agriculture, vol. 173, p. 105404, 2020, https://doi.org/10.1016/j.compag.2020.105404.
- M. Golec and M. AlabdulJalil, “CRAXNet: Credit Rating via Advanced XGBoost and Neural Networks,” Kuwait Journal of Science, vol. 53, no. 1, p. 100490, 2026, https://doi.org/10.1016/j.kjs.2025.100490.
- I. M. Rajagukguk, R. Hartanto, Julian, and R. Halim, “Comparative Analysis of XGBoost, Random Forest, and Logistic Regression for Classifying Jakarta’s Air Pollution Index (ISPU),” Procedia Computer Science, vol. 269, pp. 108–120, 2025, https://doi.org/10.1016/j.procs.2025.08.264.
- L. R. Sitompul, A. A. Nababan, M. L. Manihuruk, W. A. Ponsen, and S. Supriyandi, “Comparison of Xgboost, Random Forest and Logistic Regression Algorithms in Stroke Disease Classification,” SinkrOn, vol. 9, no. 2, pp. 957–968, 2025, https://doi.org/10.33395/sinkron.v9i2.14794.
- A. R. Ramadan, M. A. Hariyadi, and A. T. W. Almais, “XGBoost Model Optimization Using PCA for Classification of Cyber Attacks on The Internet of Things,” International Journal of Advances in Data and Information Systems, vol. 6, no. 3, 2025, https://doi.org/10.59395/ijadis.v6i3.1465.
- T. Abedin, H. Xu, and S. Uddin, “The impact of K selection in K‑fold cross-validation on bias and variance in supervised learning models,” Sci Rep, vol. 16, no. 1, p. 6084, 2026, https://doi.org/10.1038/s41598-026-37247-x.
- J. M. Gorriz, R. Martin-Clemente, F. Segovia, J. Ramirez, A. Ortiz, and J. Suckling, “Is K-fold cross validation the best model selection method for Machine Learning?,” Information Fusion, p. 104404, 2026, https://doi.org/10.1016/j.inffus.2026.104404.
- T.-T. Wong, “Performance evaluation of classification algorithms by k-fold and leave-one-out cross validation,” Pattern Recognition, vol. 48, no. 9, pp. 2839–2846, 2015, https://doi.org/10.1016/j.patcog.2015.03.009.
- V. Teodorescu and L. Obreja Brașoveanu, “Assessing the Validity of k-Fold Cross-Validation for Model Selection: Evidence from Bankruptcy Prediction Using Random Forest and XGBoost,” Computation, vol. 13, no. 5, p. 127, 2025, https://doi.org/10.3390/computation13050127.
- M. K. Mayangsari, I. Syarif, and A. Barakbah, “Evaluation of Stratified K-Fold Cross Validation for Predicting Bug Severity in Game Review Classification,” KINETIK, 2023, https://doi.org/10.22219/kinetik.v8i3.1740.
- G. Baron and U. Stańczyk, “Standard vs. non-standard cross-validation: evaluation of performance in a space with structured distribution of datapoints,” Procedia Computer Science, vol. 192, pp. 1245–1254, 2021, https://doi.org/10.1016/j.procs.2021.08.128.
- V. Teodorescu and L. Obreja Brașoveanu, “Assessing the Validity of k-Fold Cross-Validation for Model Selection: Evidence from Bankruptcy Prediction Using Random Forest and XGBoost,” Computation, vol. 13, no. 5, p. 127, 2025, https://doi.org/10.3390/computation13050127.
- P. Heidari and A. Milan, “Combining K-fold cross validation with bayesian hyperparameter optimization for accuracy enhancement of land cover and land use classification,” Sci Rep, vol. 15, no. 1, p. 39758, 2025, https://doi.org/10.1038/s41598-025-23336-w.
- H. Khoshvaght, R. R. Permala, A. Razmjou, and M. Khiadani, “A critical review on selecting performance evaluation metrics for supervised machine learning models in wastewater quality prediction,” Journal of Environmental Chemical Engineering, vol. 13, no. 6, p. 119675, 2025, https://doi.org/10.1016/j.jece.2025.119675.
- M. Conciatori, A. Valletta, and A. Segalini, “Improving the quality evaluation process of machine learning algorithms applied to landslide time series analysis,” Computers & Geosciences, vol. 184, p. 105531, 2024, https://doi.org/10.1016/j.cageo.2024.105531.
- P. Boozary, S. Sheykhan, H. GhorbanTanhaei, and C. Magazzino, “Enhancing customer retention with machine learning: A comparative analysis of ensemble models for accurate churn prediction,” International Journal of Information Management Data Insights, vol. 5, no. 1, p. 100331, 2025, https://doi.org/10.1016/j.jjimei.2025.100331.
- F. K. Wijaya, T. C. Sugijono, R. Setiawan, and R. Y. Rumagit, “Comparative Analysis of Machine Learning Random Forest, Naïve Bayes and SVM for Flight Delay Classification,” Procedia Computer Science, vol. 269, pp. 1546–1555, 2025, https://doi.org/10.1016/j.procs.2025.09.096.
- S. Boujmiraz, H. Darhmaoui, and A. Drissi El Maliani, “Predicting student performance: A comprehensive review of machine learning, deep learning, and explainable AI approaches,” Computers and Education: Artificial Intelligence, vol. 10, p. 100548, 2026, https://doi.org/10.1016/j.caeai.2026.100548.
AUTHOR BIOGRAPHY

| Devi Dwi Purwanto, she received a Master’s degree in Information Technology in 2013. She is currently serving as a lecturer in the Department of Informatics at the Universitas Katolik Widya Mandala Surabaya. Her research interests include software engineering, data science, artificial intelligence, and their applications in various domains, including education and data-driven decision-making systems. She is actively involved in academic projects that explore how computational models and machine learning algorithms can be applied to complex real-world problems, such as predictive modeling and data analytics for fields like the food industry. Email: devi.dwi.2505349@students.um.ac.id ORCID: 0000-0001-6570-6555 |
|
|

| Aji Prasetya Wibawa, he received his Master’s degree in Information Technology from Institut Teknologi Sepuluh November, Indonesia, in 2007, and his Doctoral degree in Information Engineering from University of South Australia, in 2014. He is currently a lecturer in the Department of Informatics at Universitas Negeri Malang, Indonesia. His research interests include Natural Language Processing (NLP), Machine Translation, Data Science, and Analytics, with a focus on developing computational models for text-based data analysis and language processing. Dr. Wibawa has contributed to various advancements in machine learning algorithms for improving language translation systems and enhancing NLP models. He is also involved in interdisciplinary research projects that apply data-driven techniques and artificial intelligence (AI) to real-world challenges in language technologies and machine learning. Email: aji.prasetya.ft@um.ac.id ORCID: 0000-0002-6653-2697 |
|
|

| Mazarina Devi, she received Master’s degree in IGM & Family resources from Institut Pertanian Bogor, Indonesia, in 1996, and her Doctoral degree in IGM & Family Health from same institution in 2009. She is currently a lecturer in the Faculty of Vocational Studies, Universitas Negeri Malang, Indonesia. She is an academic and researcher with active contributions in food science and allied health research. Her research engagements reflect a focus on applying scientific methods to understand food components and their implications for nutrition and functional properties. Email: mazarina.devi.ft@um.ac.id ORCID: 0009-0001-3625-207X |
Devi Dwi Purwanto (Machine Learning Approaches for Binary Classification of Portion Size and Cooking Time in Indonesian Recipes)