ISSN: 2685-9572 Buletin Ilmiah Sarjana Teknik Elektro
Vol. 8, No. 2, April 2026, pp. 598-618
Utilizing Two Maximum Power Point Tracking Techniques with an Integrated DC-DC Boost Converter for Controlling a Grid-Connected Photovoltaic System
Haitham Ibrahim Elbahat 1,2, Ibram Y. Fawzy 3, Ahmed A. Zaki Diab 1, Hamdy Sultan 1,
Ahmed Kassem 4, Alfian Maarif 5, Mahmoud A. Mossa 1
1 Electrical Engineering Department, Faculty of Engineering, Minia University, Minia 61111, Egypt
2 Middle Delta Electricity Production company (MDEPC), Talkha Combined Cycle Power Plant, Dakahlia, Egypt
3 Egyptian Electricity Transmission Company, Middle Egypt Electricity Zone, Middle Egypt Regional Control Center,
Minia, Egypt
4 Electrical Engineering Department, Faculty of Engineering, Sohag University, Sohag, Egypt
5 Department of Electrical Engineering, Universitas Ahmad Dahlan, Yogyakarta, Indonesia
ARTICLE INFORMATION |
| ABSTRACT |
Article History: Received 02 February 2026 Revised 15 April 2026 Accepted 16 May 2026 |
| 
This paper focuses on the comparison of maximum power point tracking (MPPT) techniques for photovoltaic (PV) system that is interfaced with the utility grid via a three-phase voltage source inverter (VSI). Two algorithms for MPPT are presented: the Perturb and Observe (P&O) technique and the Incremental Conductance (INC) algorithm, which employ a DC-DC boost converter. The algorithms are designed to optimize the capture of power produced by the PV system by measuring the PV output power and adjust the converter’s duty cycle. The VSI in the system handles the conversion from DC to AC. It employs both an internal control loop and an external control loop to maintain the stability of the DC-link voltage and to ensure synchronization with the grid. The grid synchronization of system involves the use of Phase-Locked Loops (PLL) to achieve high accuracy in dynamic conditions. The MPPT algorithms are implemented purely in a simulated environment using the Matlab/Simulink package to illustrate the advantages of the presented MPPT methods in comparison to operating without MPPT under different meteorological conditions. The PV array simulation generally employs monocrystalline modules. The electrical parameters of the system comprise the maximum power point voltage (Vmpp), maximum power point current (Impp), open-circuit voltage (Voc), and short-circuit current (Isc). The system initiates operations under standard test conditions (STC) of 25°C and 1000 W/m² during the simulation, followed by variations in irradiance (G) and temperature (T) over time. The findings indicate that the P&O technique effectively tracks the maximum power point (MPP) and facilitates the extraction of further power throughout fluctuations under various meteorological conditions. Furthermore, the INC algorithm is determined to be more effective for achieving MPPT in relation to both the P&O method and the absence of MPPT under dynamic as well as steady-state conditions. The INC algorithm is shown to increase the PV output power at STC by 5.24% without utilizing MPPT, whereas the P&O algorithm achieves an enhancement of 3.24%. The results also reveal that the INC technique exhibits the highest performance, achieving approximately 99.72% efficiency, whereas P&O reaches nearly 97.62% efficiency at STC. |
Keywords: Boost Converter; MPPT; P&O; INC; Comparative Analysis |
Corresponding Author: Mahmoud A. Mossa, Electrical Engineering Department, Faculty of Engineering, Minia University, Minia 61111, Egypt. Email: mahmoud_a_mossa@mu.edu.eg |
This work is open access under a Creative Commons Attribution-Share Alike 4.0 
|
Document Citation: H. I. Elbahat, I. Y. Fawzy, A. A. Z. Diab, H. Sultan, A. Kassem, A. Maarif, and M. A. Mossa, “Utilizing Two Maximum Power Point Tracking Techniques with an Integrated DC-DC Boost Converter for Controlling a Grid-Connected Photovoltaic System,” Buletin Ilmiah Sarjana Teknik Elektro, vol. 8, no. 2, pp. 598-618, 2026, DOI: 10.12928/biste.v8i2.15933. |
- INTRODUCTION
The increasing global demand for electrical energy has positioned photovoltaic (PV) technology as a cost-effective solution for power generation in various sectors, including residential energy systems, small off-grid applications, and large infrastructure projects [1]-[4]. The application of solar energy via (PV) panels plays a significant role in reducing greenhouse gas emissions and presents considerable potential for long-term economic advantages [5]-[7].
Despite the widespread global adoption of PV technology, its output exhibits nonlinearity and depends heavily on environmental variables (such as temperature and irradiance) as well as operating conditions. Therefore, maximum power point tracking (MPPT) becomes essential, though it necessitates a robust, efficient, and an economical MPPT solution to enhance energy output [8]-[12]. The problem statement of this paper analyzes the nonlinear voltage-current characteristics and notable power losses of PV arrays in complex operating conditions, such as fluctuating in environmental conditions. This scenario requires the adoption of advanced MPPT techniques to enhance the power output of PV systems.
MPPT is employed to optimize the extraction of power from PV modules through the precise adjustment of the converter's duty cycle, ensuring it aligns with the source voltage and operational points at the specified power point. A DC-DC boost converter has been selected for the application to attain higher conversion efficiency while maintaining simplicity in the electrical circuit [13]-[15]. Researchers have employed a range of MPPT techniques across several studies. Commonly used MPPT algorithms include the Perturb and Observe (P&O) method and the Incremental Conductance Algorithm (INC) because of their straightforwardness and efficiency. P&O utilizes periodic voltage changes to monitor energy fluctuations; it is a straightforward and effective method in various situations, although it may experience oscillations around the maximum power point. The Incremental Conductance Algorithm (INC) offers greater accuracy but necessitates more complex computations [16]-[21].
PV systems have a range of applications, including remote area energy services and grid utilities. These applications encompass illumination, photovoltaic residential systems, street lighting, water pumping and purification systems, traffic lights, telecommunication stations, battery charging, and medical services in remote areas. Egypt, recognized for its substantial sunlight, is well-suited for generating electrical energy from solar sources using PV systems. The Egyptian government encourages investment in renewable energy projects to meet load demand [22]-[24]. Solar irrigation constitutes an innovative technological advancement that utilizes clean energy for agricultural irrigation. It serves as a proactive strategy to reduce energy consumption in irrigation practices, lower greenhouse gas emissions, and address power supply issues in remote areas. This technology has been widely adopted on a global scale [25]-[27].
PV systems connected to the grid are currently among the greatest prevalent and extensively utilized options [28][29]. These systems do not require energy storage batteries; they utilize standard inverters and are integrated with the electrical grid. When PV panels generate more energy than is consumed by the load, the excess energy is transferred to the grid, and users typically receive credit for the energy exported [30][31]. It is important to note that PV systems connected to the grid are deactivated in the event of electrical outages for safety reasons [32][33].
The following section presents a review of relevant literature pertaining to this paper.
P. B. Joshi and B. Bagde (2026) offered a comparative analysis of reference-based P&O and INC techniques for identifying the MPP in PV systems. It regulates the output power of solar PV systems while examining the steady-state performance of both the P&O and INC methods, and analyzes the responses of each method to fluctuations in solar irradiance [34].
M. B. S. Bechekir, M. Brahami, H. Bendaho, and A. Brahimi (2025) focused on two primary MPPT methods: the P&O method and the INC approach in electrical systems. An analysis of the P&O control system indicated that it exhibits sluggish behavior and encounters difficulties in accurately tracking the MPP [35].
A. Lemmassi, A. Derouich, A. Hanafi, A. Byou, M. Benmessaoud, and N. El Ouanjli (2024) examined solar panels consisting of triple-junction solar cells utilized in CubeSats, specifically emphasizing the optimization of power output from these panels through the MPPT technique. The investigation employs both the P&O and INC methods. P&O is favored for its straightforward implementation and minimal equipment requirements, whereas INC is recognized for its superior tracking accuracy in challenging environments with rapidly fluctuating solar conditions [18].
S. Bharti, R. Kumar, Monika, and U. Sinha (2023) presented the P&O and INCMPPT algorithms for an PV system and compares the algorithms under specific temperature, irradiance, and ambient conditions. it provided implementation details and performance evaluations for the INC and P&O MPPT algorithms. The comparison indicates that the INC method exhibits greater efficiency and a faster tracking speed for the MPPT of a PV array [36].
M. Ahmad, A. Numan, and D. Mahmood (2022) conducted a comparative analysis of the P & O and INC algorithms across varying climatic conditions. The PV system and the MPPT techniques were examined through simulations using MATLAB/Simulink. The results indicate that the INC algorithm demonstrates superior performance compared to P & O concerning the speed of reaching the MPP, accuracy, and performance consistency under fluctuations in radiation and temperature [19].
D. Routray, P. K. Rout, and B. K. Sahu (2021) provided a concise overview of recently proposed methods, comparing the two techniques: P&O and INC, which are commonly utilized in real-time applications. A discussion of potential challenges and issues is included, serving as an important reference for system engineers aiming to enhance techniques for MPPT control in the future [37].
L. Assiya, D. Aziz, and H. Ahmed (2020) developed programmed algorithms for a photovoltaic generator aimed at optimizing the energy output from the generator. The algorithms were implemented using MATLAB Simulink and employed two methodologies: P&O and INC [38].
Rigorous research aimed at improving PV module efficiency, reducing the cost of PV panels, and maximizing power extraction from PV systems contributes to the rapid expansion of PV power generation. This study focuses on the challenges associated with integrating solar PV systems into electrical networks and presents proposed mitigation techniques with the use of MPPT techniques [39].
The PV array in this study is connected to a DC/DC converter, with the output from the boost converter supplying power to a common DC bus operating at 500 V. MPPT is implemented in the converter, utilizing this technique to optimize power output by adjusting the voltage at the terminals of the PV array. A three-phase Voltage Source Inverter (VSI) is used to convert the 500 V DC to 260 V AC while ensuring a unity power factor. Additionally, a 200-kVA 260V/25kV three-phase coupling transformer is employed to connect the converter to the grid.
The main contribution of the present paper is the examination of MPPT techniques within PV systems. The system comprises a PV array, a DC-DC boost converter, a VSI, and a utility grid. The MPPT technique is implemented to maximize power extraction from the PV array in response to fluctuating weather conditions. Among the MPPT techniques available, the P&O and the INC techniques are commonly utilized to achieve maximal power extraction from the PV array.
- DESCRIPTION OF SYSTEM UNDER STUDY
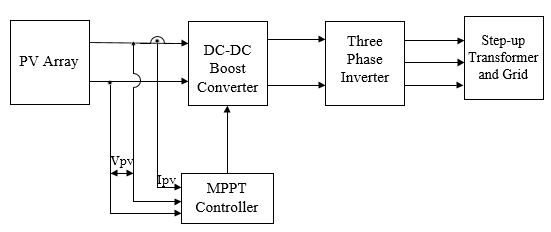
Figure 1 depicts a standard grid-connected PV system, which consists of the subsequent components:
- A PV system designed to provide a maximum power output of 100 kW under standard test conditions (STC), which are defined as a temperature of 25°C and an irradiance level of 1000 W/m².
- A boost converter designed for direct current (DC) to direct current (DC) conversion aims to enhance the output voltage of the PV system from 273.5 V DC to 500 V DC.
- A three-level, three-phase VSI utilized to convert the DC voltage generated by the PV array into an alternating current (AC) voltage of 220 V.
- A three-phase coupling transformer of 100 kVA and 260/25kV and grid.
Figure 1. Grid-connected PV array
- PV Model
The fundamental objective of a PV cell is to directly convert sunlight into electricity without the need for an intermediary conversion process. During operation, it generates no pollutants, is characterized by a robust and straightforward design, contributes to the reduction of global warming issues, is modular in nature, incurs lower operational costs, requires minimal maintenance, and is capable of producing power ranging from microwatts to megawatts [40]-[43]. The resistances of PV cells constitute a series of solar panels that can be configured in series or parallel arrangements. In practical applications, these cells are typically integrated and paired with a photovoltaic diode. Initially, the PV system functions as a current source; however, its characteristics change as the voltage across its terminals approaches the open circuit voltage, which complicates the modeling process [44][45]. A streamlined equivalent model for a PV cell is illustrated in Figure 2.
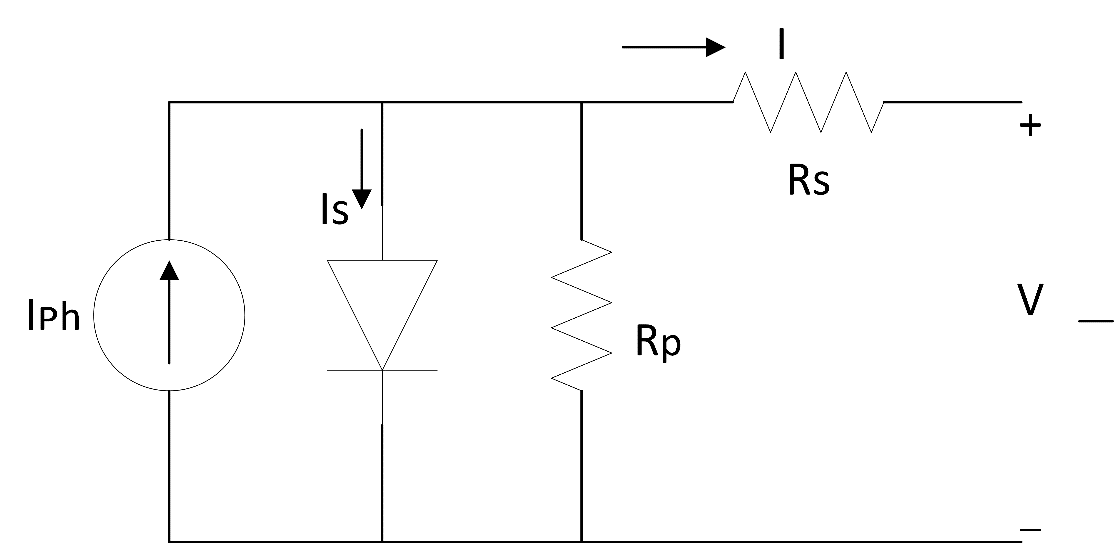
Figure 2. Streamlined model of PV cell
The PV systems discussed in this paper consist of PV system with a combined power output of 100 kW. This configuration includes Sixty-six modules are connected in series, while five modules are connected in parallel, resulting in a total output of 100.65 kW (66 x 5 x 305 W).
The fundamental equation that characterizes the I-V relationship of the photovoltaic model is expressed as follows:
| 
| (1) |
The current generated by light, is dependent on temperature and solar radiation, and is expressed as follows:
| 
| (2) |
The saturation current of a single diode as a function of the PV systems' operational temperature is depicted as follows:
| 
| (3) |
Where,  is the Cell Current (A),
  is the Photo Current (A),
  is the Saturation Current of Diode (A),
  is the Electric Charge of an Electron =1.6x
 (Coul),
  is the Boltzmann Constant (J/K),
  is the Output Voltage of the Cell (V),
  is the Series & Shunt Resistance(ῼ),
  is the Irradiance (W/m²),
  is the Irradiance at STC,
  is the Operating Temperature of Cell (
 ,
,  is the Operating Temperature of Cell at STC (
 is the Photo Current at STC,
  is the Coefficient of Short Circuit Current [46]. The characteristics of the I-V and P-V array are illustrated in Figure 3.
Figure 3. The I-V and P-V characteristics of photovoltaic system [47]
- Boost Converter Model
The boost DC-DC converter is positioned between the PV panel and the grid system to adjust the output voltage in relation to the MPP. The corresponding circuit model of the boost converter is illustrated in Figure 4, which includes the components of input source voltage ( ), inductor (
 ), diode (
 ), switch (
 ), capacitor (
 ), and output voltage
 . Depending on the output requirements, the switch can either be opened or closed, ensuring that the output voltage exceeds the input voltage. The primary advantage of this converter design is its ability to elevate voltage levels without the need for a transformer. Additionally, it provides enhanced efficiency through the use of a single switching component [1],[48],[49]. Table 1 outlines the specifications of PV module and boost converter.
The equations used for modeling derived from the Kirchhoff's laws, are as indicated [44],[50],[51]:
| 
|
|
| 
| (4) |
The correlation between the voltages at the input and output is presented by:
| 
|
|
| 
| (5) |
Where, is the Voltage at the input (V),  is the Output Voltage (V),
  is the Input Current (A),
  is the Inverter Input DC Current (A), is the Boost Inductance (mH), is the Capacitor (
 F),
F),  is the Switch's on Time Period (Sec),
  is the Switch's Off Time Period (Sec), is the Duty Cycle (Unit less),
  is the State of Switch.
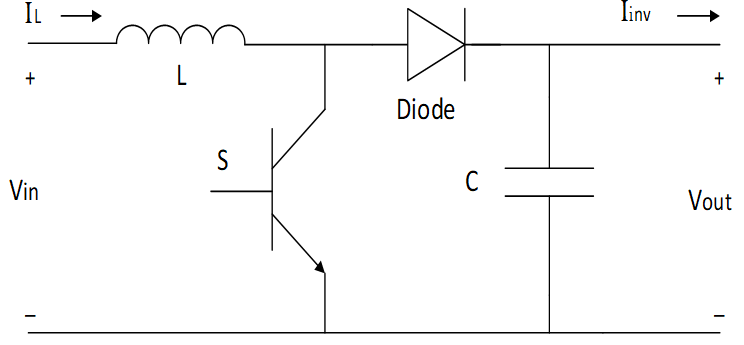
Figure 4. DC boost converter's Schematic representation
Table 1. Specifications of PV module and boost converter
PV model | SunPower SPR-305-WHT |
Cells per module (Ncell) | 96 |
Maximum power | 305 W |
Short circuit current ( ) ) | 5.96 A |
Open circuit voltage ( ) ) | 64.2 V |
Maximum power current ( ) ) | 5.58 A |
Maximum power voltage ( ) ) | 54.7 V |
Series resistance (Ω) | 0.37152 |
Shunt resistance (Ω) | 269.5934 |
Diode ideality factor | 0.94504 |
Inductance (H) | 5e-3 |
Capacitance (µf) | 12000 |
Switching frequency (kHz) | 5 |
Sampling rate | 
|
- Electrical Grid
The systems that are integrated with the electricity grid are referred to as "grid-connected" systems. This configuration allows for the injection of electrical energy generated by photovoltaic arrays into the public electricity grid. In grid-connected systems, conventional power consumers are linked to the generator through an inverter, which functions as a DC-AC converter. The role of the inverter is to convert the DC produced by the solar panels into AC. The inverter serves as a fundamental component of these systems, taking the place of batteries typically used in other configurations [52]-[54]. This paper employs the Pulse Width Modulation (PWM) technique to control inverters in PV systems. The objective is to enhance power quality, mitigate harmonic distortion, and reduce the switching and conduction power losses of the VSI, thereby optimizing overall system performance [55].
- Methods for Obtaining MPPT
To raise the output voltage of a PV panel, which has nonlinear characteristics and whose efficiency is affected by irradiance levels and ambient temperature, a boost converter is a suitable option [56]. Achieving a high output voltage with a standard boost converter necessitates a high duty cycle. Nevertheless, using a high duty cycle can adversely affect the performance of the converter. To preserve a high voltage ratio while steering clear of excessively high duty cycles, a cascade DC-DC boost converter can be used. As a result, PV panels operate at their maximum power [57][58]. A large step size enables rapid tracking of changes in sunlight but increases power oscillations around the MPP. Conversely, a small step size reduces oscillations for stable power output but slows the tracking response [59]. The primary principle of MPPT is to optimize the extraction of power from the PV panel by operating it at its most efficient voltage. Under varying solar radiation and ambient temperature conditions, the PV panel produces different DC power outputs for the load. Depending on the applied MPPT technique, the output of the PV panel is monitored to determine the optimal power delivery to the system [56]. The most frequently employed are Perturb and Observe (P&O) and Incremental Conductance (INC), which will be the focus of the present study [60][61].
- Perturb and Observe (P&O) Method
The P&O Method is a straightforward technique employed for achieving MPPT in PV systems. The P&O algorithm necessitates the utilization of both voltage and current sensors to compute the output power and identify the direction of perturbation [62]. The implementation cost is relatively low, making it straightforward to apply. The time complexity of this method is quite minimal; however, when the algorithm approaches the maximum power point (MPP), it does not cease operation and continues to perturb in both directions. This behavior occurs when the algorithm is very close to the MPP, prompting the possibility of establishing an appropriate error threshold or employing a waiting function, which ultimately leads to increased time complexity. Furthermore, the P&O method does not account for rapid changes in irradiation levels-which can affect the MPP-treating these variations instead as perturbations, potentially resulting in inaccurate MPP calculations. To mitigate this issue, the Incremental Conductance Method can be utilized [63][64].
This method involves tracking the MPP by assessing power levels across various samples and intermittently adjusting the voltage or current. The procedure persists until the peak point is achieved, where the variation in power relative to voltage equals zero. In this approach, both the output voltage and current ( ) of the photovoltaic panel are monitored. The power, P (k), is then calculated and contrasted with the power measured in the preceding sample, P (k-1), to determine the change in power (DP). The P-V curve showing the P&O algorithm for obtaining MPPT is illustrated in Figure 5 and the flowchart of P&O method is presented in Figure 6. Based on the signs of DP and the change in voltage (DV), the converter's duty cycle is adjusted for attainment of MPP, as detailed in Table 2 [64][65]. The initial value for boost converter duty cycle (D) used in this paper = 0.5 and the increment value used to increase/decrease (Delta D) = 3e-4.
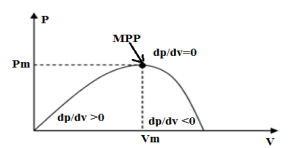
Figure 5. P-V curve showing the P&O algorithm for obtaining MPPT
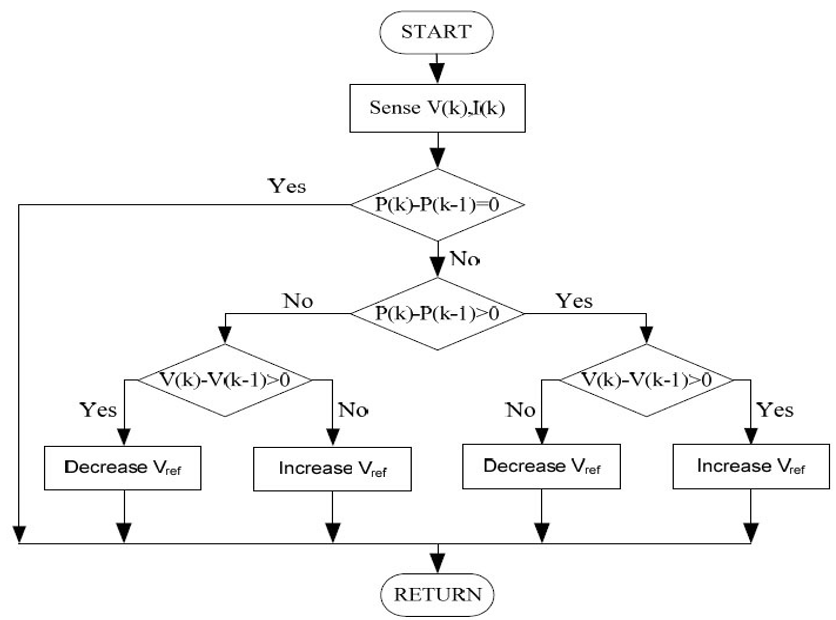
Figure 6. Flowchart of the P&O Method
Table 2. PV curve states of P&O technique
S.No. | PV Power's Change | PV Voltage's Change | Duty Cycle |
1 | Positive | Positive | Positive |
2 | Positive | Negative | Negative |
3 | Negative | Negative | Positive |
4 | Negative | Positive | Negative |
5 | No change |
| No change |
- Incremental Conductance (INC) Method
The INC Method utilizes two sensors of voltage and current to measure the photovoltaic's output voltage and current.
| 
| (6) |
This method allows for the simultaneous sensing of both PV voltage and current, thereby eliminating errors caused by variations in irradiance. However, the complexity and cost of implementation increase, making it more suitable for highly complex systems complex systems such as partially shaded or rapidly changing PV environments. The P&O and INC algorithms are among the greatest commonly used algorithms. The P&O method is suitable for systems where simplicity of implementation is desired, while the INC method is more appropriate for highly complex systems [63],[66].
At MPP change in output power of the photovoltaic panel with respect to output voltage is zero, indicating that the PV curve's slope is flat.
| 
|
|
| 
| (7) |
Differentiating  with respect to
  and setting it equal to zero results in
| 
| (8) |
| 
| (9) |
Equation (7) and Equation (8) is the foundation of INC method. In this context,  represents the conductance and previous values of the solar panel's voltage and current are measured and utilized to compute the
  &
&  values as demonstrated in Figure 7 and the INC method's flowchart presented in Figure 8 [67]. Consequently, in INC method, the instantaneous panel conductance is analyzed in relation to the incremental panel conductance
  ,which is displayed in equation 9. Voltage at MPP is monitored to ensure
 , which corresponds to the MPP, as illustrated in Table 3 [65],[68]. The comparison between P&O and INC techniques for MPPT is illustrated in Table 4. The INC technique generally exhibits superior tracking behavior compared to P&O; however, it still encounters challenges due to significant, high-speed fluctuations in irradiance [69][70].
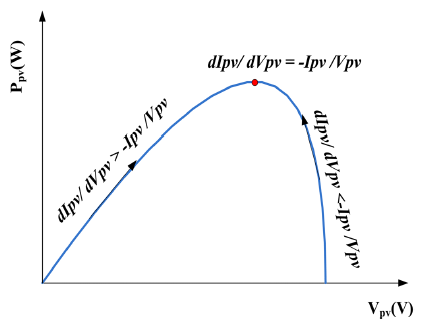
Figure 7. P-V curve showing the INC method for obtaining MPP
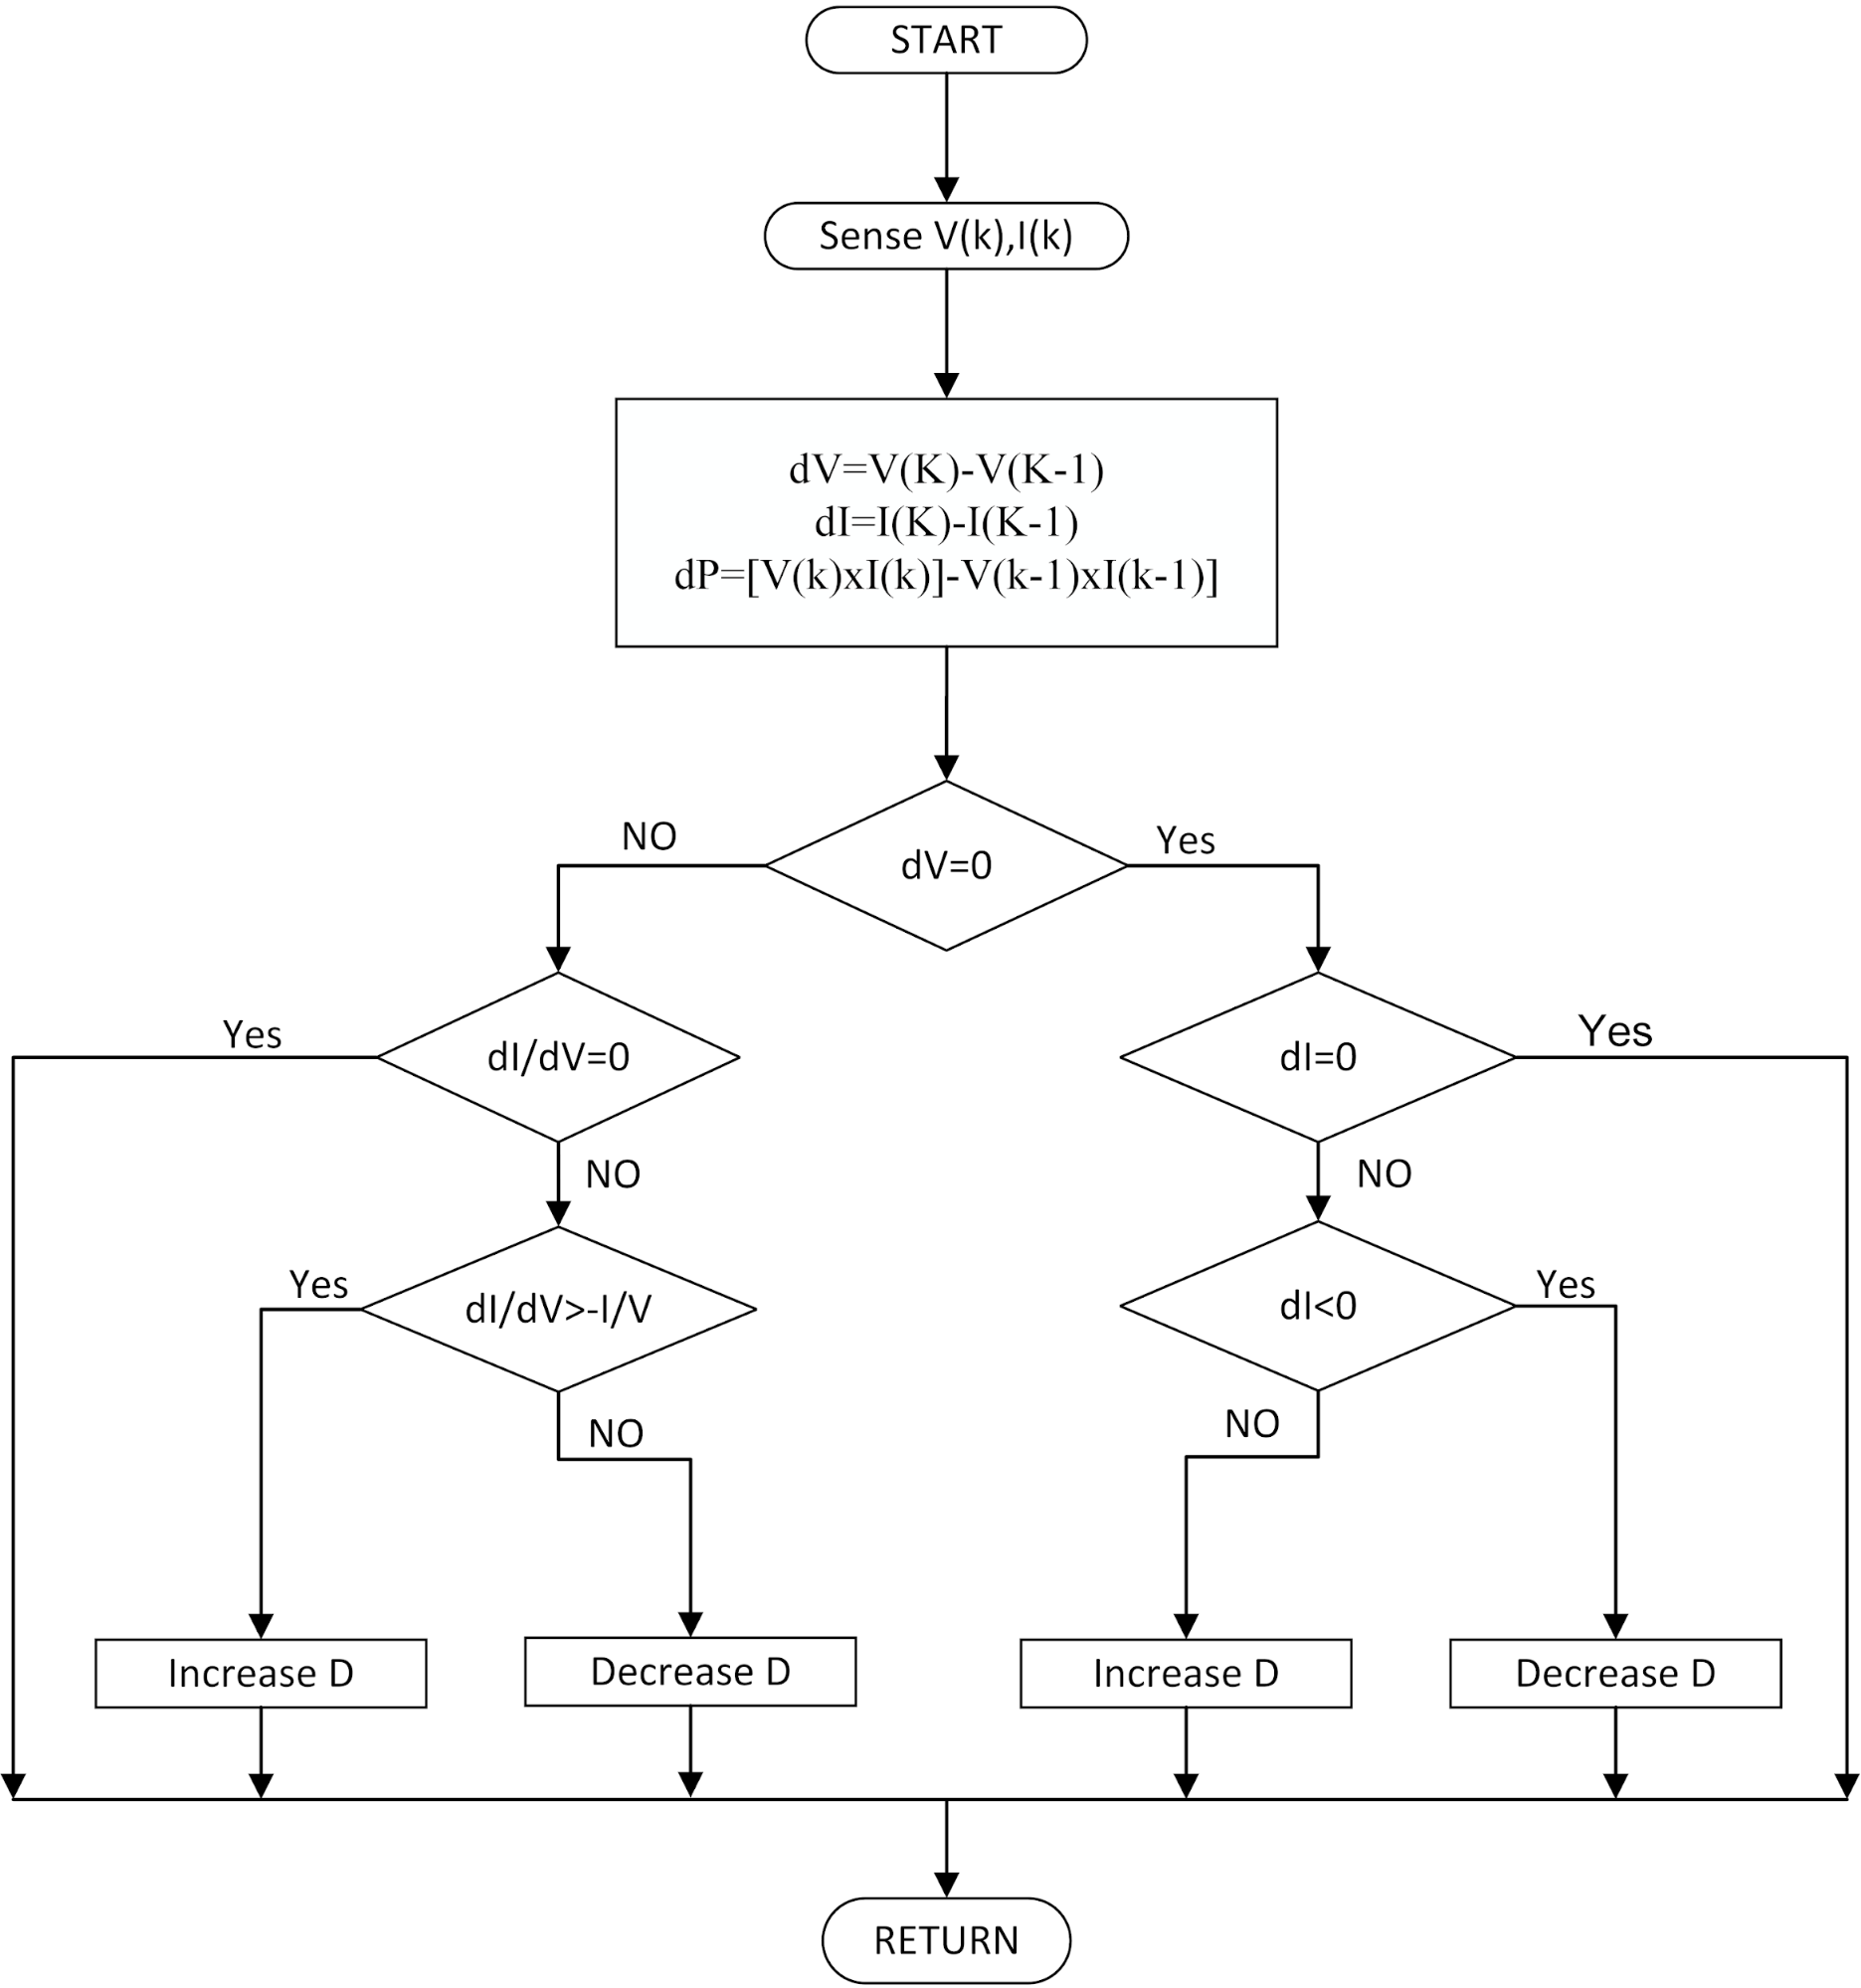
Figure 8. Flowchart of the INC method
Table 3. PV curve states of INC technique
S.No. | 
| 
| PV curve |
1 | 0 | 
| MPP |
2 | -ve | 
| Right of MPP |
3 | +ve | 
| Left of MPP |
Table 4. Comparison between P&O and INC techniques
Feature | P&O | INC |
Complexity | Simple | Complex |
Response Time | Faster | Slower |
Accuracy | Low (oscillates around MPP) | High (minimal oscillation) |
Rapid Irradiance Change | Poor performance | Better performance |
Application | Low-cost, steady weather systems | High-performance, fluctuating weather systems |
- SIMULATION RESULTS
To evaluate the effectiveness of the photovoltaic system, a MATLAB/Simulink model of the MPPT system, as illustrated in Figure 9, has been developed. The system components specifications are detailed in Table 5. In this analysis, the system operates initially under STC of 25℃ and 1000 W/m². Subsequently, the solar radiation (G) as well as temperature (T) are varied over time, as illustrated in Figure 10 and Figure 11, to highlight the effects of these variations on the PV system during the simulation. It is noted that the simulation type is discrete, and the sample time is sec in Simulink.
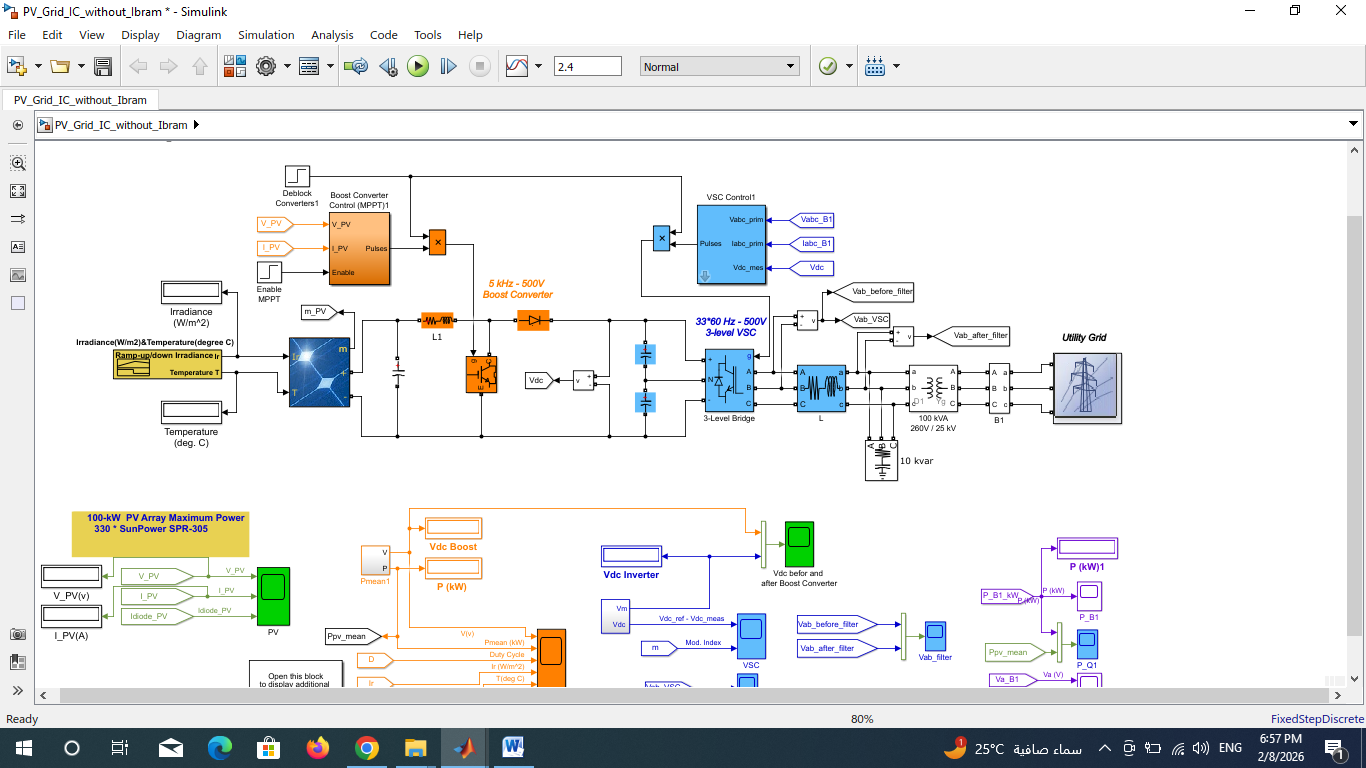
Figure 9. Complete grid-connected photovoltaic system in Simulink
Table 5. Specifications of system components
SN. | System Component | Parameters | Value |
1 | PV System | Maximum Power | 100 kW |
Operating Conditions | 1000 W/m2 |
25 °C |
Maximum System Voltage | 500 V |
2 | Boost Converter | Voltage Level | 500 V |
3 | Inverter | Maximum Voltage | 260 V |
Nominal Power | 100 kW |
4
| 3-phase Transformer and Utility Grid | Apparent Power | 100 KVA |
Step-up Transformer | 260 V / 25 kV |
Distribution System | 25 kV |
Transmission System | 120 kV |
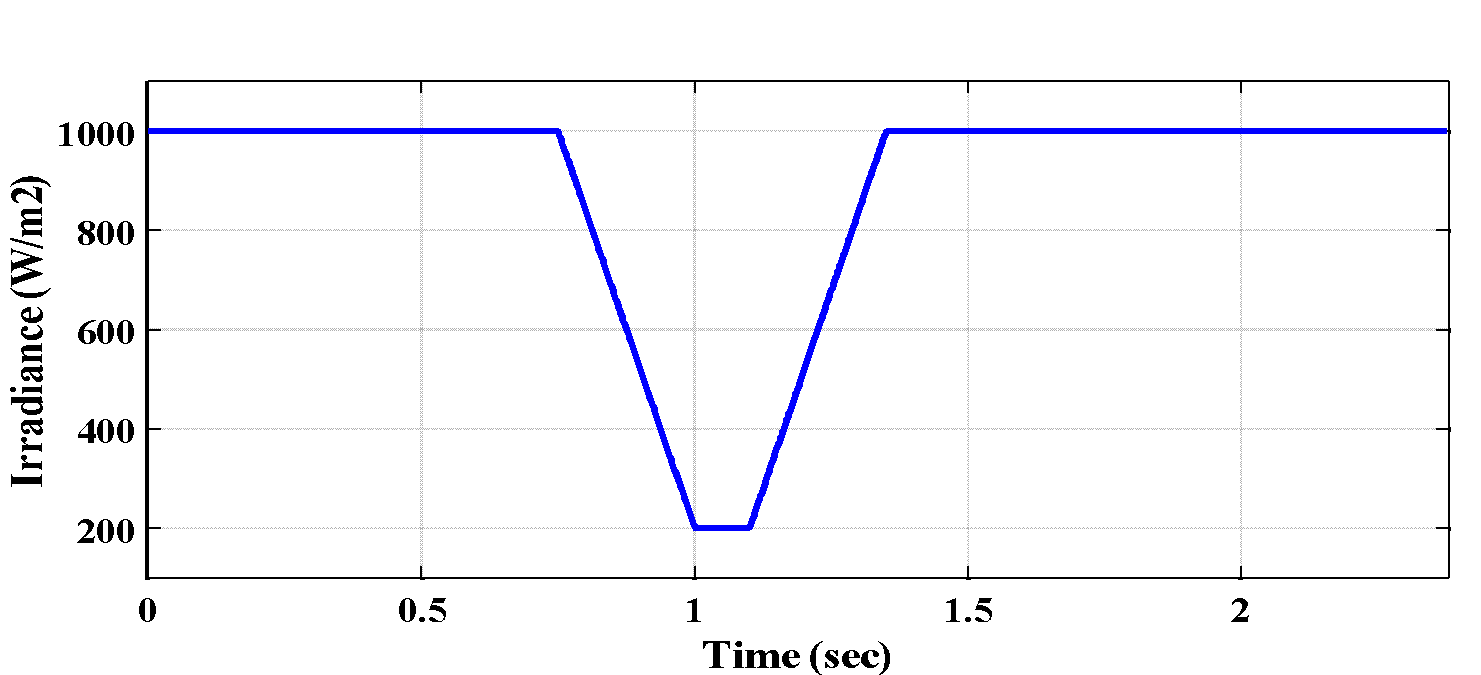
Figure 10. Irradiance change (W/m²)
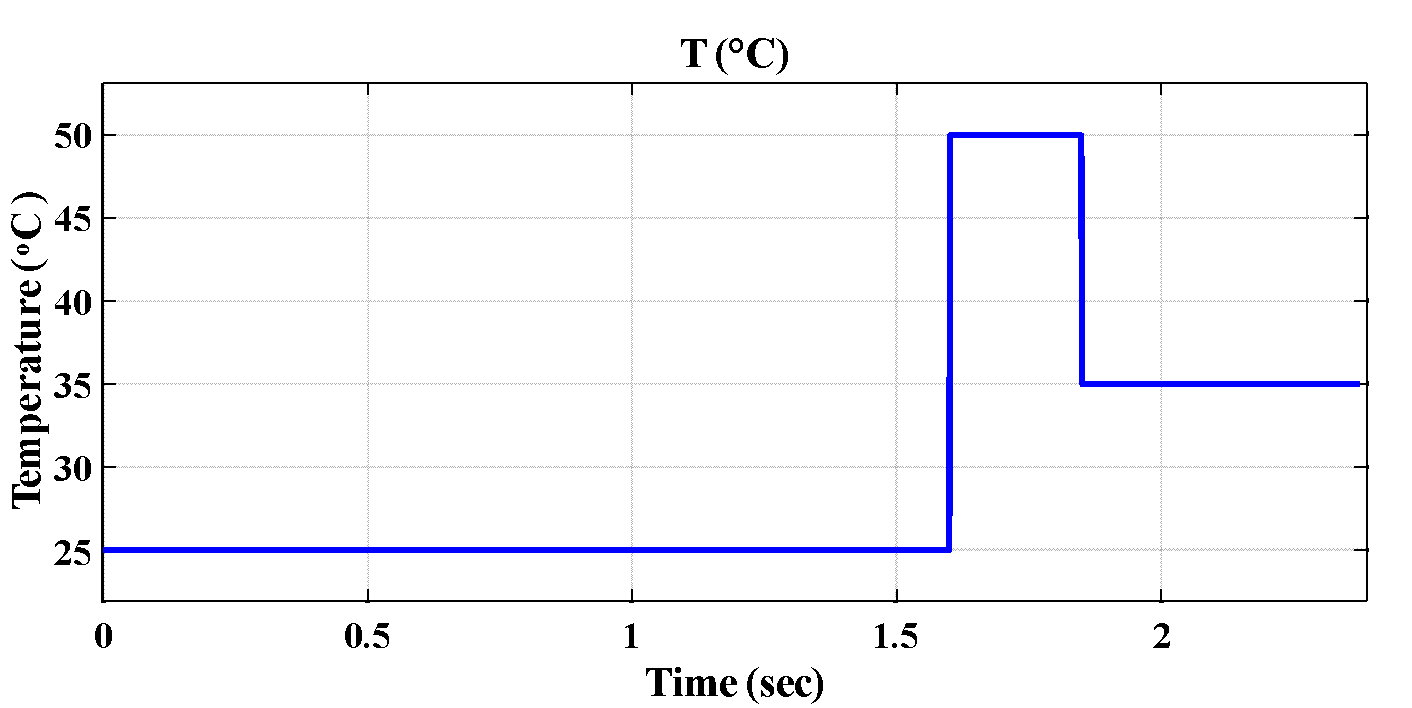
Figure 11. Temperature change ( ͦ C )
- The Waveforms of PV System Without MPPT
Figure 12 to Figure 15 illustrate the PV system's performance linked to the utility during variations in solar radiation (G) as well as temperature (T) in the absence of MPPT. Figure 12 indicates that the PV's output voltage (VPV) exhibits slight changes in response to variations in G from  sec to
  sec. During the interval from
  sec to
  sec, the output voltage exhibits a slight reduction in response to change in T. Figure 13 presents the response time of the PV's output current (IPV) under the same conditions. This figure demonstrates that IPV increases and decreases linearly in association with changes in irradiance during the interval from
  sec to
  sec. Conversely, there is a slight decrease in output current due to temperature variations during the interval from
  sec to
  sec. Additionally, Figure 14 depicts the output power response time of the photovoltaic system (PPV), which is shown to depend on the variations of VPV and IPV. The photovoltaic system generates a maximum output power of 95.37 kW without MPPT. Lastly, the boost converter's duty cycle remains nearly consistent, as illustrated in Figure 15, due to the photovoltaic array's operation without MPPT.
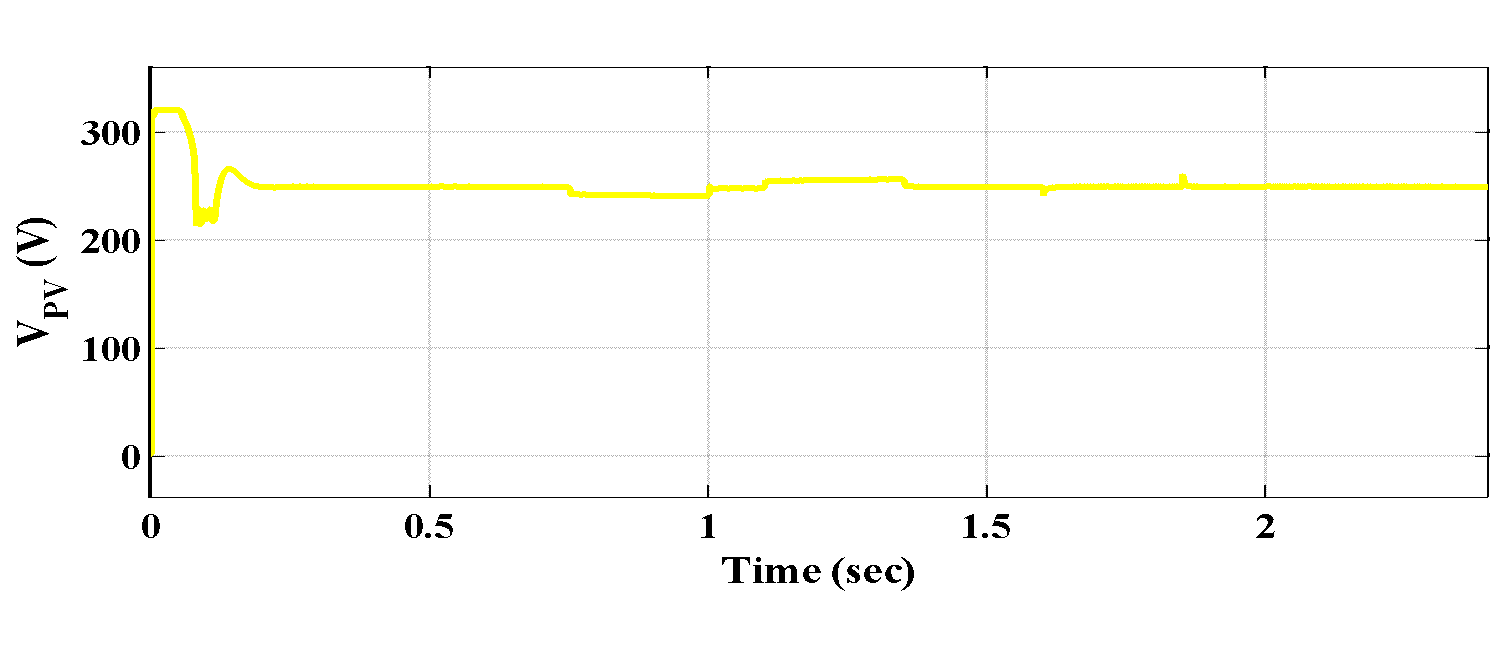
Figure 12. Voltage produced by the photovoltaic array without MPPT
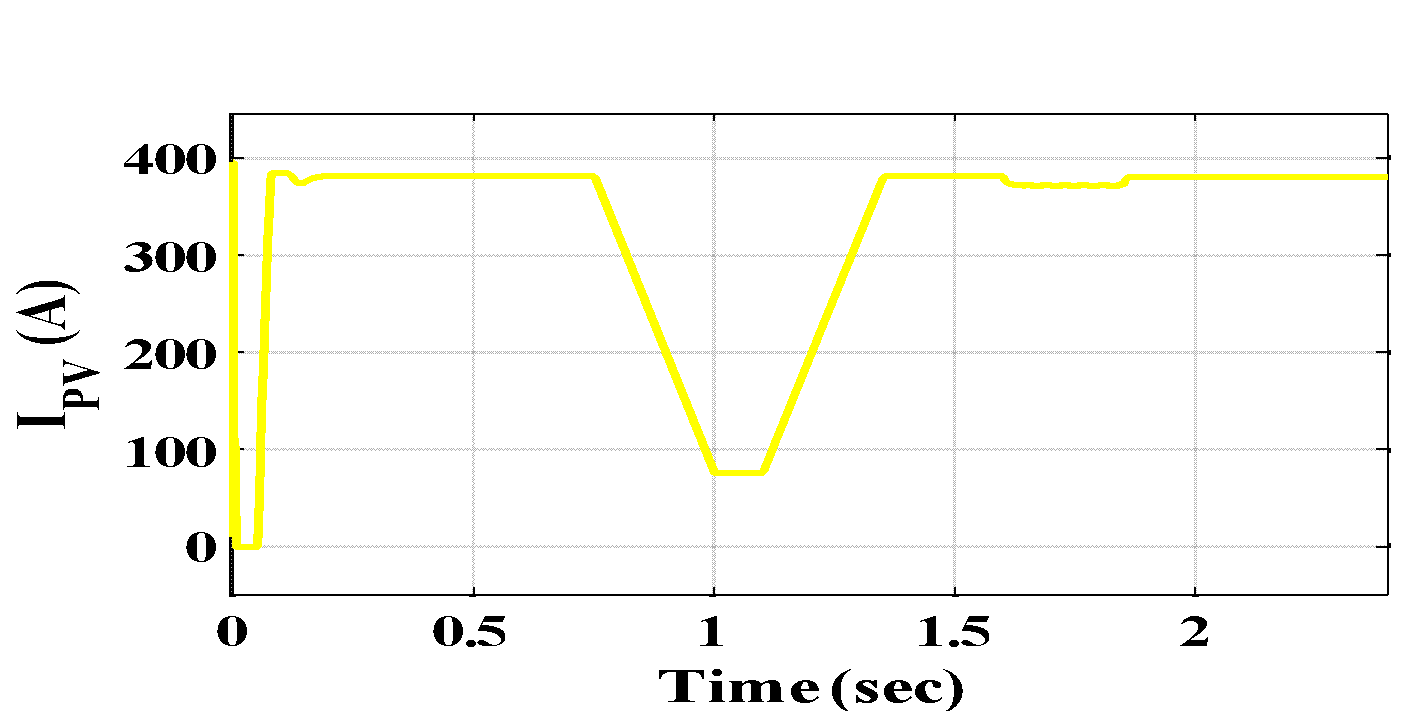
Figure 13. Current produced by the photovoltaic array without MPPT
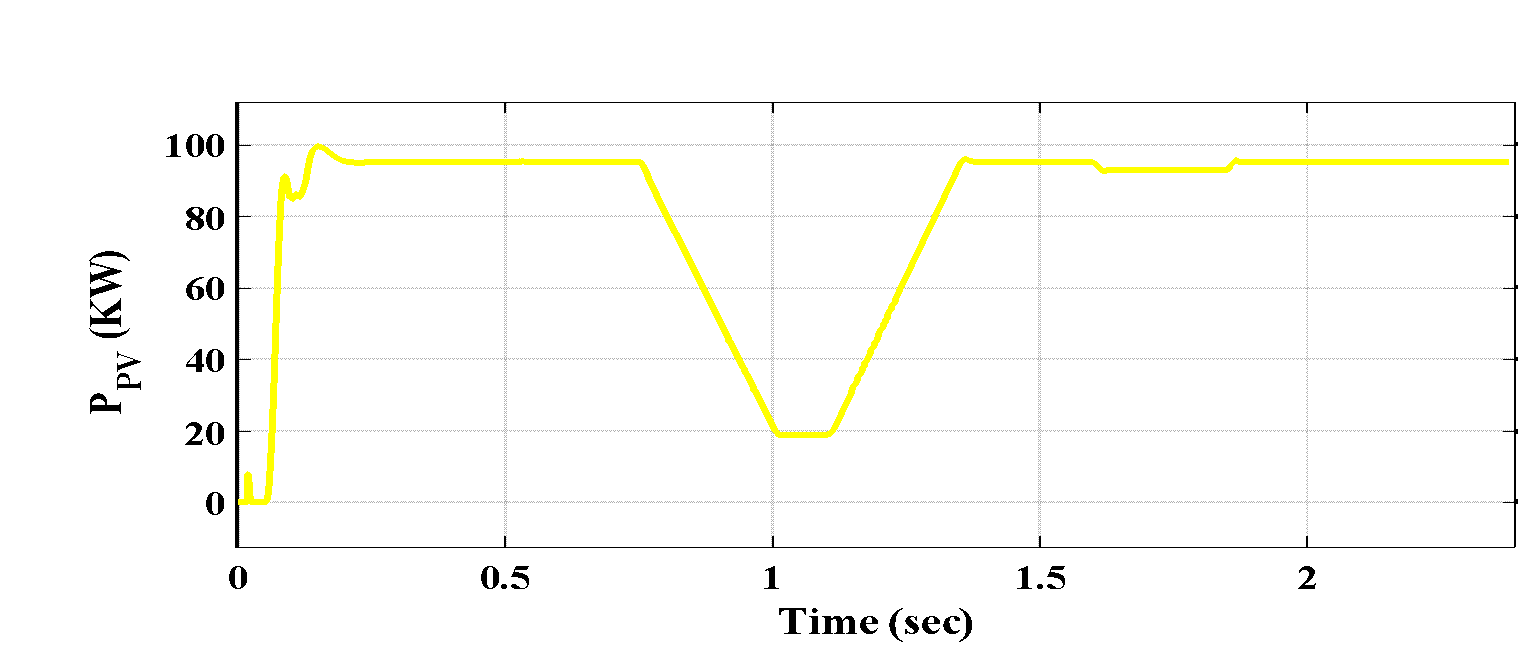
Figure 14. Power generated by PV array Without MPPT

Figure 15. Duty Cycle of converter using P&O algorithm
- Waveforms of PV System Using P&O Algorithm
Figure 16 to Figure 19 illustrate the PV system's performance linked to the utility during variations in solar radiation (G) as well as temperature (T) using the P&O method. The PV's output voltage () experiences slight fluctuations in response to changes in irradiance from sec to sec. In contrast, a minor reduction in output voltage is observed in relation to temperature changes between sec and sec, as depicted in Figure 16. Figure 17 presents the response time of the PV's output current ( ) throughout the same variations. The output current displays linear increases and decreases corresponding to changes in irradiance in the interval from sec to sec. A minor reduction is observed as a result of temperature fluctuations occurring between sec and sec. Additionally, Figure 18 shows the time response of the PV array's output power (), indicating that the output power is influenced by the fluctuations in VPV and IPV. The PV system achieves an output power capacity of 98.25 kW through the application of the P&O technique. To enhance the power output from the photovoltaic system, the boost converter's duty cycle is adjusted, as detailed in Figure 19. This approach demonstrates an improvement in the photovoltaic array's output power utilizing the P&O algorithm. Figure 20 illustrates the Total Harmonic Distortion (THD) measured in the system utilizing the P&O technique, which is recorded at 2.1%. This value is significantly below the prescribed limit of 5%.
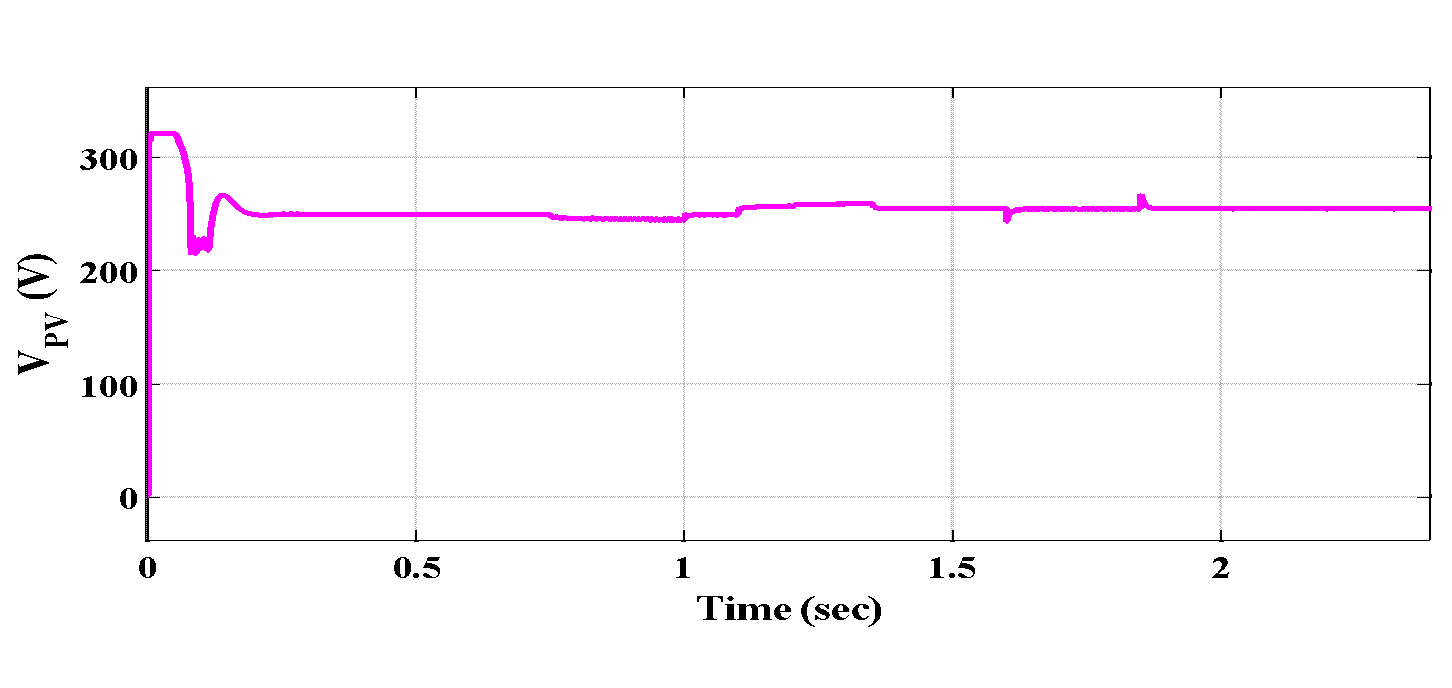
Figure 16. Voltage generated by the photovoltaic array using P&O technique
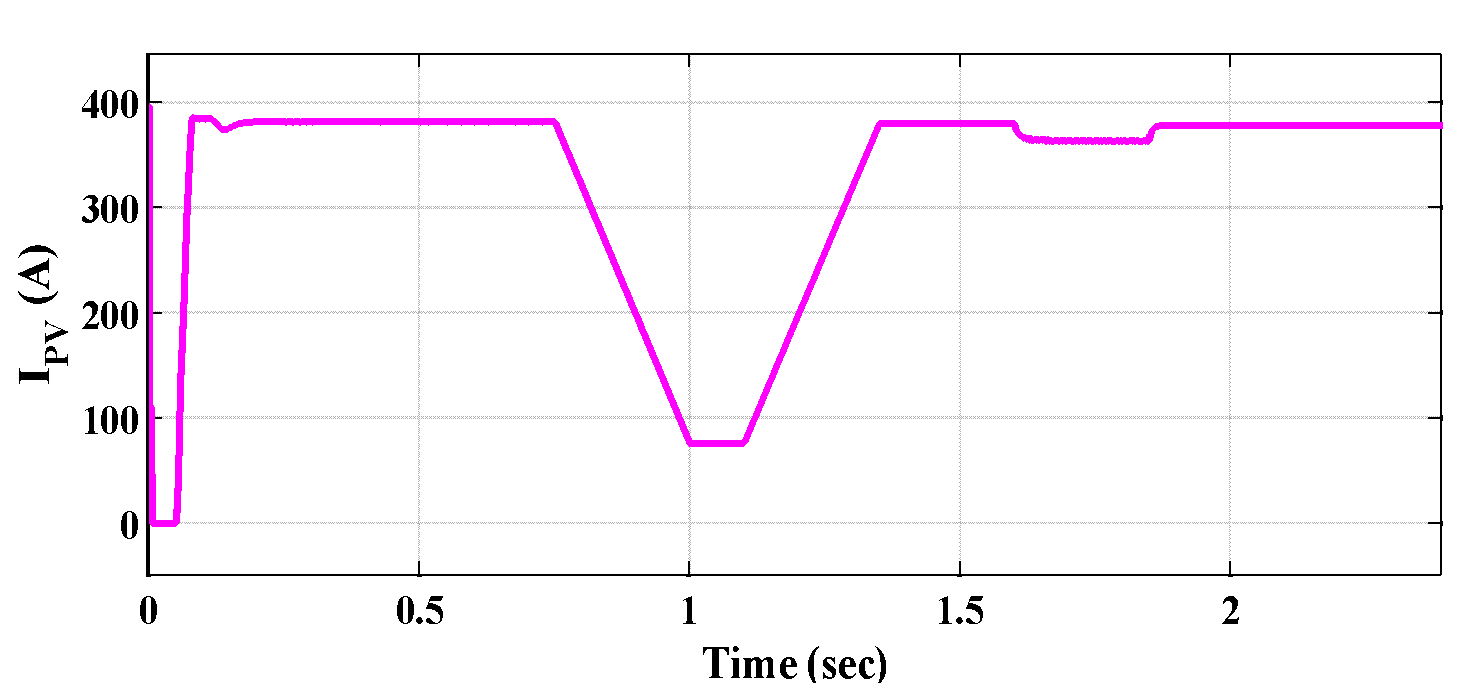
Figure 17. Current generated by photovoltaic array using P&O technique
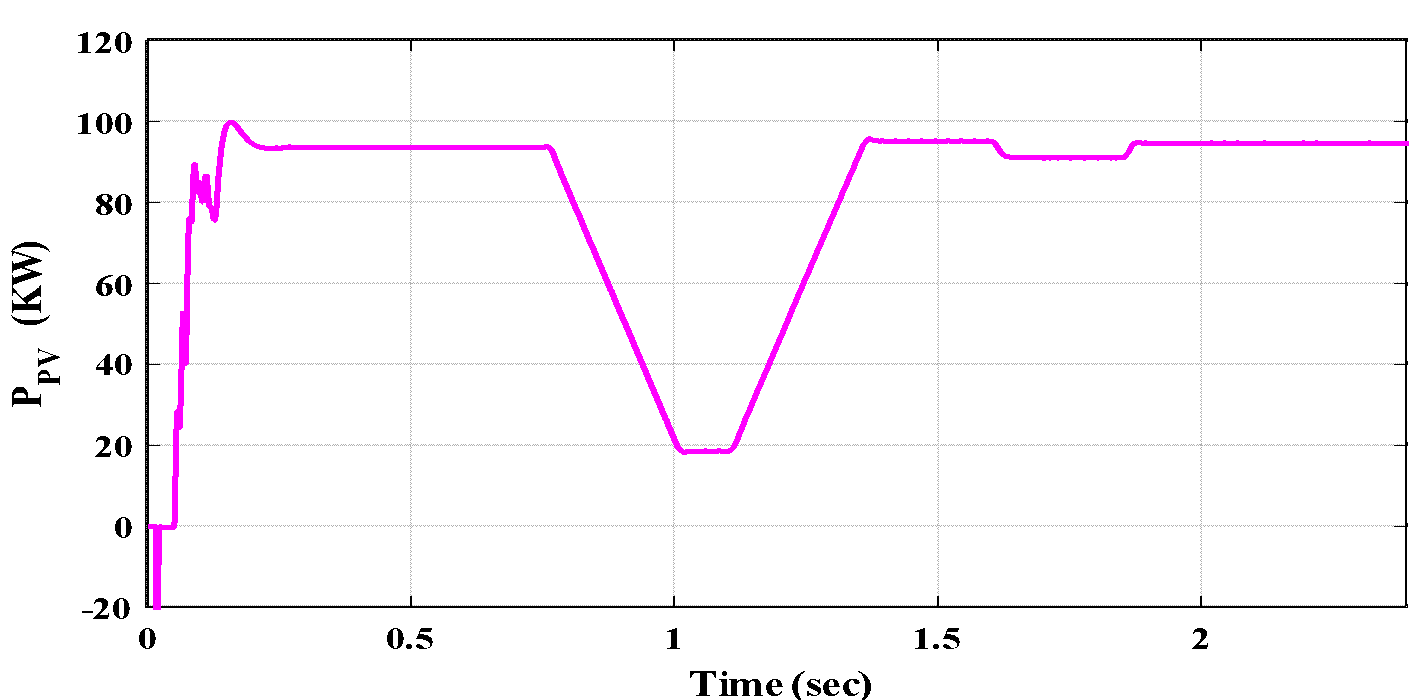
Figure 18. Power generated by PV array using P&O algorithm
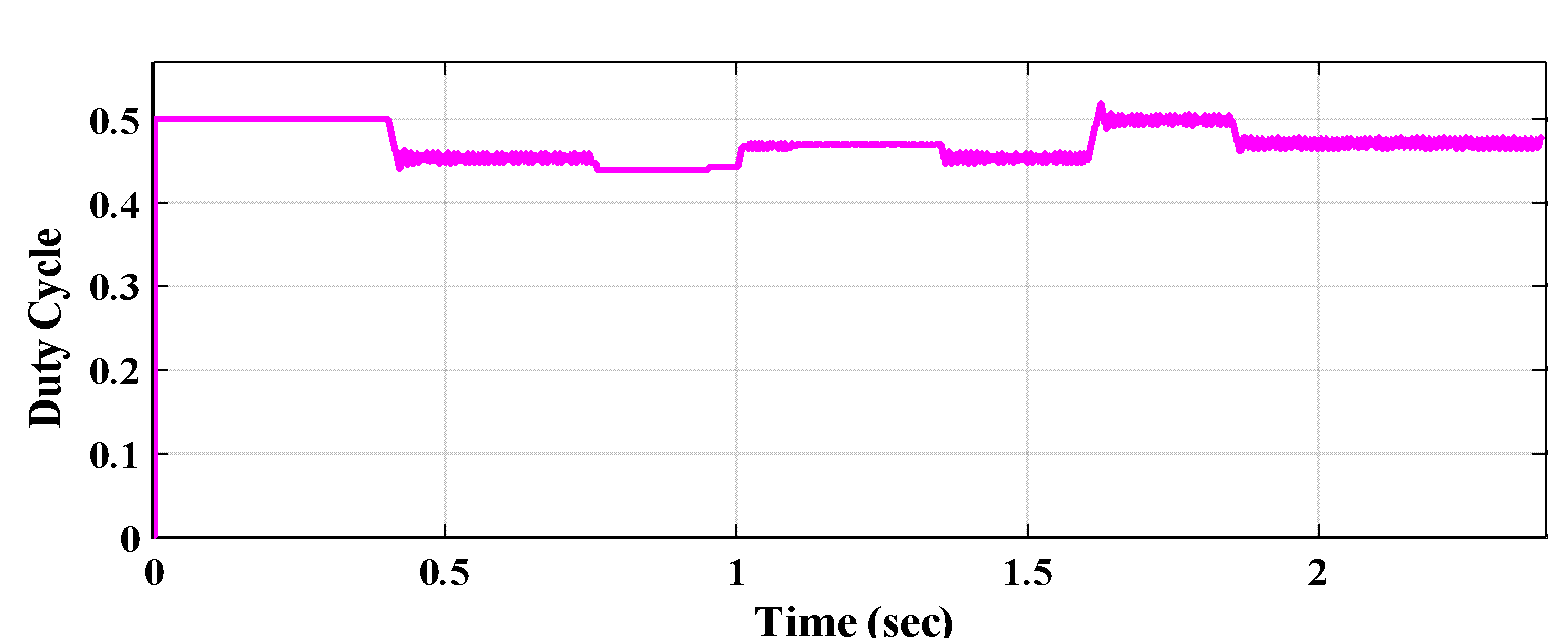
Figure 19. Converter's duty cycle of converter using P&O technique
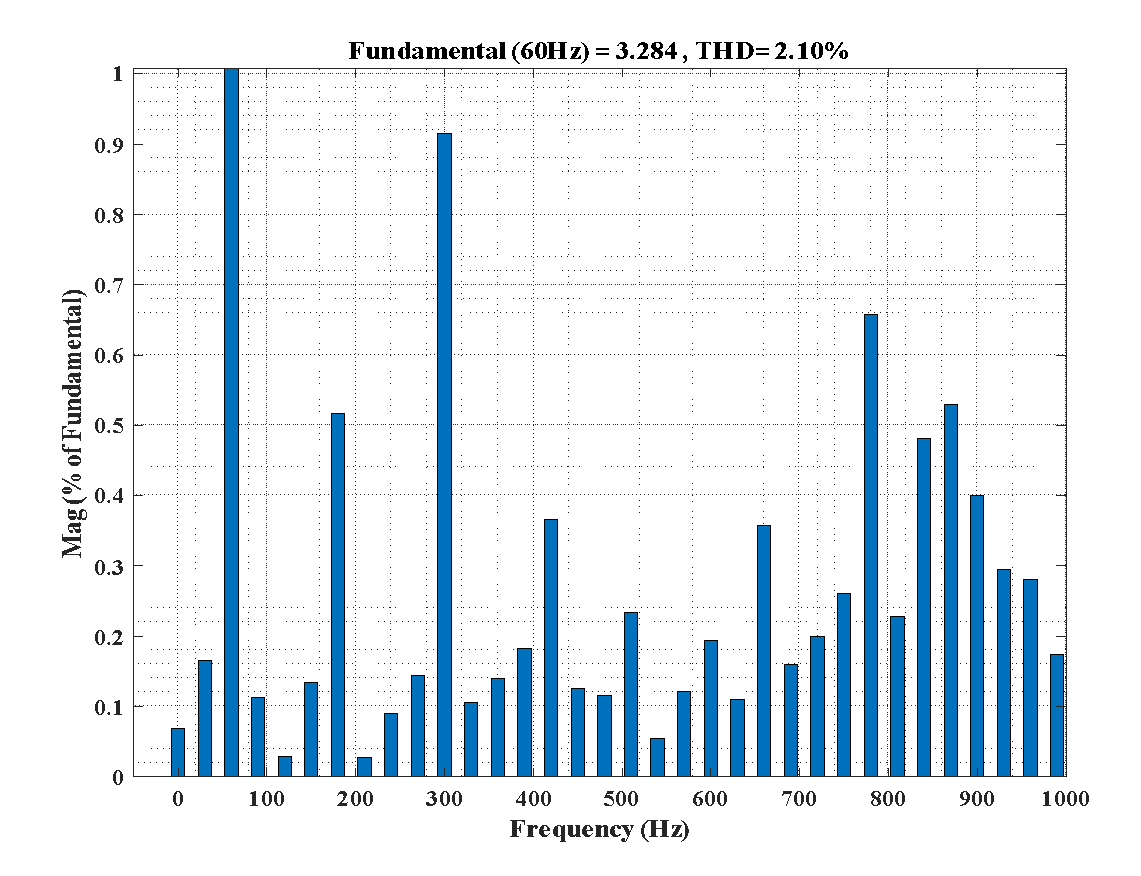
Figure 20. THD analysis of grid connected PV system using P&O technique
- Waveforms of PV System Using INC Algorithm
Figure 21 to Figure 24 illustrate the PV system's performance linked to the utility during variations in solar radiation (G) as well as temperature (T) utilizing the INC method. The PV's output voltage of the PV () exhibits slight increases and decreases corresponding to variations in G during the interval from sec to sec. Conversely, the output voltage decreases in response to changes in T from sec to t=1.85 sec, as depicted in Figure 21. Figure 22 presents the response time of the PV's output current () throughout variations in G and T. The data presented indicate that the PV's output current exhibits a linear increase and decrease in response to variations in irradiance between sec and sec. During the interval from sec to sec, only minor fluctuations in output current are observed as a result of temperature variation. Additionally, Figure 23 displays the time response of the PV array's output power of the PV array (), revealing that the variation in output power is influenced by the fluctuations in and . The PV system reaches an output power capacity of 100.37 kW through the application of the INC technique. The boost converter's duty cycle is adjusted, as detailed in Figure 24, to optimize MPP extraction from the photovoltaic system. This approach results in improved output power performance of the PV array using the INC algorithm in contrast to the P&O algorithm. Figure 25 demonstrates the THD recorded in the system employing the INC technique, which is noted at 1.94%. This value is substantially below the specified limit of 5% and is lower than the THD observed with the P&O technique.
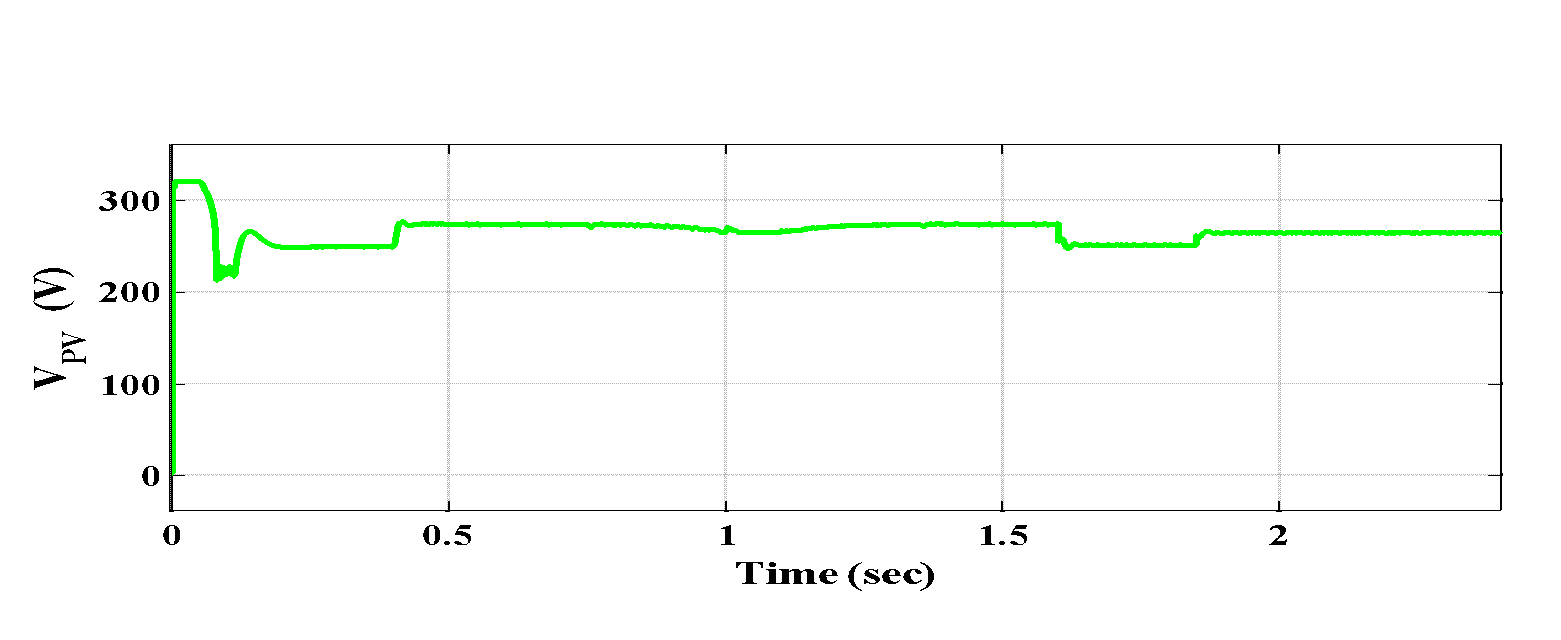
Figure 21. Voltage generated by PV array using INC algorithm
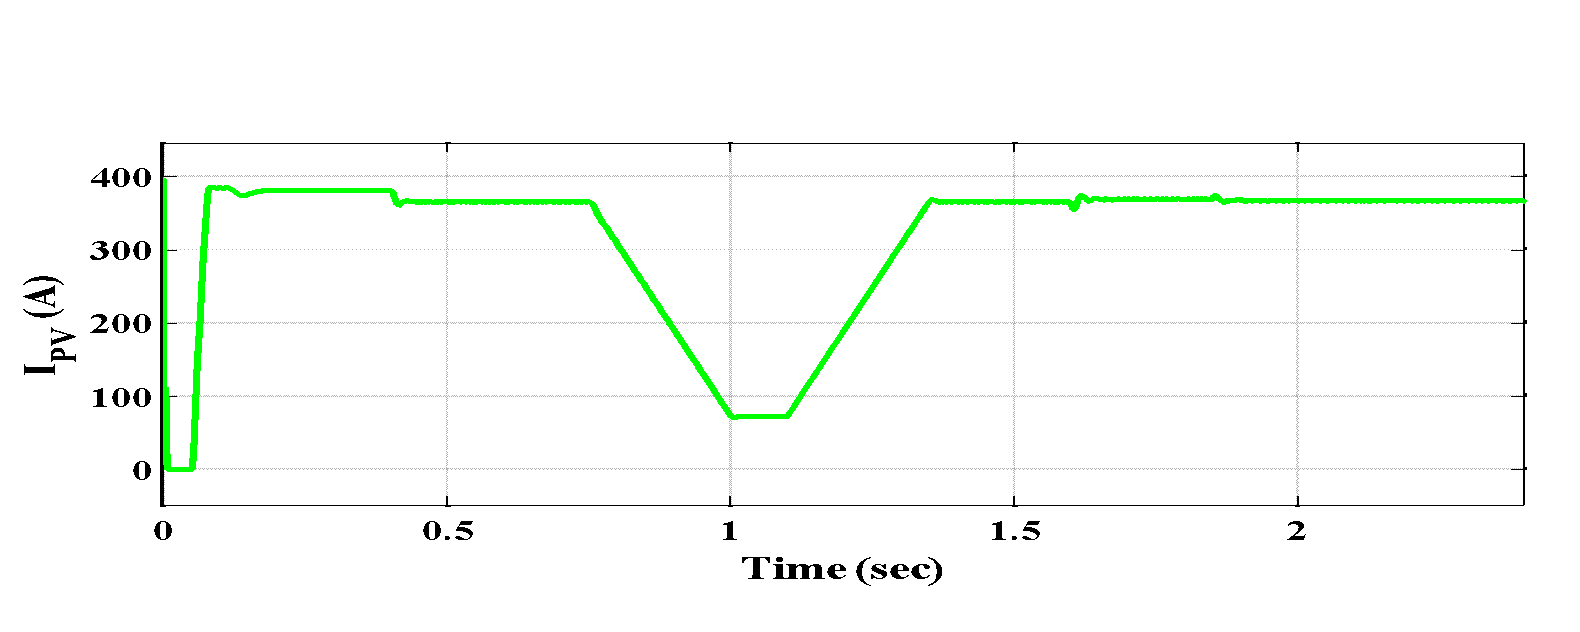
Figure 22. Current generated by PV array using INC algorithm
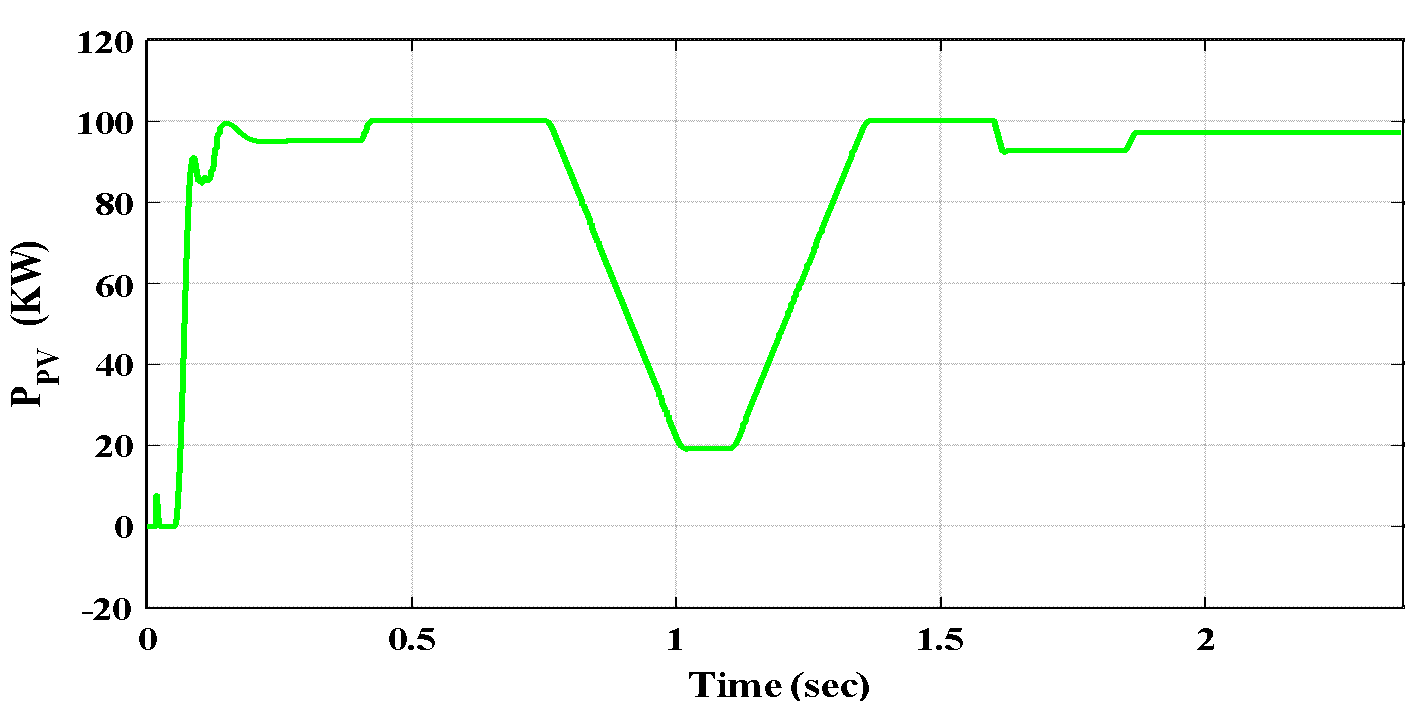
Figure 23. Power generated by PV array using INC algorithm
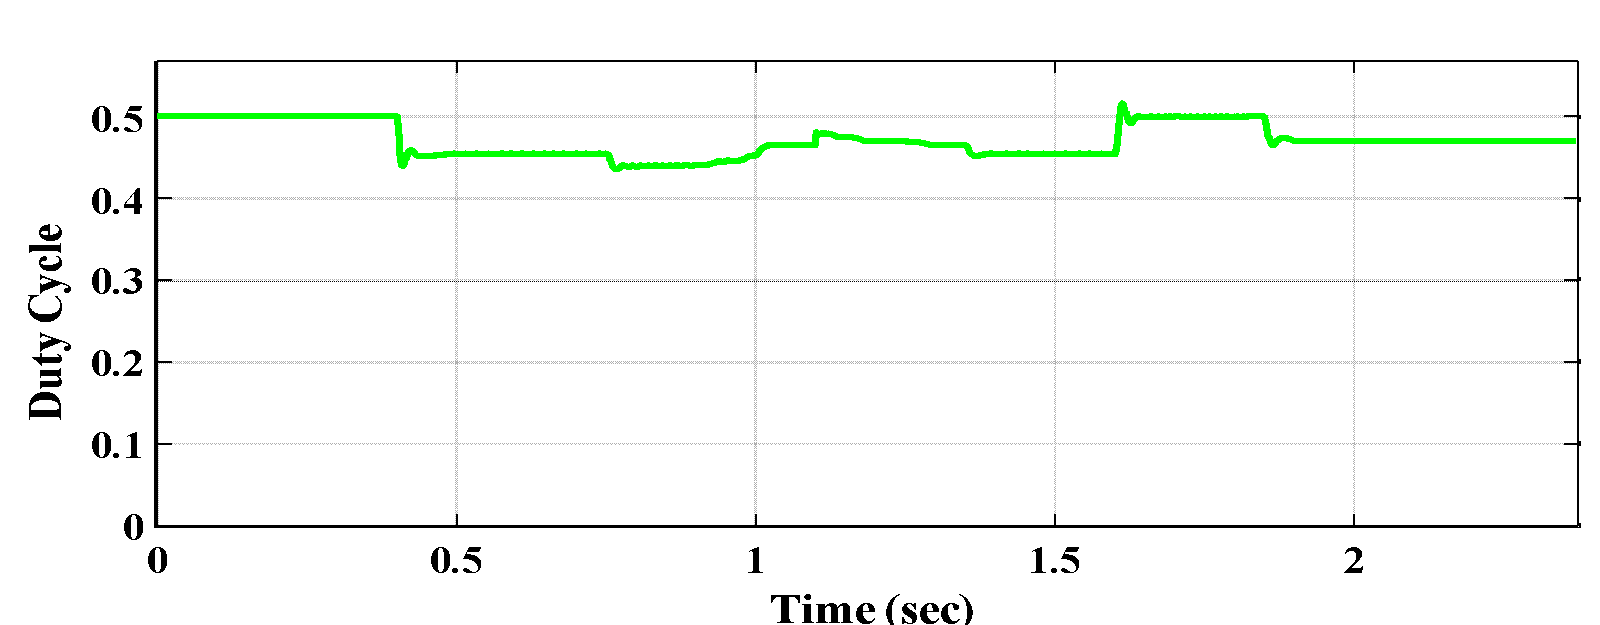
Figure 24. Duty cycle of converter using INC algorithm
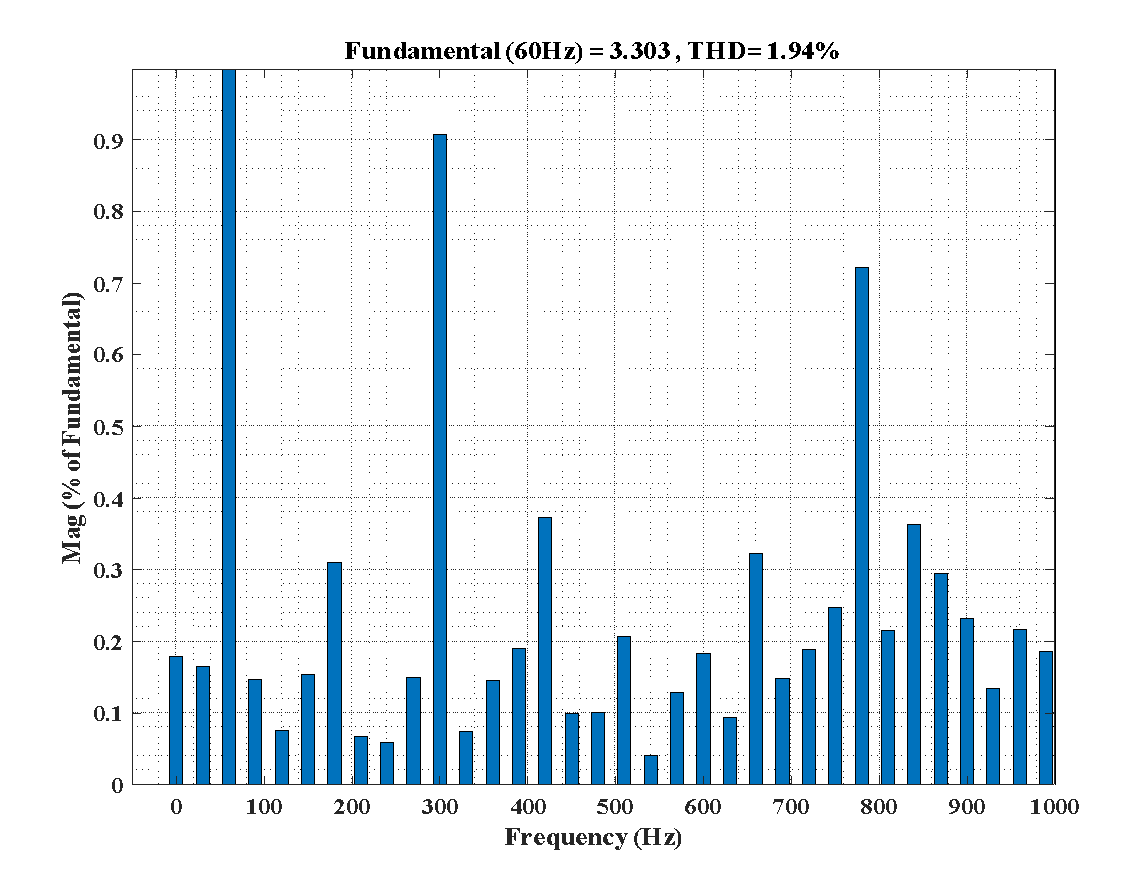
Figure 25. THD analysis of grid connected PV system using INC technique
Figure 26 illustrates the PV system's output power in the absence of MPPT, alongside the P&O method, and the INC technique. This comparison is conducted during variations in solar radiation as well as temperature. The waveforms of the output power indicate that the INC technique is capable of accurately achieving MPPT under fluctuating irradiance and temperature conditions, in contrast to the P&O technique and the scenario where MPPT is not utilized. The transient response of a PV system equipped with MPPT pertains to the speed and precision with which the controller attains a new MPP in response to abrupt changes in irradiance or temperature. This transient behavior involves a balance between rapidity and stability (oscillations). The P&O technique exhibits significant variations around the MPP. This limitation is particularly evident in scenarios that require a stable energy output, as these oscillations impact overall efficiency. In comparison, the INC method offers a more accurate tracking approach, which reduces these fluctuations. Additionally, the INC method demonstrates a faster tracking speed for achieving MPPT than the P&O method. Table 6 Shows comparison between photovoltaic array output power in the absence of MPPT and with using MPPT including the two algorithms of MPPT.
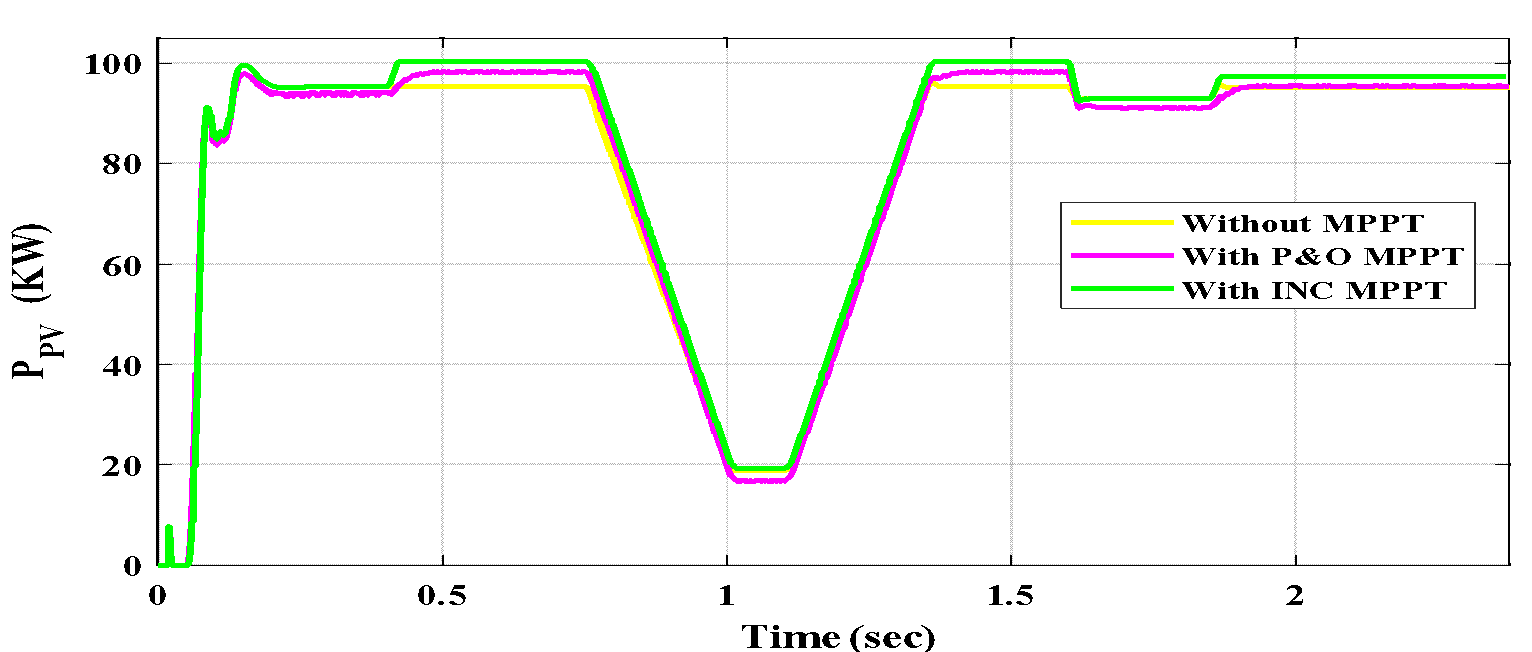
Figure 26. Comparison of the PV array's output power without MPPT, with the P&O and with the INC technique
Table 6. Various comparison between PV array output power
Case. No | G (W/m²) |
T ( ͦ C)
| PV Array Output Power (KW) | Percentage Improvement (%) | PV Array Output Power (KW) | Percentage Improvement (%) |
Without MPPT | P&O Algorithm | INC Algorithm |
1 | 1000 | 25 | 95.37 | 98.25 | 3.02 | 100.37 | 5.24 |
2 | 600 | 25 | 58.40 | 60.51 | 3.61 | 62.94 | 7.77 |
3 | 500 | 25 | 48.86 | 50.11 | 2.56 | 52.53 | 7.51 |
4 | 200 | 25 | 18.83 | 18.99 | 0.85 | 19.22 | 2.07 |
5 | 1000 | 50 | 92.89 | 91.53 | -1.46 | 92.9 | 0.01 |
6 | 1000 | 35 | 95.14 | 95.44 | 0.32 | 97.42 | 2.40 |
The data presented in the Table 6 indicates that the maximum PV output power is achieved using the INC algorithm for MPPT across various weather conditions, in comparison to other case studies. The output power produced by the PV array () reaches 100.37 kW when employing the INC algorithm, while it attains 98.25 kW with the P&O algorithm and 95.37 kW without any MPPT under STC. The output power without MPPT is 95.37 kW, which is below the rated power under STC. In the absence of MPPT, the voltage of the solar panel is reduced, leading to a decrease in overall power output. MPPT operates as a DC-DC converter, optimizing voltage and current, which is critical for achieving maximum efficient output. Under conditions of rapidly changing temperatures, the P&O algorithm may incorrectly adjust the voltage in an unintended direction, leading to a divergence from MPP as shown in Case 5 (1000 W/m², 50°C) which where it underperforms compared to no MPPT.
The data shown in Table 7 demonstrates a comparison of the efficiency of MPPT techniques under different weather conditions relative to other case studies. The system achieves an efficiency of 99.72% when utilizing the INC algorithm, 97.62% with the P&O algorithm, and 94.75% without any MPPT under STC. The practical implications of the results for real-world PV system design may involve a comparative analysis of PV technologies, which is essential for aligning with local environmental conditions to ensure improved system efficiency and long-term performance. The proposed system's evaluation utilizing P&O and INC techniques is compared with other related research presented in references [71][72] and [73] as shown in Table 8. It illustrates that the proposed system demonstrates favorable results in comparison to other related works.
Table 7. Various comparison between the efficiency of MPPT techniques
Case. No | G (W/m²) | T ( ͦ C) | Efficiency (%) |
Without MPPT | P&O Algorithm | INC Algorithm |
1 | 1000 | 25 | 94.75 | 97.62 | 99.72 |
2 | 600 | 25 | 58.02 | 60.12 | 62.53 |
3 | 500 | 25 | 48.54 | 49.79 | 52.19 |
4 | 200 | 25 | 18.71 | 18.87 | 19.10 |
5 | 1000 | 50 | 92.29 | 90.94 | 92.30 |
6 | 1000 | 35 | 94.53 | 94.82 | 96.79 |
Table 8. An evaluation of a proposed system in comparison with related research
Parameters | [71] | [72] | [73] | Proposed System |
P&O | INC |
System Rating | 250 KW | 10 KW | 100 KW | 100 KW | 100 KW |
MPPT | INC | P&O | CS | P&O | INC |
DC-DC Converter | NA | DC-DC Boost Converter | DC-DC Boost Converter | DC-DC Boost Converter | DC-DC Boost Converter |
Efficiency of MPPT | 95 % | 93% | 96 % | 97.62 % | 99.72 % |
THD | 2.48 % | 4.89 % | 2.06 % | 2.1 % | 1.94 % |
- CONCLUSION
The simulation results of photovoltaic system integrated into the electrical grid employing the P&O and INC techniques for MPPT were conducted using the Matlab/Simulink environment. The PV array's performance connected to the grid was evaluated under various conditions utilizing the MPPT methods, with a specific focus on different irradiance and temperature levels to optimize MPPT. The analysis leads to the subsequent conclusions:
- The generated output voltage of the photovoltaic system is significantly affected by temperature variations, while changes in irradiance have a minor effect.
- The output current generated by the photovoltaic system exhibits a linear decrease and increase in response to variations in irradiance, with minimal changes observed due to temperature fluctuations.
- The power output produced by the photovoltaic system is influenced by changes in both the output voltage and current of the photovoltaic system.
- The output power generated from photovoltaic systems utilizing the P&O-MPPT technique effectively tracks its maximum output value when compared to scenarios without MPPT implementation.
- The output power generated from photovoltaic systems employing the INC-MPPT algorithm also demonstrates effective tracking of its maximum output value in comparison to scenarios utilizing the P&O MPPT implementation or operating without MPPT. The INC outperforms P&O during weather conditions changes or steady-state operation.
- The INC algorithm is demonstrated to enhance the PV output power at STC by 5.24% without the implementation of MPPT, while the P&O algorithm results in an improvement of 3.24%.
- The INC technique exhibits superior performance, achieving an efficiency of approximately 99.72%, in contrast to the P&O method, which attains nearly 97.62% efficiency at STC.
- The THD measured in the system employing the INC technique is recorded at 1.94%. In contrast, the THD recorded with the P&O technique is noted at 2.1%. Both values are significantly below the specified limit of 5%, with the THD in the INC technique being lower than that observed in the P&O technique.
The study has limitations, including the reliance on ideal simulation conditions, the exclusion of partial shading scenarios, and the presence of unbalanced grid voltage. For future research, it is crucial to integrate MPPT with alternative control strategies and to conduct a comparison with modern optimization-based MPPT approaches, including deep learning. Furthermore, examining the system's performance under conditions of partial shading and unbalanced grid voltage is vital to demonstrate its applicability in industrial contexts.
REFERENCES
- A. Ghilani, A. Terki, A. M. Ghodbane, Z. Alili, and O. Belaroussi, "Optimal Conversion Topologies for Grid-Connected PV Systems: A Comparative Study of Single-Stage and Two-Stage Configurations," ITEGAM-JETIA, vol. 12, pp. 408-415, 2026, https://doi.org/10.5935/jetia.v12i57.3027.
- W. Jahnavi and C. S. JN, "A comprehensive review on application of ai algorithms for GRID connected Solar Photovoltaic Systems," ITEGAM-JETIA, vol. 10, pp. 87-95, 2024, https://doi.org/10.5935/jetia.v10i49.1248.
- A. A. Z. Diab, I. Y. Fawzy, A. M. Elsawy, M. A. Tolba, and A. G. A. El–Magd, "Enhancing Voltage Stability in PV/Wind Power Systems with STATCOM Utilizing Fuzzy Controller," in 2025 7th International Youth Conference on Radio Electronics, Electrical and Power Engineering (REEPE), pp. 1-8, 2025, https://doi.org/10.1109/REEPE63962.2025.10971104.
- M. Aslan, B. Afif, M. Salmi, B. Merabet, M. Berka, and S. Masoud, "Performance enhancement of microgrid systems using backstepping control for grid side converter and MPPT optimization," Solar Energy and Sustainable Development Journal, vol. 14, pp. 19-41, 2025, https://doi.org/10.51646/jsesd.v14i1.367.
- A. Kaab, H. Ghasemi-Mobtaker, and M. Sharifi, "Photovoltaic integration for sustainable electricity in the agro-industrial sector: A techno-economic analysis," Energy Conversion and Management: X, p. 101773, 2026, https://doi.org/10.1016/j.ecmx.2026.101773.
- M. Laimon and T. Yusaf, "Towards energy freedom: Exploring sustainable solutions for energy independence and self-sufficiency using integrated renewable energy-driven hydrogen system," Renewable Energy, vol. 222, p. 119948, 2024, https://doi.org/10.1016/j.renene.2024.119948.
- H. Ghasemi-Mobtaker, F. S. Ataiee, A. Akram, and A. Kaab, "Feasibility study of using photovoltaic cells for a commercial hydroponic greenhouse: Energy analysis and life cycle assessment," E-Prime-Advances in Electrical Engineering, Electronics and Energy, vol. 8, p. 100597, 2024, https://doi.org/10.3390/engproc2025112025.
- Z. Mohammed, T. Kaoutar, E. O. Abdelghani, and T. Belkacem, "Enhancing Grid-Connected Photovoltaic Power System Performance Using Fuzzy P&O Approach," Engineering Proceedings, vol. 112, p. 25, 2025, https://doi.org/10.3390/engproc2025112025.
- M. S. Endiz, G. Gökkuş, A. E. Coşgun, and H. Demir, "A review of traditional and advanced MPPT approaches for PV systems under uniformly insolation and partially shaded conditions," Applied Sciences, vol. 15, p. 1031, 2025, https://doi.org/10.3390/app15031031.
- M. H. Ali, M. Zakaria, and S. El-Tawab, "A comprehensive study of recent maximum power point tracking techniques for photovoltaic systems," Scientific Reports, vol. 15, p. 14269, 2025, https://doi.org/10.1038/s41598-025-96247-5.
- G. N. Al Shabaan and I. S. Altarawneh, "Decoding Climatic Drivers of Solar Photovoltaic Output in Arid Climates: Integrating Sensitivity, Lag Dynamics, and Principal Component Analysis for Forecasting Accuracy," Sustainable Energy Technologies and Assessments, vol. 86, p. 104851, 2026, https://doi.org/10.1016/j.seta.2026.104851.
- L. Yang and X. Fu, "A Review of Photovoltaic Uncertainty Modeling Based on Statistical Relational AI," Energies, vol. 19, p. 1509, 2026, https://doi.org/10.3390/en19061509.
- A. A. AlZubaidi, L. A. Khaliq, H. S. Hamad, W. K. Al-Azzawi, M. S. Jabbar, and T. A. Shihab, "MPPT implementation and simulation using developed P&O algorithm for photovoltaic system concerning efficiency," Bulletin of Electrical Engineering and Informatics, vol. 11, pp. 2460-2470, 2022, https://doi.org/10.11591/eei.v11i5.3949.
- M. W. Lotfy and A. I. Hussein, "Power extraction in photovoltaic systems using P&O-based MPPT with DC-DC buck converter integration," WSEAS Transactions on Electronics, vol. 16, pp. 51-59, 2025, https://doi.org/10.37394/232017.2025.16.6.
- M. A. B. Siddique, D. Zhao, K. Ouahada, A. U. Rehman, and H. Hamam, "Performance validation of global MPPT for efficient power extraction through PV system under complex partial shading effects," Scientific reports, vol. 15, p. 17061, 2025, https://doi.org/10.1038/s41598-025-01816-3.
- N. A. Ahmed, S. Abdul Rahman, and B. N. Alajmi, “Optimal controller tuning for P&O maximum power point tracking of PV systems using genetic and cuckoo search algorithms,” International Transactions on Electrical Energy Systems, vol. 31, no. 10, p. e12624, 2021, https://doi.org/10.1002/2050-7038.12624.
- H. Shahid, M. Kamran, Z. Mehmood, M. Y. Saleem, M. Mudassar, and K. Haider, "Implementation of the novel temperature controller and incremental conductance MPPT algorithm for indoor photovoltaic system," Solar Energy, vol. 163, pp. 235-242, 2018, https://doi.org/10.1016/j.solener.2018.02.018.
- A. Lemmassi, A. Derouich, A. Hanafi, A. Byou, M. Benmessaoud, and N. El Ouanjli, "Low-cost MPPT for triple-junction solar cells used in nanosatellites: A comparative study between P&O and INC algorithms," e-Prime-Advances in Electrical Engineering, Electronics and Energy, vol. 7, p. 100426, 2024, https://doi.org/10.1016/j.prime.2024.100426.
- M. Ahmad, A. Numan, and D. Mahmood, "A comparative study of perturb and observe (P&O) and incremental conductance (INC) PV MPPT techniques at different radiation and temperature conditions," Engineering and Technology Journal, vol. 40, pp. 376-385, 2022, https://doi.org/10.30684/etj.v40i2.2189.
- A. Rashid, "A Comprehensive Study on the Effectiveness of Perturb and Observe and Incremental Conductance MPPT Algorithms for Photovoltaic Systems in Dynamic Environments," in 2025 International Conference on Green Energy, Computing and Sustainable Technology (GECOST), pp. 1-5, 2025, https://doi.org/10.1109/GECOST66002.2025.11324634.
- N. B. Malla and V. Parajuli, "Comparison of Incremental Conductance and Perturb and Observe Techniques of Maximum Power Point Tracking for PV Systems," International Journal of Research In Science & Engineering (IJRISE), 2023, https://doi.org/10.55529/ijrise.41.13.21.
- B. Shuriya, S. Sivaraju, T. Anuradha, S. Srithar, and J. Chitra, "Renewable Energy Solutions for Virtual Environments," in Green Metaverse: Fuzzy Logic Approaches to Sustainable Virtual Worlds, pp. 135-152, 2026, https://doi.org/10.1007/978-3-032-08183-4_8.
- I. Y. Fawzy, Y. Mohamad, E. Shehata, and M. Abd El Sattar, "A modified perturb and observe technique for MPPt of intgrated PV system using DC-DC boost converter," Journal of Advanced Engineering Trends, vol. 40, pp. 63-77, 2021, https://doi.org/10.21608/jaet.2021.82231.
- A. Belaid, M. Guermoui, R. Khelifi, T. Arrif, T. Chekifi, A. Rabehi, et al., "Assessing suitable areas for PV power installation in remote agricultural regions," Energies, vol. 17, p. 5792, 2024, https://doi.org/10.3390/en17225792.
- X. Zhong et al., "The Water Lifting Performance of a Photovoltaic Sprinkler Irrigation System Regulated by Solar-Coupled Compressed-Air Energy Storage," Agriculture, vol. 16, p. 154, 2026, https://doi.org/10.3390/agriculture16020154.
- A. A. Aboukra and K. A. H. Lekhmaisi, "A Comparative Study Between Conventional Power Generation Plants and Renewable Energy Generation Technologies Using Solar (PV) Panels and Wind Energy in Libya," Libyan Open University Journal of Applied Sciences (LOUJAS), pp. 71-79, 2026, https://doi.org/10.65422/loujas.v2i1.171.
- T. M. Abed, S. S. Eskander, M. A. Elsayes, and M. Zaki, "Design and Economic Assessment of a Sustainable Standalone Photovoltaic System for Hospital Lift Applications," Mansoura Engineering Journal, vol. 51, p. 11, 2026, https://doi.org/10.58491/2735-4202.3404.
- R. K. Kumar and P. Samuel, "Efficient solar hydrogen generation using PEM electrolysis in a grid-connected system," International Journal of Hydrogen Energy, vol. 197, p. 152584, 2026, https://doi.org/10.1016/j.ijhydene.2025.152584.
- J. A. Pinto et al., "A comparative analysis of thermosolar and photovoltaic systems for meeting residential hot water demands," Renewable Energy, vol. 244, p. 122652, 2025, https://doi.org/10.1016/j.renene.2025.122652.
- J. F. Ardashir, M. Hasannezhad, H. V. Ghadim, and M. Sarhangzadeh, "Integration of energy storage systems with multilevel inverters for microgrids," in Distributed Energy Storage Systems for Digital Power Systems, pp. 293-318, 2025, https://doi.org/10.1016/B978-0-443-22013-5.00012-5.
- S. Afonaa-Mensah, I. B. Majeed, and F. Odoi-Yorke, "Advancing the Adoption of Net Metering: An Economic Assessment of Grid‐Tied Solar Photovoltaic Systems in Urban Homes in Ghana," International Journal of Energy Research, vol. 2024, p. 9919076, 2024, https://doi.org/10.1155/2024/9919076.
- F. Yang, K. Pan, C. Yan, X. Ji, and W. Xu, "Systematic Security Analysis of Sensors and Controls in PV Inverters: Threat Validation and Countermeasures," Sensors, vol. 25, p. 1493, 2025, https://doi.org/10.3390/s25051493.
- H. Al Mahdi, P. G. Leahy, M. Alghoul, and A. P. Morrison, "A review of photovoltaic module failure and degradation mechanisms: Causes and detection techniques," in Solar, pp. 43-82, 2024, https://doi.org/10.3390/solar4010003.
- P. B. Joshi and B. Bagde, "Comparative analysis between the Reference voltage P&O and the Reference voltage IC Method for MPPT," in 2026 International Conference on Electric Power and Renewable Energy (EPREC), pp. 1-5, 2026, https://doi.org/10.1109/EPREC66546.2026.11412329.
- M. B. S. Bechekir¹, M. Brahami¹, H. Bendaho, and A. Brahimi, "Comparative Analysis of MPPT Algorithms: P&O and Inc for Optimizing PV Systems," Smart Computing and Control Renewable Energy Systems: Advanced Computational Techniques for Wireless Network Optimization, vol. 1238, p. 60, 2025, https://doi.org/10.1007/978-3-031-80301-7_8.
- S. Bharti, R. Kumar, Monika, and U. Sinha, "Analysis and Comparison of the P&O and INC MPPT Techniques for Solar Energy Systems When Compared to Various Atmospheric Temperatures," in International Conference on Electric Power and Renewable Energy, pp. 311-325, 2023, https://doi.org/10.1007/978-981-99-9054-2_23.
- D. Routray, P. K. Rout, and B. K. Sahu, "A brief review and comparative analysis of two classical MPPT techniques," in 2021 International Conference in Advances in Power, Signal, and Information Technology (APSIT), pp. 1-6, 2021, https://doi.org/10.1109/APSIT52773.2021.9641301.
- L. Assiya, D. Aziz, and H. Ahmed, "Comparative study of P&O and INC MPPT algorithms for DC-DC Converter Based PV System on MATLAB/SIMULINK," in 2020 IEEE 2nd International Conference on Electronics, Control, Optimization and Computer Science (ICECOCS), pp. 1-5, 2020, https://doi.org/10.1109/ICECOCS50124.2020.9314498.
- M. Shafiullah, S. D. Ahmed, and F. A. Al-Sulaiman, "Grid integration challenges and solution strategies for solar PV systems: A review," IEEE access, vol. 10, pp. 52233-52257, 2022, https://doi.org/10.1109/ACCESS.2022.3174555.
- M. Killi and S. Samanta, "Modified perturb and observe MPPT algorithm for drift avoidance in photovoltaic systems," IEEE transactions on Industrial Electronics, vol. 62, pp. 5549-5559, 2015, https://doi.org/10.1109/TIE.2015.2407854.
- M. Bošnjaković, R. Santa, Z. Crnac, and T. Bošnjaković, "Environmental impact of PV power systems," Sustainability, vol. 15, p. 11888, 2023, https://doi.org/10.3390/su151511888.
- J. Zhao, Z. Xu, M.-K. Law, H. Heidari, S. O. Abdellatif, M. A. Imran, et al., "Simulation of crystalline silicon photovoltaic cells for wearable applications," IEEE Access, vol. 9, pp. 20868-20877, 2021, https://doi.org/10.1109/ACCESS.2021.3050431.
- M. Dada and P. Popoola, "Recent advances in solar photovoltaic materials and systems for energy storage applications: a review," Beni-Suef University Journal of Basic and Applied Sciences, vol. 12, p. 66, 2023, https://doi.org/10.1186/s43088-023-00405-5.
- A. Elsafi, A. A. Almohammedi, M. Balfaqih, Z. Balfagih, and S. Sabri, "Comparative analysis of maximum power point tracking methods for power optimization in grid tied photovoltaic solar systems," Discover Applied Sciences, vol. 7, p. 976, 2025, https://doi.org/10.1007/s42452-025-07606-w.
- A. S. Al-Ezzi and M. N. M. Ansari, "Photovoltaic solar cells: a review," Applied System Innovation, vol. 5, p. 67, 2022, https://doi.org/10.3390/asi5040067.
- A. K. Abdulrazzaq, G. Bognár, and B. Plesz, "Enhanced single-diode model parameter extraction method for photovoltaic cells and modules based on integrating genetic algorithm, particle swarm optimization, and comparative objective functions," Journal of Computational Electronics, vol. 24, p. 44, 2025, https://doi.org/10.1007/s10825-025-02282-w.
- U. Younas, B. Akdemir, and A. A. Kulaksiz, "Modeling and simulation of a grid-connected PV system under varying environmental conditions," International Journal of Energy Applications and Technologies, vol. 6, pp. 17-23, 2019, https://doi.org/10.31593/ijeat.526377.
- S. M. Belhadj, B. Meliani, H. Benbouhenni, I. Colak, Z. Elbarbary, and S. F. Al-Gahtani, "Control of three-level quadratic DC-DC boost converters for energy systems using various technique-based MPPT methods," Scientific Reports, vol. 15, p. 14631, 2025, https://doi.org/10.1038/s41598-025-99551-2.
- S. Muthubalaji, G. Devadasu, S. Srinivasan, and N. Soundiraraj, "Development and validation of enhanced fuzzy logic controller and boost converter topologies for a single phase grid system," Electrical Engineering & Electromechanics, pp. 60-66, 2022, https://doi.org/10.20998/2074-272X.2022.5.10.
- D. Lakshmi, S. Sathishkumar, R. Sreedhar, G. Vasumathi, M. M. Irfan, and M. Balasubramanian, "Enhanced solar PV system with battery storage and grid integration using cascaded ANFIS-based MPPT and self-lift Luo converter," in 2025 3rd International Conference on Device Intelligence, Computing and Communication Technologies (DICCT), pp. 361-366, 2025, https://doi.org/10.1109/DICCT64131.2025.10986645.
- A. S. Jaber, M. Ismael, T. Rashid, M. A. Sarhan, M. Rasheed, and I. M. Sala, "Comparesion the electrical parameters of photovoltaic cell using numerical methods," Eureka: Physics and Engineering, pp. 29-39, 2023, https://doi.org/10.21303/2461-4262.2023.002770.
- N. M. Kumar, M. P. Subathra, and J. E. Moses, "On-Grid Solar Photovoltaic System: Components, Design Considerations, and Case Study," in 2018 4th International Conference on Electrical Energy Systems (ICEES), pp. 616-619, 2018, https://doi.org/10.1109/ICEES.2018.8442403.
- A. A. El Halim and E. H. Bayoumi, "Using a New Combination of P&O and ICM Methods for the Experimental Validation of MPPT Efficacy," Journal Européen des Systèmes Automatisés, vol. 54, 2021, https://doi.org/10.18280/jesa.540601.
- A. Cordeiro et al., “Automated solar PV simulation system supported by DC–DC power converters,” Designs, voll 7, no. 2, p. 36, 2023, https://doi.org/10.3390/designs7020036.
- B. Adel, M. Tarek, and K. Samia, "Evaluation of pulse width modulation techniques to reduce total harmonic distortion in grid-connected PV systems," International Journal of Power Electronics and Drive Systems(IJPEDS), vol. 16, p. 564, 2025, https://doi.org/10.11591/ijpeds.v16.i1.pp564-574.
- M. S. Endiz, "Comparative analysis of P&O and IC MPPT techniques under different atmospheric conditions," El-Cezeri, vol. 10, pp. 27-35, 2023, https://doi.org/10.31202/ecjse.1101526.
- S. Kart, "Power Ripple Reduction in Cascade Boost Converters Using PI-Based MPPT Control for Solar Cells," Tehnički vjesnik, vol. 33, pp. 451-457, 2026, https://doi.org/10.17559/TV-20241121002148.
- S. Xu, Y. Gao, G. Zhou, and G. Mao, "A global maximum power point tracking algorithm for photovoltaic systems under partially shaded conditions using modified maximum power trapezium method," IEEE Transactions on industrial electronics, vol. 68, pp. 370-380, 2020, https://doi.org/10.1109/TIE.2020.2965498.
- A. Sadick, "Maximum power point tracking simulation for photovoltaic systems using perturb and observe algorithm," in Solar Radiation-Enabling Technologies, Recent Innovations, and Advancements for Energy Transition, 2023, https://doi.org/10.5772/intechopen.111632.
- M. Algarbalje and A. Gün, "A Novel Framework for Power Extraction Enhancement in PV Systems Based on Hybrid ACO-ANN Optimization," Electronics, vol. 15, p. 649, 2026, https://doi.org/10.3390/electronics15030649.
- F. A. Pamuji et al., “Design and Implementation of Boost Converter for Maximum Power Point Tracking Based on Fuzzy Logic Controller in Photovoltaic System,” In 2025 International Seminar on Intelligent Technology and Its Applications (ISITIA), pp. 708-713, 2025, https://doi.org/10.1109/ISITIA66279.2025.11137530.
- N. Dasgupta, A. Pandey, and A. K. Mukerjee, "Voltage-sensing-based photovoltaic MPPT with improved tracking and drift avoidance capabilities," Solar Energy Materials and Solar Cells, vol. 92, pp. 1552-1558, 2008/12/01/ 2008, https://doi.org/10.1016/j.solmat.2008.06.020.
- M. L. Katche, A. B. Makokha, S. O. Zachary, and M. S. Adaramola, “A comprehensive review of maximum power point tracking (mppt) techniques used in solar pv systems,” Energies, vol. 16, no. 5, p. 2206, 2023, https://doi.org/10.3390/en16052206.
- M. Değermenci, Y. Yalman, and K. Olcay, "MPPT algorithms for grid-connected solar systems including deep learning approaches," Scientific Reports, 2026, https://doi.org/10.1038/s41598-026-36321-8.
- A. Pallavee Bhatnagar and B. Nema, "Conventional and global maximum power point tracking techniques in photovoltaic applications: A review," Journal of Renewable and Sustainable Energy, vol. 5, p. 032701, 2013, https://doi.org/10.1063/1.4803524.
- M. Bouksaim, M. Mekhfioui, and M. N. Srifi, "A Comprehensive Decade-Long Review of Advanced MPPT Algorithms for Enhanced Photovoltaic Efficiency," in Solar, p. 44, 2025, https://doi.org/10.3390/solar5030044.
- S. Y. Prasad, B. B. Chhetri, B. Adhikary, and D. Bista, "Microcontroller based intelligent DC/DC converter to track Maximum Power Point for solar photovoltaic module," in 2010 IEEE Conference on Innovative Technologies for an Efficient and Reliable Electricity Supply, pp. 94-101, 2010, https://doi.org/10.1109/CITRES.2010.5619859.
- F. Tahiri, A. Harrouz, G. E. Bostanci, M. A. Hartani, A. Badoud, S. Zemitte, et al., "Comparative analysis of the MPPT methods employed in the PV system, involving incremental conductance control and sliding mode control," in 2023 Second International Conference on Energy Transition and Security (ICETS), pp. 1-5, 2023, https://doi.org/10.1109/ICETS60996.2023.10410778.
- L. Guanghua, A. M. Soomar, S. H. H. Shah, S. Shaikh, and P. Musznicki, "Maximum power point tracking strategies for solar PV systems: A review of current methods and future innovations," Results in Engineering, vol. 28, p. 107227, 2025, https://doi.org/10.1016/j.rineng.2025.107227.
- K. Bouguerra, S. Latreche, M. Khemliche, and H. Khemliche, "PV system MPPT control: a comparative analysis of P&O, IncCond, SMC and FLC algorithms," Informatyka, Automatyka, Pomiary W Gospodarce I Ochronie Środowiska, vol. 14, pp. 52-62, 2024, https://doi.org/10.35784/iapgos.6152.
- A. Boubakir, S.-A. Touil, S. Labiod, and N. Boudjerda, "A robust model-free controller for a three-phase grid-connected photovoltaic system based on ultra-local model," Protection and Control of Modern Power Systems, vol. 6, p. 43, 2021, https://doi.org/10.1186/s41601-021-00218-7.
- D. C. Martins, "Analysis of a Three‐Phase Grid‐Connected PV Power System Using a Modified Dual‐Stage Inverter," International Scholarly Research Notices, vol. 2013, p. 406312, 2013, https://doi.org/10.1155/2013/406312.
- M. H. Mohamed Hariri, M. Salem, M. K. Mohd Jamil, M. N. Abdullah, and M. K. Mat Desa, "Modeling and analysis of 100 kW two-stage three-phase grid-connected PV generation system under absurd atmospheric and grid disturbances," Plos one, vol. 20, p. e0323269, 2025, https://doi.org/10.1371/journal.pone.0323269.
Haitham Ibrahim Elbahat (Utilizing Two Maximum Power Point Tracking Techniques with an Integrated DC-DC Boost Converter for Controlling a Grid-Connected Photovoltaic System)