ISSN: 2685-9572 Buletin Ilmiah Sarjana Teknik Elektro
Vol. 8, No. 5, October 2026, pp. 1447-1458
Performance Evaluation of ResNet50 and VGG16 in Automated Multi-Stage Breast Cancer Histopathology Grading
Agoes Santika Hyperastuty 1,2, Anik Nur Handayani 1, Heru Wahyu Herwanto 1, Nor Salwa Damanhuri 3,4
1 Department of Electrical Engineering and Informatics, Universitas Negeri Malang, Malang, Indonesia
2 Electromedical Technology Study Program, Kadiri University, Kediri, East Java, Indonesia
3 Electrical Engineering Studies, Universiti Teknologi MARA (UiTM), Cawangan Pulau Pinang, Malaysia
4 Electronic System Engineering, Vocational Studies, Universitas Negeri Malang, Malang, Indonesia
ARTICLE INFORMATION |
| ABSTRACT |
Article History: Received 10 January 2026 Revised 17 April 2026 Accepted 02 October 2026 |
| 
Breast cancer histopathological grading is important for estimating tumor aggressiveness and supporting treatment planning, yet manual assessment can be influenced by observer variability. This study comparatively evaluates two convolutional neural network architectures, ResNet50 and VGG16, for automated multi-stage breast cancer histopathology grading based on the Nottingham histologic grading categories: Grade I, Grade II, and Grade III. The task was formulated as image-level classification using 1,742 hematoxylin and eosin-stained histopathological images obtained from 150 patients at an Anatomical Pathology Laboratory. All images were resized to 224 × 224 pixels, converted into normalized numerical RGB values, and augmented using horizontal and vertical flipping. The dataset was divided into training, validation, and testing subsets while considering patient-level separation to reduce data leakage. VGG16 was trained using stochastic gradient descent with a learning rate of 0.001, a batch size of 32 for training and 64 for testing, and 60 epochs. ResNet50 was trained using stochastic gradient descent and CrossEntropyLoss for 200 epochs, with raw logits in the final layer because CrossEntropyLoss internally applies softmax. Experimental results showed that ResNet50 achieved higher training accuracy (0.9735), higher validation accuracy (0.6792), lower training and validation loss (0.0809), and slightly higher recall (0.7095) than VGG16. Both models obtained the same test accuracy of 0.7590. These findings indicate that ResNet50 demonstrated stronger learning behavior and slightly better sensitivity, although external validation and class-wise analysis remain necessary before clinical application. The study also provides a controlled baseline for future CNN-based decision-support research in digital breast pathology settings and practice. |
Keywords: Breast Cancer; Histopathology; Nottingham Histologic Grading; Resnet50; VGG16; Convolutional Neural Network (CNN) |
Corresponding Authors: Anik Nur Handayani, Department of Electrical Engineering and Informatics, Faculty of Engineering, State University of Malang, Malang, East Java, Indonesia. Email: anik.nur.ft@um.ac.id |
This work is open access below Creative Commons Attribution-Share Alike 4.0 
|
Document Citation: Agoes Santika Hyperastuty 1,2, Anik Nur Handayani 1, Heru Wahyu Herwanto 1, Nor Salwa Damanhuri, " Performance Evaluation of ResNet50 and VGG16 in Automated Multi-Stage Breast Cancer Histopathology Grading," Buletin Ilmiah Sarjana Teknik Elektro, vol. 8, no. 5, pp. 1447-1458, 2026, DOI: 10.12928/biste.v8i5.15824. |
INTRODUCTION
Breast cancer remains one of the leading causes of cancer-related mortality among women worldwide. The GLOBOCAN 2020 estimates reported more than 2.3 million new breast cancer cases and approximately 685,000 deaths globally in 2020 [1]. Although screening and targeted therapies have improved outcomes, definitive diagnosis and prognostic assessment still depend on routine histopathological evaluation of hematoxylin and eosin (H&E) stained tissue sections [2][3]. Conventional microscopy-based assessment, however, is inherently dependent on expert interpretation and may exhibit inter-observer variability, especially when decisions hinge on subtle morphologic patterns [4][5].
Histopathology is not only central for identifying tumor type but also for determining the degree of malignancy (histologic grade), which informs therapy planning and prognosis. The Nottingham grading system (Elston-Ellis modification of Bloom-Richardson) evaluates three morphologic parameters: tubule formation, nuclear pleomorphism, and mitotic activity; each is scored from 1 to 3 and summed to assign Grade 1 (well differentiated), Grade 2 (moderately differentiated), or Grade 3 (poorly differentiated) [6][7]. Histologic grade is a well-established prognostic factor and contributes to risk stratification in contemporary breast cancer management [7][8]. Nevertheless, reproducibility challenges persist, with only moderate agreement reported in multi-institution settings, and borderline cases (e.g., Grade 1 vs Grade 2) are particularly prone to disagreement [4][5]. These limitations motivate computational approaches that can improve objectivity and consistency while preserving clinically meaningful grading granularity.
Deep learning has substantially advanced histopathological image analysis, largely through convolutional neural networks (CNNs) [1] that learn discriminative morphologic representations from pixel data [10][11]. Common CNN backbones such as ResNet and VGG have become standard feature extractors and have been widely adopted in computational pathology pipelines [12][13]. Prior studies demonstrate that deep learning can capture prognostically relevant information from H&E images, including histologic grade, but approaches vary across datasets, labeling strategies, and training protocols [14]-[17]. Recent work has explored both conventional CNNs and newer foundation-model based strategies for predicting Nottingham grade from digital pathology images [15][16]. Moreover, much of the applied literature has emphasized detection, segmentation, or coarse diagnostic categorization, whereas fine-grained Nottingham grading remains challenging due to inter-grade overlap and subtle morphologic transitions [15]-[17]. This heterogeneity makes it difficult to isolate how backbone architecture choice alone affects tri-class Nottingham grading performance under comparable experimental conditions.
Accordingly, this study addresses the above gap by performing a systematic, controlled head-to-head comparison of ResNet50 and VGG16 for tri-class Nottingham grading from H&E imagery. The novelty is threefold. First, we focus on an architecture-isolated benchmark under harmonized training and evaluation settings to quantify backbone sensitivity (e.g., consistent splits, augmentation, optimization, and reporting). Second, we provide a grading-centered analysis that targets clinically difficult adjacent-grade boundaries, complemented by agreement-oriented metrics (e.g., Cohen’s kappa) [53] and interpretability (e.g., Grad-CAM) [55] to reveal model decision cues and recurrent failure modes. Third, we position the resulting evidence as a practical baseline for future extensions toward patch aggregation and whole-slide paradigms (e.g., multiple instance learning) that are increasingly used to reduce annotation burden and leverage high-resolution pathology data [18]-[21].
LITERATURE REVIEW
The development of deep learning for medical image analysis—particularly for breast cancer histopathology—has progressed rapidly over the last decade [2]-[5]. For example, Akshat Desai et al. conducted a comparative study of ResNet18/34/50 and reported that ResNet50 achieved the strongest performance (92.42% accuracy) in their experimental setting, highlighting the advantage of deeper residual backbones for discriminative morphological representation learning [22]. In a more recent histopathology pipeline, Faisal Bin Ashraf et al. reported high accuracy across multiple magnifications on breast cancer histopathology images (including ~98% at 200×), supporting the practical effectiveness of ResNet50-based transfer learning in microscopy data [23]. Beyond classification, segmentation-driven pipelines have also been explored. Nella Rosa Sudianjaya proposed a U-Net framework combined with transfer learning (ResNet50 backbone), reporting a Dice coefficient of 0.916 and an average IoU of 0.482, indicating promising segmentation quality for breast histopathology structures [24]. For grading-oriented modeling, Suzanne C. Wetstein et al. developed a multi-task deep learning approach and achieved Cohen’s kappa of 0.59 (80% accuracy) to distinguish low/intermediate versus high tumor grade on whole-slide images, underlining both the feasibility and remaining difficulty of robust grading automation [25].
Importantly, recent computational pathology work also aims to connect morphology with downstream biological/molecular signals; Ronnachai Jaroensri et al. demonstrated that deep learning can infer biomarker status while identifying associated morphological correlates from H&E, reinforcing the potential of representation learning beyond simple benign–malignant discrimination [26]. Complementing this, Robert B. Eshun et al. addressed class-imbalance in breast cancer image classification and showed that pre-trained CNNs (including ResNet-family backbones) can remain highly effective under appropriate data handling strategies [27]. From a clinical perspective, Nottingham Histologic Grade (NHG) 2 is widely recognized as a particularly heterogeneous group; Y. Wang et al. proposed a stratification model (DeepGrade) showing prognostic relevance specifically within NHG2, offering clinically meaningful information beyond routine grading while potentially reducing dependence on costly molecular profiling [28]. In the context of backbone selection and transfer learning, Md Ishtyaq Mahmud et al. compared multiple pretrained deep transfer learning models (ResNet50/ResNet101/VGG16/VGG19), providing evidence that backbone choice can materially affect performance even under the same dataset and task constraints [29]. Finally, classical baselines remain important for interpretability; Ronal Watrianthos et al. evaluated threshold optimization (Youden Index) and probability calibration (ECE) for logistic regression on the Wisconsin Diagnostic Breast Cancer dataset, achieving strong discrimination and calibrated outputs useful as a transparent comparator to deep models [30].
In the Indonesian research landscape, Universitas Negeri Malang (UM) has also contributed to breast-cancer imaging analytics and data-scarcity mitigation. UM researchers reported diffusion-model based synthetic mammogram generation to augment training data and improve downstream deep-learning robustness [31] and further summarized the state of the art in a systematic review covering segmentation and classification pipelines for mammogram-based breast-cancer detection [32]. More recently, they demonstrated that leveraging synthetic mammograms can enhance classification performance using modern backbones such as EfficientNetV2L under controlled evaluation settings [33]. Earlier UM-published work explored wavelet-based mammogram enhancement to improve lesion visibility for computer-aided analysis [34], while UM journal publications also discuss optimization practices (e.g., Adam) that are widely adopted in deep-network training to stabilize convergence [35]. These contributions reinforce the importance of systematically isolating backbone effects under harmonized training protocols, as undertaken in this study for tri-class Nottingham grading (Table 1).
Table 1. Previous research on breast cancer assessment with RESNET
References | Model CNN |
[6] | Comparison of ResNet-18, ResNet-34, and ResNet-50) |
[7] | ResNet+Inception |
[8] | integrating U Net with Transfer Learning ResNet50 |
[9] | Resnet 34 multi task learning |
[10] | Resnet 50 |
[11] | DCGAN and ResNet |
[12][13] | Grading breast cancer Nottingham histological grade |
[13][14] | U-Net + ResNet50 |
[26] | transfer learning models ResNet50, ResNet101, VGG16, and VGG19 |
METHODS
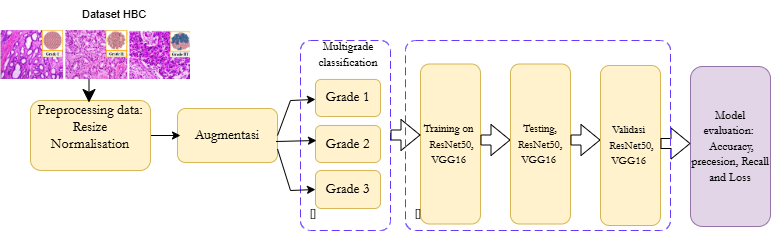
This section describes the methodological workflow used to evaluate ResNet50 and VGG16 for automated Nottingham grading of breast cancer histopathology images. The workflow consists of data collection, preprocessing, augmentation, data splitting, model training, and performance evaluation. The study was implemented using Python 3.12 with PyTorch, NumPy, scikit-learn, and torchvision. Microsoft Excel was used to organize the dataset and support result tabulation. The available hardware information indicates that the experiment was conducted on an Acer Aspire 5 laptop with an AMD Ryzen 5 processor and 8 GB RAM; more detailed GPU and software-version specifications were not fully documented and are therefore acknowledged as a reproducibility limitation.
Data Collection
The dataset was obtained from an Anatomical Pathology Laboratory and consisted of H&E-stained breast cancer histopathological images derived from biopsy specimens (Figure 1). The dataset represents an institution-specific collection rather than a confirmed public multi-center dataset, which should be considered when interpreting generalizability. The available dataset contained 1,742 images from 150 patients and was labeled into Grade I, Grade II, and Grade III according to the available pathology grading records (Figure 2). The task in this study was image-level classification, because each input was treated as an individual histopathological image rather than as a patch aggregated into a whole-slide prediction. Patient inclusion was based on the availability of biopsy-confirmed breast cancer images with grade labels. Ethical approval or de-identified retrospective data-use information should be reported explicitly in the final manuscript if available (Figure 3).
Figure 1. Research Methodology
Figure 2. Representative histopathology images for Grade I, Grade II, and Grade III
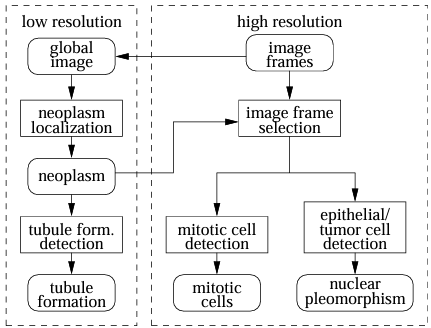
Figure 3. Determination of breast cancer grading
Preprocessing Data
Preprocessing
Was performed to make the input images compatible with CNN training and to reduce technical variability that may arise from image size, intensity range, and acquisition conditions. Since histopathological images can vary in staining intensity and visual appearance, consistent preprocessing is important to support stable learning and fair comparison between architectures.
Image Resizing
All RGB images were resized to 224×224 pixels. This size was selected because it is commonly used by standard CNN architectures, including ResNet50 and VGG16, and allows the models to process images with a consistent tensor shape. Although resizing may reduce some fine cellular details, the selected resolution provides a practical balance between computational efficiency and the ability to learn relevant tissue-level and cellular patterns.
Normalization
After resizing, RGB pixel values were converted into normalized numerical values before model training. In this study, normalization was applied consistently to the images by scaling pixel intensities from the original 0-255 range into the 0-1 range. This step helps stabilize optimization because the model receives inputs with a comparable numerical scale. Specific stain normalization methods, such as Macenko or Reinhard normalization, were not reported in the final experiment; therefore, the absence of stain normalization is acknowledged as a limitation for cross-institution generalization.
| 
| (1) |
where  denotes the original pixel intensity and
  denotes the normalized pixel value used as model input.
Data Augmentation
Data augmentation was applied to increase the effective number of training images and improve model robustness (Figure 4). The augmentation techniques used were horizontal flipping and vertical flipping, which are label-preserving transformations for histopathological image classification. Before augmentation, the dataset consisted of 140 images with Grade I = 30, Grade II = 60, and Grade III = 50. After augmentation, the dataset increased to 1,742 images with Grade I = 384, Grade II = 710, and Grade III = 648. This distribution indicates that the dataset was not fully balanced; therefore, future studies should consider class weighting, balanced sampling, or additional grade-specific augmentation.
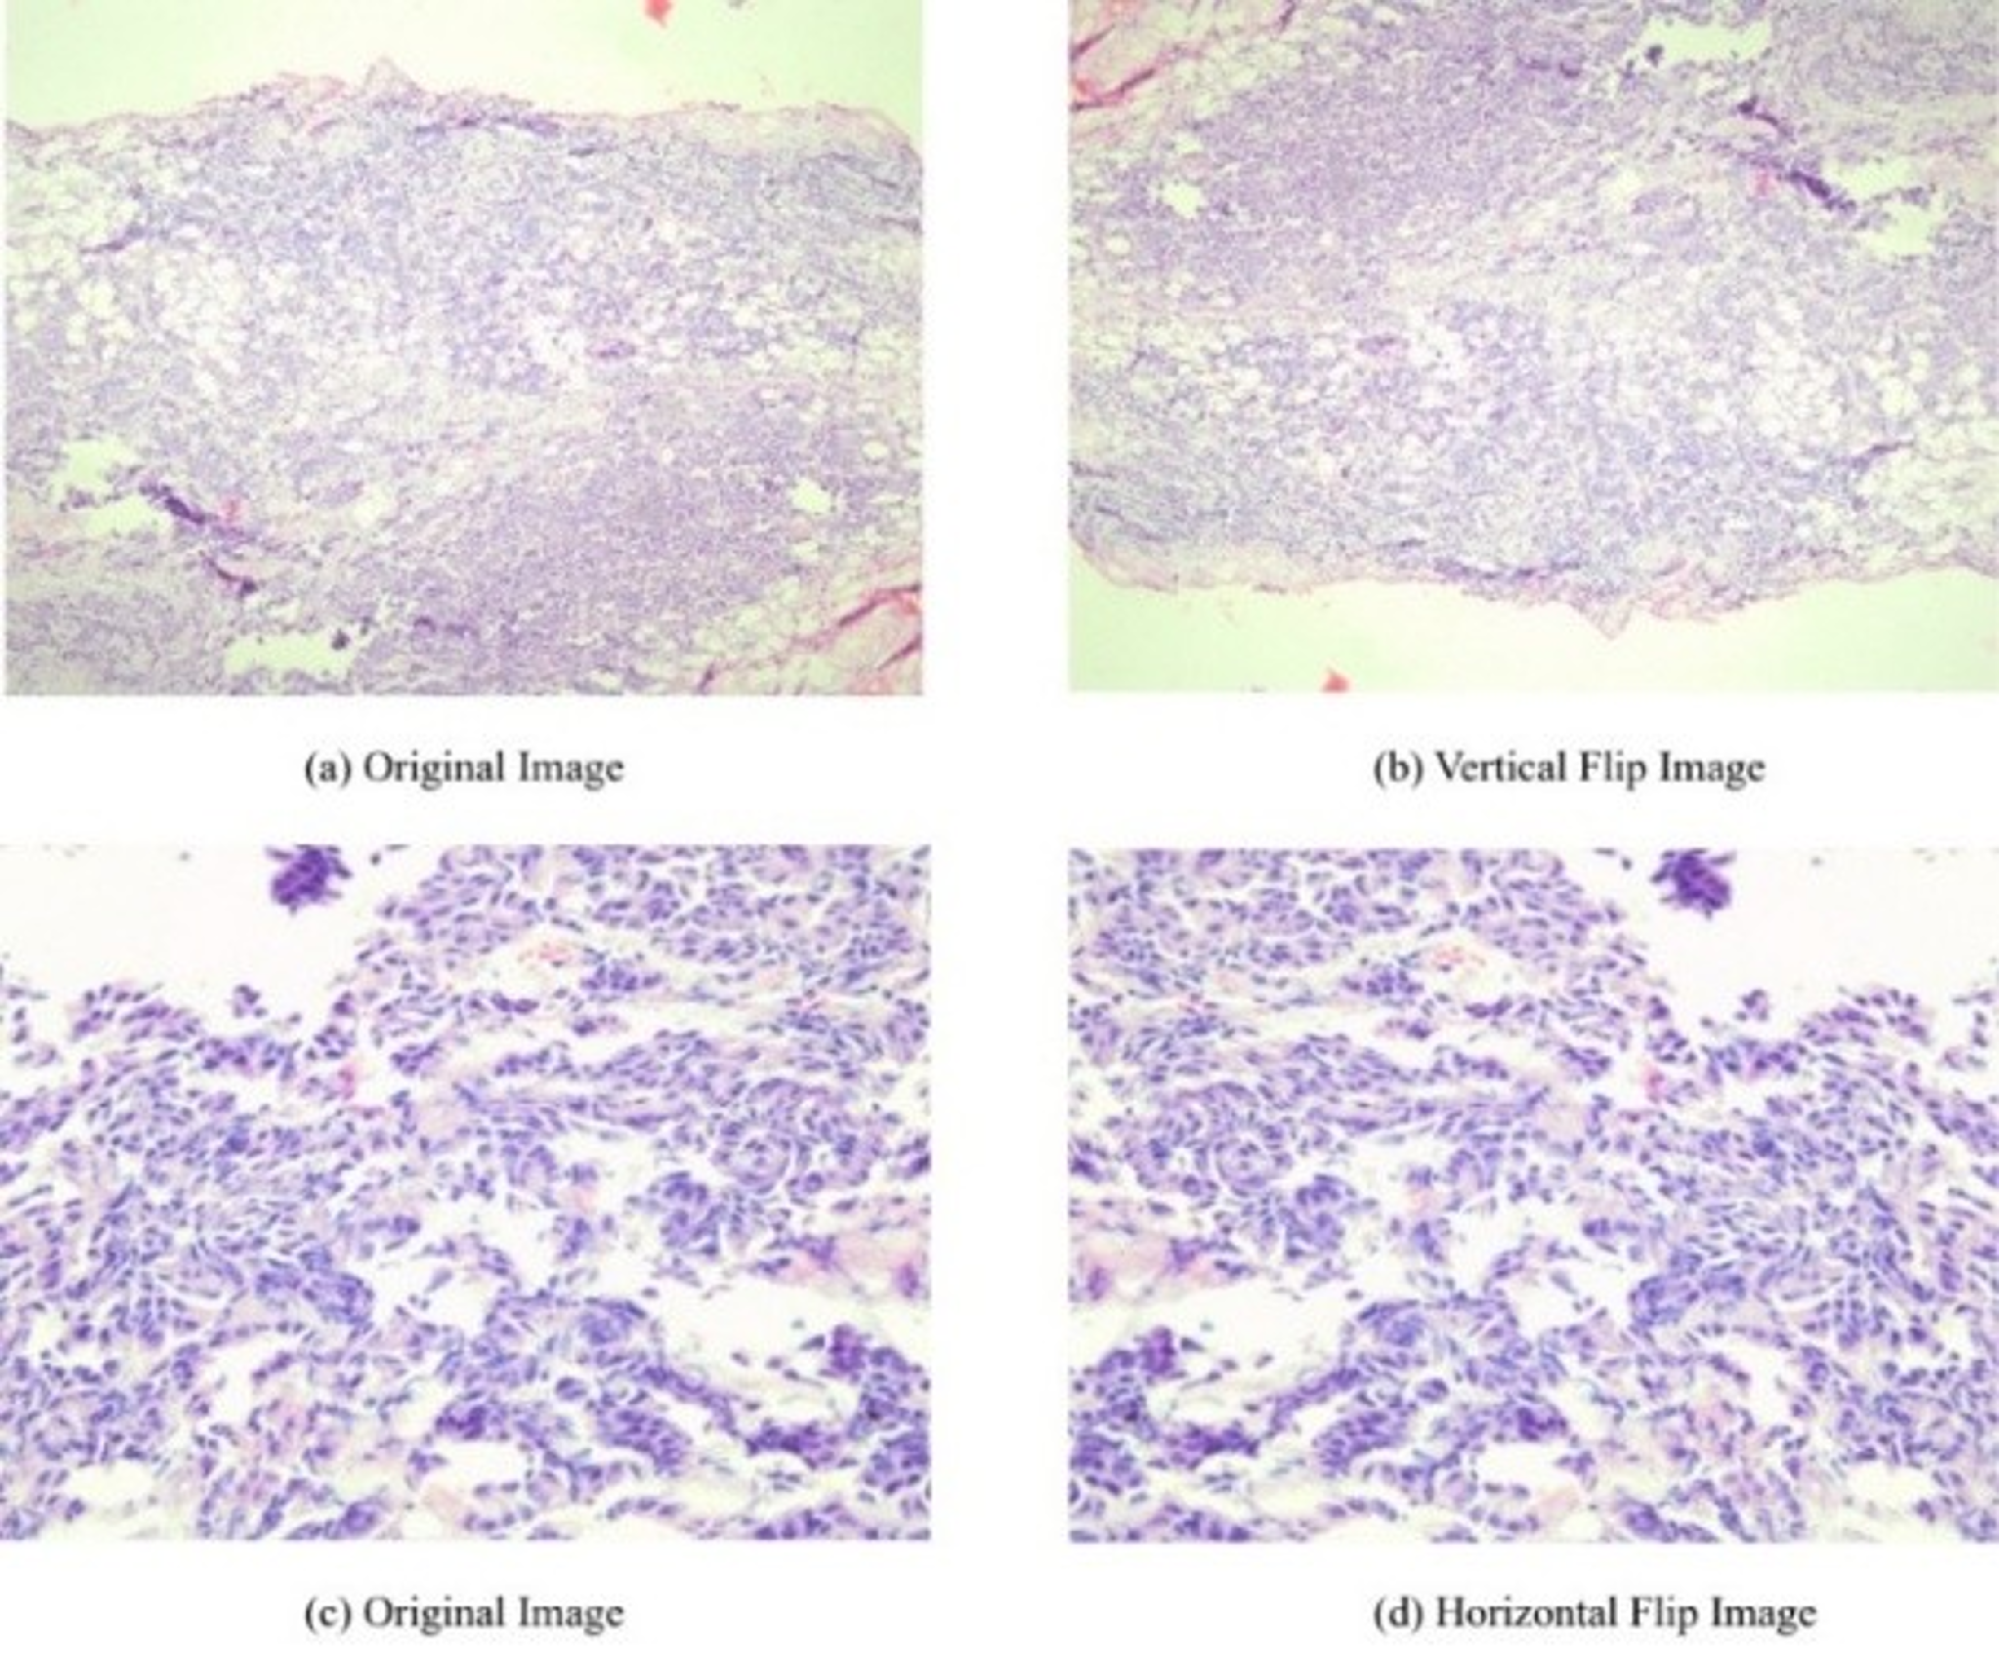
Figure 4. Vertical and horizontal flip results, for image augmentation
Data Splitting Strategy
The dataset was divided into training, validation, and testing subsets using a 70:20:10 proportion, resulting in 1,220 training images, 348 validation images, and 174 testing images. To reduce the risk of data leakage, the split should be performed at the patient level so that images and their augmented derivatives from the same patient appear in only one subset. This strategy is important because image-level splitting may inflate performance when visually similar samples from the same patient are distributed across training and testing subsets.
Model Architectures and Training Configuration
This study compared ResNet50 and VGG16 because both are widely recognized CNN architectures and are frequently used as benchmark backbones in medical image analysis (Figure 5). VGG16 uses a sequential stack of convolutional layers and fully connected layers, while ResNet50 uses residual connections to support deeper feature learning. This comparison allows the study to examine whether residual learning provides an advantage over a classical CNN architecture for Nottingham grading.
| 
| (2) |
Equation (2) represents the residual learning concept, where x is the input feature and F(x) is the residual mapping learned by convolutional layers. The shortcut connection helps preserve information and supports gradient flow during backpropagation.
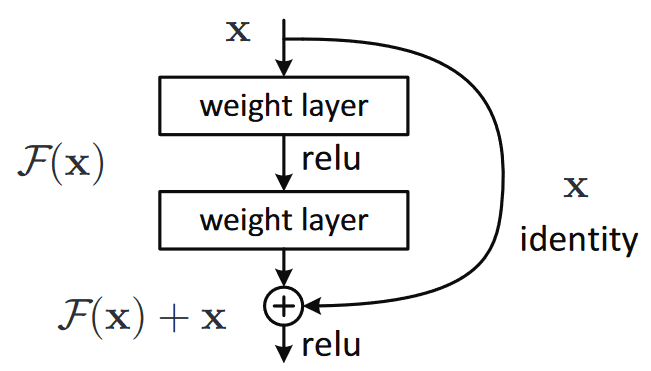
Figure 5. Skip Connection Architecture
ResNet50 (Figure 6) consists of convolutional blocks with residual connections that allow deeper layers to learn complex feature representations without severe degradation of gradient information. In this experiment, the final classification layer was adjusted to produce three raw output logits corresponding to Grade I, Grade II, and Grade III. Raw logits were used because PyTorch CrossEntropyLoss internally applies the softmax operation. Adding an external softmax activation before CrossEntropyLoss would be redundant and may reduce numerical stability during optimization.
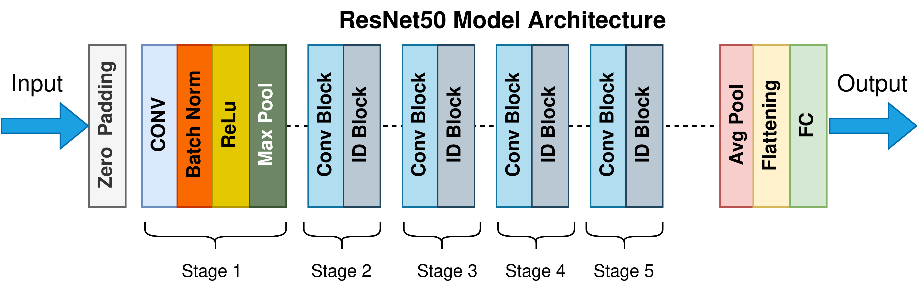
Figure 6. ResNet 50 Architecture
VGG16 (Figure 7) was used as the comparative architecture because it is a classical CNN backbone with a simple and interpretable sequential design. The model relies on stacked 3 x 3 convolutional filters followed by fully connected layers. Compared with ResNet50, VGG16 does not use residual connections, so its learning behavior may differ when modeling subtle histopathological variations among grading categories.
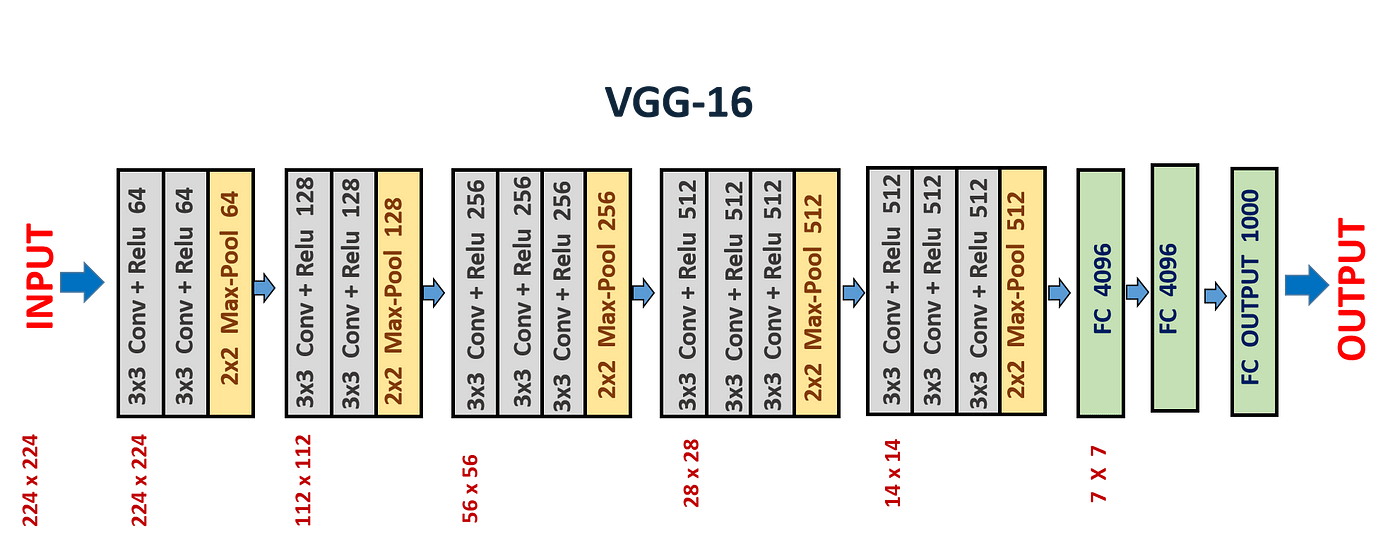
Figure 7. Architecture VGG 16
For training, the VGG16 model used stochastic gradient descent (SGD) with a learning rate of 0.001, a batch size of 32 for training and 64 for testing, and 60 epochs. ResNet50 was trained using SGD and CrossEntropyLoss for 200 epochs. The available experimental record did not fully document all optimizer parameters, such as momentum and weight decay; therefore, this limitation should be stated transparently to support reproducibility. Both models were evaluated under the same reported grading task without an additional attention mechanism.
Model performance was evaluated using training accuracy, training loss, validation accuracy, validation loss, overall accuracy, and recall. In the multi-class setting, true positive, false positive, true negative, and false negative can be interpreted using a one-versus-rest formulation for each grade, where one grade is treated as the positive class and the remaining grades are treated as the negative class. The reported recall summarizes the ability of the model to correctly identify grade categories in the available evaluation setting.
| 
| (3) |
Accuracy measures the proportion of correct predictions among all predictions. Recall measures the proportion of actual positive samples that are correctly identified by the model for a given class or averaged across classes, depending on the reporting strategy.
| 
| (4) |
| 
| (5) |
Loss was computed using cross-entropy loss, where a lower value indicates a smaller discrepancy between the predicted probability distribution and the target label.
| 
| (6) |
Class-wise precision, class-wise recall, F1-score, confidence intervals, statistical significance tests, and confusion matrix interpretation were not available in the final result table used for this revision. Therefore, claims in the Results and Discussion are limited to the metrics reported in Table 2, and additional analyses are recommended for future work.
RESULTS AND DISCUSSION
In this study, both architectures were evaluated for the same three-class Nottingham grading task. The final classification layer produced raw logits, and the loss was computed using CrossEntropyLoss. This design was used because CrossEntropyLoss in PyTorch already incorporates the log-softmax operation internally; therefore, applying an additional softmax activation before the loss calculation would be unnecessary and could affect numerical stability during gradient-based optimization. The reported comparison is based only on the metrics available in Table 2.
Table 2. Training and Testing Results
Metrics | RESNET50 | VGG16 |
Training Accuracy | 0.9735 | 0.8377 |
Training Loss | 0.0809 | 0.5042 |
Validation Accuracy | 0.6792 | 0.5314 |
Validation Loss | 0.0809 | 0.5042 |
Accuracy | 0.7590 | 0.7590 |
Recall | 0.7095 | 0.7017 |
The available VGG16 training configuration used SGD with a learning rate of 0.001, a batch size of 32 for training and 64 for testing, and 60 epochs (Figure 8). ResNet50 used SGD and CrossEntropyLoss and was trained for 200 epochs (Figure 9). The difference in the number of epochs reflects the experimental configuration used for each architecture; however, the use of early stopping, momentum, and weight decay was not fully documented. In addition, the previously reported 0.498 seconds per iteration is not used as a direct speed comparison because the unit of measurement was not sufficiently specified in the final result table.
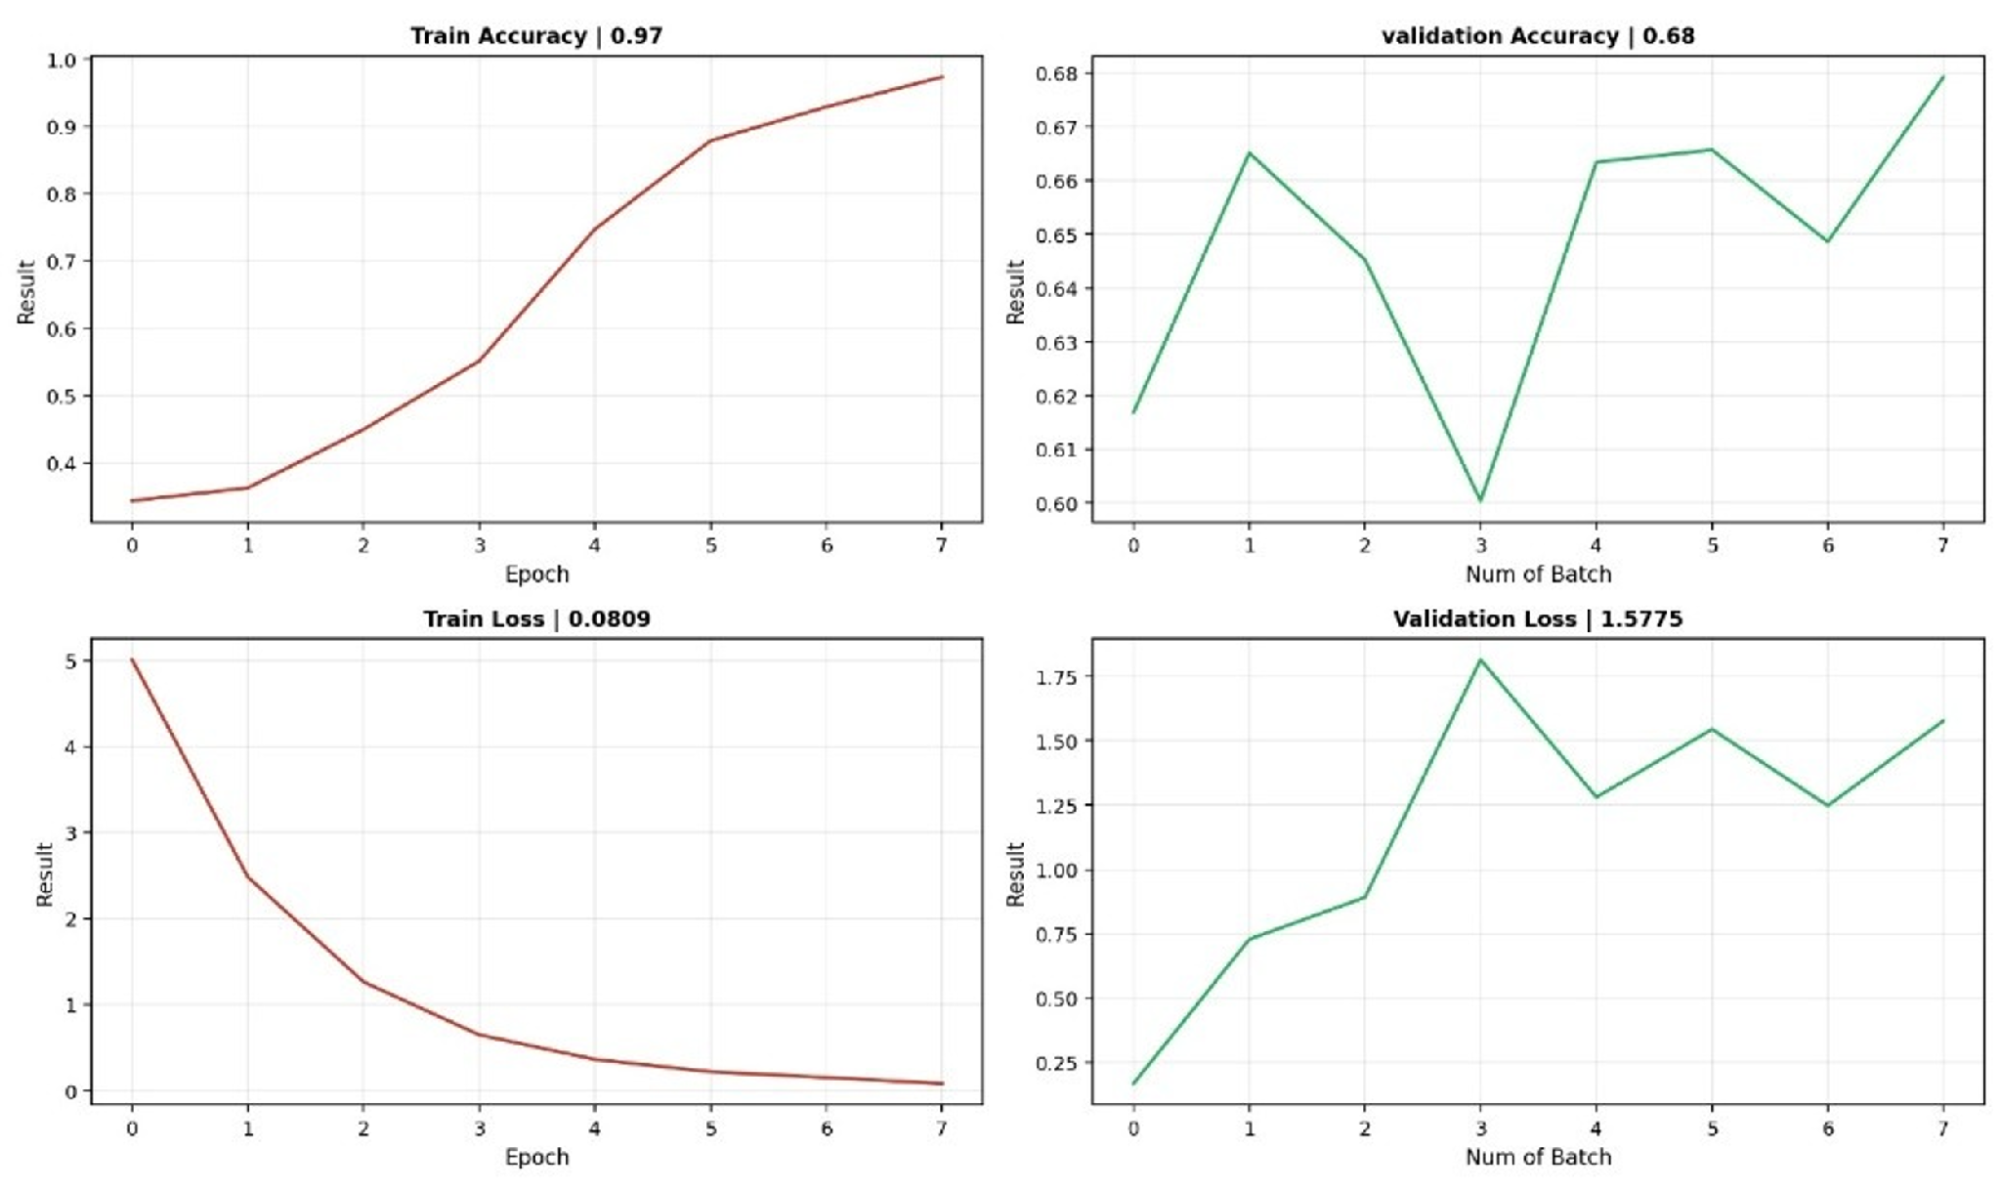
Figure 8. Visualization of training accuracy and loss using the ResNet50 method
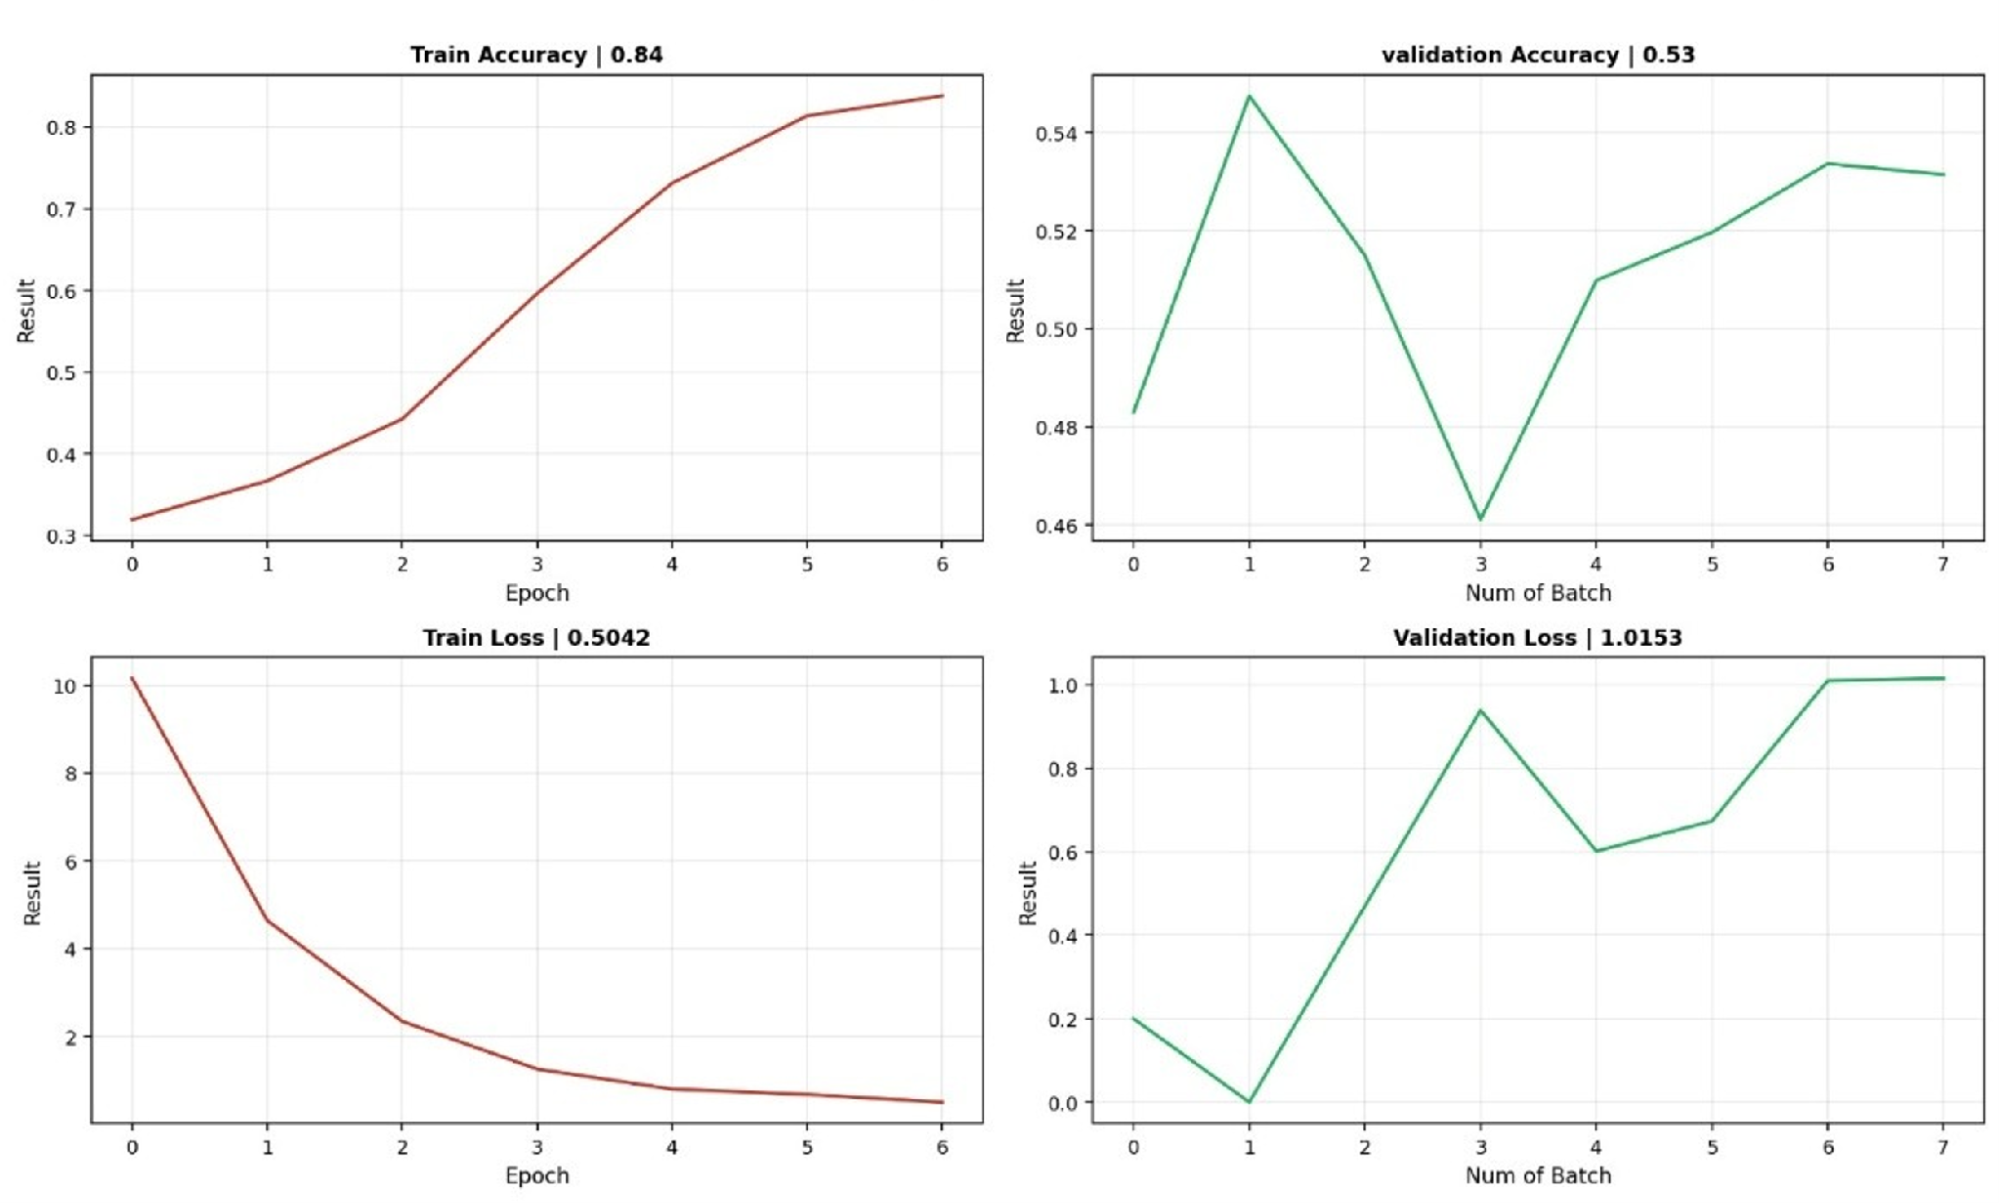
Figure 9. Visualization of training accuracy and loss using the VGG16 method
As shown in Table 2, ResNet50 achieved higher training accuracy than VGG16. The training accuracy of ResNet50 was 0.9735, whereas VGG16 achieved 0.8377. ResNet50 also produced a lower training loss of 0.0809 compared with 0.5042 for VGG16. These results indicate that ResNet50 learned the training data more effectively and reached a stronger optimization state under the reported training configuration.
In the validation stage, ResNet50 again showed better performance than VGG16. ResNet50 achieved a validation accuracy of 0.6792, while VGG16 achieved 0.5314. The reported validation loss was 0.0809 for ResNet50 and 0.5042 for VGG16. These values suggest that ResNet50 had lower prediction error on the validation subset. Nevertheless, the difference between training accuracy and validation accuracy, especially for ResNet50, indicates that the model may still have limited generalization and potential overfitting. Therefore, the result should be interpreted cautiously and should be confirmed through external validation.
For the testing evaluation, both ResNet50 and VGG16 obtained the same overall accuracy of 0.7590. This means that the two architectures produced the same proportion of correct predictions on the test set. Therefore, it would not be appropriate to claim that ResNet50 significantly outperformed VGG16 based on accuracy alone. However, ResNet50 achieved a slightly higher recall value of 0.7095 compared with 0.7017 for VGG16. Although the difference is small, the higher recall suggests that ResNet50 was slightly better at identifying the target grading categories in the reported evaluation.
The loss values also support the comparative advantage of ResNet50 in the reported table. Lower loss values indicate that the model predictions were closer to the target labels during optimization and validation. However, because the training loss and validation loss values are identical for each model in the available table, the original result records should be checked again to ensure that the values were not duplicated during tabulation. This verification is important because loss values are often used to evaluate convergence and generalization behavior.
Overall, the results indicate that ResNet50 performed better than VGG16 in most reported metrics, including training accuracy, training loss, validation accuracy, validation loss, and recall. However, both models achieved the same overall accuracy of 0.7590. Thus, the conclusion should be stated carefully: ResNet50 shows stronger learning behavior and slightly better recall, but the available results do not provide enough evidence to claim statistically significant superiority. Additional class-wise metrics, confusion matrix analysis, confidence intervals, repeated experiments, and external validation are required to strengthen the comparative evidence.
The final reported evaluation does not include class-wise precision, class-wise recall, F1-score, confusion matrix details, confidence intervals, p-values, or inference time per image. Therefore, misclassification patterns between adjacent grades and the quantitative trade-off between speed and accuracy cannot be concluded from the current result table. Future experiments should include these analyses to better identify which grade categories are most difficult to classify and to determine whether performance differences between models are statistically reliable.
CONCLUSION
This study provides a controlled comparison of ResNet50 and VGG16 for automated multi-stage breast cancer histopathology grading based on H&E images and Nottingham grading categories. The comparison was conducted using the reported metrics of training accuracy, training loss, validation accuracy, validation loss, overall accuracy, and recall.
Based on the final result table, ResNet50 achieved higher training accuracy (0.9735) than VGG16 (0.8377), lower training loss (0.0809 versus 0.5042), higher validation accuracy (0.6792 versus 0.5314), and slightly higher recall (0.7095 versus 0.7017). Both models obtained the same overall accuracy of 0.7590 on the testing evaluation. Therefore, ResNet50 can be considered better in terms of learning behavior, validation performance, and recall, but not in terms of overall test accuracy because both models produced the same value.
From a clinical perspective, the slightly higher recall and lower loss of ResNet50 suggest that residual learning may be useful for supporting more consistent histopathological grade prediction. However, the model should only be positioned as a potential decision-support tool for screening or second-opinion workflows. It should not be considered ready for clinical deployment without broader validation.
This study has several limitations, including the use of an institution-specific dataset, limited documentation of some hyperparameters, absence of external validation, and lack of class-wise metrics, confusion matrix analysis, confidence intervals, and statistical significance testing. Future research should evaluate these models on larger multi-center datasets, apply stronger regularization or class-balancing strategies, explore attention-based or hybrid architectures, and include weakly supervised or multiple-instance learning approaches for higher-resolution pathology data.
REFERENCES
- H. Sung, J. Ferlay, R. L. Siegel, M. Laversanne, I. Soerjomataram, A. Jemal, and F. Bray, "Global Cancer Statistics 2020: GLOBOCAN Estimates of Incidence and Mortality Worldwide for 36 Cancers in 185 Countries," CA Cancer J. Clin., vol. 71, no. 3, pp. 209-249, May 2021, https://doi.org/10.3322/caac.21660.
- N. Harbeck, F. Penault-Llorca, J. Cortes, M. Gnant, N. Houssami, P. Poortmans, K. Ruddy, E. Tsang, and F. Cardoso, "Breast cancer," Nat. Rev. Dis. Primers, vol. 5, no. 1, p. 66, Sep. 2019, https://doi.org/10.1038/s41572-019-0111-2.
- A. G. Waks and E. P. Winer, "Breast Cancer Treatment: A Review," JAMA, vol. 321, no. 3, pp. 288-300, Jan. 2019, https://doi.org/10.1001/jama.2018.19323.
- C. van Dooijeweert, P. J. van Diest, and I. O. Ellis, "Grading of invasive breast carcinoma: the way forward," Virchows Arch., vol. 480, no. 1, pp. 33-43, Jan. 2022, https://doi.org/10.1007/s00428-021-03141-2.
- P. S. Ginter, R. Idress, T. M. D'Alfonso, S. Fineberg, and M. Harigopal, "Histologic grading of breast carcinoma: a multi-institution study of interobserver variation using virtual microscopy," Mod. Pathol., vol. 34, no. 4, pp. 701-709, Apr. 2021, https://doi.org/10.1038/s41379-020-00698-2.
- C. W. Elston and I. O. Ellis, "Pathological prognostic factors in breast cancer. I. The value of histological grade in breast cancer: experience from a large study with long-term follow-up," Histopathology, vol. 19, no. 5, pp. 403-410, Nov. 1991, https://doi.org/10.1111/j.1365-2559.1991.tb00229.x.
- E. A. Rakha, M. E. M. El-Sayed, A. R. Lee, I. O. Ellis, and J. F. R. Robertson, "Prognostic significance of Nottingham histologic grade in invasive breast carcinoma," J. Clin. Oncol., vol. 26, no. 19, pp. 3153-3158, Jul. 2008, https://doi.org/10.1200/JCO.2007.15.5986.
- E. A. Rakha et al., "Breast cancer prognostic classification in the molecular era: the role of histological grade," Breast Cancer Res., vol. 12, no. 4, p. 207, Aug. 2010, https://doi.org/10.1186/bcr2607.
- A. P. Wibawa, A. N. Handayani, M. R. M. Rukantala, M. Ferdyan, L. A. P. Budi, A. B. P. Utama, and F. A. Dwiyanto, "Decoding and preserving Indonesia's iconic Keris via A CNN-based classification," Telematics and Informatics Reports, vol. 13, p. 100120, Mar. 2024, https://doi.org/10.1016/j.teler.2024.100120.
- J. van der Laak, G. Litjens, and F. Ciompi, "Deep learning in histopathology: the path to the clinic," Nat. Med., vol. 27, no. 5, pp. 775-784, May 2021, https://doi.org/10.1038/s41591-021-01343-4.
- G. Litjens et al., "A survey on deep learning in medical image analysis," Med. Image Anal., vol. 42, pp. 60-88, Dec. 2017, https://doi.org/10.1016/j.media.2017.07.005.
- K. He, X. Zhang, S. Ren, and J. Sun, "Deep Residual Learning for Image Recognition," in Proc. IEEE Conf. Comput. Vis. Pattern Recognit. (CVPR), 2016, pp. 770-778, https://doi.org/10.1109/CVPR.2016.90.
- K. Simonyan and A. Zisserman, "Very Deep Convolutional Networks for Large-Scale Image Recognition," 2014, arXiv:1409.1556.
- H. D. Couture et al., "Image analysis with deep learning to predict breast cancer grade, ER status, histologic subtype, and intrinsic subtype," npj Breast Cancer, vol. 4, p. 30, 2018, https://doi.org/10.1038/s41523-018-0079-1.
- Y. Wang et al., "Improved breast cancer histological grading using deep learning," Ann. Oncol., vol. 33, no. 1, pp. 89-98, Jan. 2022, https://doi.org/10.1016/j.annonc.2021.09.007.
- R. Jaroensri et al., "Deep learning models for histologic grading of breast cancer and association with disease prognosis," npj Breast Cancer, vol. 8, p. 113, Oct. 2022, https://doi.org/10.1038/s41523-022-00478-y.
- L. Jiang et al., "Deep learning applications in breast cancer histopathological imaging: diagnosis, treatment, and prognosis," Breast Cancer Res., vol. 26, p. 95, 2024, https://doi.org/10.1186/s13058-024-01895-6.
- M. Gadermayr and M. Tschuchnig, "Multiple instance learning for digital pathology: A review of the state-of-the-art, limitations & future potential," Comput. Med. Imaging Graph., vol. 112, p. 102337, Mar. 2024, https://doi.org/10.1016/j.compmedimag.2024.102337.
- G. Campanella et al., "Clinical-grade computational pathology using weakly supervised deep learning on whole slide images," Nat. Med., vol. 25, no. 8, pp. 1301-1309, Aug. 2019, https://doi.org/10.1038/s41591-019-0508-1.
- M. Ilse, J. M. Tomczak, and M. Welling, "Attention-based Deep Multiple Instance Learning," in Proc. Int. Conf. Mach. Learn. (ICML), pp. 2127-2136, 2018, https://proceedings.mlr.press/v80/ilse18a.html?ref=https://.
- D. Tellez et al., "Neural Image Compression for Gigapixel Histopathology Image Analysis," IEEE Trans. Pattern Anal. Mach. Intell., vol. 43, no. 2, pp. 567-578, Feb. 2021, https://doi.org/10.1109/TPAMI.2019.2936841.
- M. I. Mahmud, M. Mamun and A. Abdelgawad, "A Deep Analysis of Transfer Learning Based Breast Cancer Detection Using Histopathology Images," 2023 10th International Conference on Signal Processing and Integrated Networks (SPIN), pp. 198-204, 2023, https://doi.org/10.1109/SPIN57001.2023.10117110.
- F. A. Spanhol, L. S. Oliveira, C. Petitjean, and L. Heutte, "A dataset for breast cancer histopathological image classification," IEEE Trans. Biomed. Eng., vol. 63, no. 7, pp. 1455-1462, Jul. 2016, https://doi.org/10.1109/TBME.2015.2496264.
- N. Islam, K. M. Hasib, M. F. Mridha, S. Alfarhood, M. Safran, and M. K. Bhuyan, "Fusing global context with multiscale context for enhanced breast cancer classification," Sci. Rep., vol. 14, p. 27358, Nov. 2024, https://doi.org/10.1038/s41598-024-78363-w.
- G. Litjens, T. Kooi, B. E. Bejnordi, A. A. A. Setio, F. Ciompi, M. Ghafoorian, J. A. W. M. van der Laak, B. van Ginneken, and C. I. Sánchez, "A survey on deep learning in medical image analysis," Med. Image Anal., vol. 42, pp. 60-88, Dec. 2017, https://doi.org/10.1016/j.media.2017.07.005.
- M. Z. Hoque, A. Keskinarkaus, P. Nyberg, and T. Seppänen, "Stain normalization methods for histopathology image analysis: A comprehensive review and experimental comparison," Inf. Fusion, vol. 102, p. 101997, Feb. 2024, https://doi.org/10.1016/j.inffus.2023.101997.
- P. A. Dunn, S. Stallard, L. A. E. van der Maaten, S. L. van der Laak, D. J. B. S. Weijers, R. van Dijk, and J. van der Laak, "Stain variability negatively impacts deep learning model generalization in histopathology: An international multi-center study," J. Pathol. Inform., vol. 16, p. 101011, 2025, https://doi.org/10.1016/j.jpi.2025.101011.
- M. A. Morid, A. Borjali, and G. Del Fiol, "A scoping review of transfer learning research on medical image analysis using ImageNet," Comput. Biol. Med., vol. 128, p. 104115, Jan. 2021, https://doi.org/10.1016/j.compbiomed.2020.104115.
- O. Russakovsky, J. Deng, H. Su, J. Krause, S. Satheesh, S. Ma, Z. Huang, A. Karpathy, A. Khosla, M. Bernstein, A. C. Berg, and L. Fei-Fei, "ImageNet Large Scale Visual Recognition Challenge," Int. J. Comput. Vis., vol. 115, pp. 211-252, 2015, https://doi.org/10.1007/s11263-015-0816-y.
- G. Litjens et al., "A survey on deep learning in medical image analysis," Med. Image Anal., vol. 42, pp. 60-88, 2017, https://doi.org/10.1016/j.media.2017.07.005.
- R. Sutjiadi, S. Sendari, H. W. Herwanto, and Y. Kristian, "Generating High-quality Synthetic Mammogram Images Using Denoising Diffusion Probabilistic Models: a Novel Approach for Augmenting Deep Learning Datasets," in Proc. 2024 Int. Conf. Information Technology Systems and Innovation (ICITSI), pp. 386-392, Dec. 2024, https://doi.org/10.1109/ICITSI65188.2024.10929446.
- R. Sutjiadi, S. Sendari, H. W. Herwanto, and Y. Kristian, "Deep Learning for Segmentation and Classification in Mammograms for Breast Cancer Detection: A Systematic Literature Review," Adv. Ultrasound Diagn. Ther., vol. 8, no. 3, pp. 94-105, 2024, https://doi.org/10.37015/AUDT.2024.230051.
- R. Sutjiadi, S. Sendari, H. W. Herwanto, and Y. Kristian, "Leveraging Synthetic Mammograms to Enhance Deep-Learning Performance for Breast Cancer Classification Using EfficientNetV2L Architecture," EAI Endorsed Trans. AI Robot., vol. 4, Sep. 2025, https://doi.org/10.4108/airo.9749.
- H. W. Herwanto, "Penggunaan wavelet image enhancement dan tekstur energi citra untuk mendeteksi massa mencurigakan pada mamogram," Teknologi dan Kejuruan, vol. 31, no. 1, Sep. 2012, https://doi.org/10.17977/tk.v31i1.3187.
- I. K. M. Jais and A. R. Ismail, "Adam Optimization Algorithm for Wide and Deep Neural Network," Knowledge Engineering and Data Science, vol. 2, no. 1, pp. 41-46, 2019, https://doi.org/10.17977/um018v2i12019p41-46.
- F. Schwarzhans et al., "Image normalization techniques and their effect on the robustness and predictive power of breast MRI radiomics," Eur. J. Radiol., vol. 187, p. 112086, 2025, https://doi.org/10.1016/j.ejrad.2025.112086.
- M. J. Willemink et al., "Preparing medical imaging data for machine learning," Radiology, vol. 295, no. 1, pp. 4-15, 2020, https://doi.org/10.1148/radiol.2020192224.
- C. Shorten and T. M. Khoshgoftaar, "A survey on image data augmentation for deep learning," J. Big Data, vol. 6, p. 60, 2019, https://doi.org/10.1186/s40537-019-0197-0.
- D. Tellez et al., "Quantifying the effects of data augmentation and stain color normalization in convolutional neural networks for computational pathology," Med. Image Anal., vol. 58, p. 101544, 2019, https://doi.org/10.1016/j.media.2019.101544.
- N. Bussola, A. Marcolini, V. Maggio, G. Jurman, and C. Furlanello, "AI slipping on tiles: Data leakage in digital pathology," in Pattern Recognition. ICPR International Workshops and Challenges, pp. 167-182, 2021, https://doi.org/10.1007/978-3-030-68763-2_13.
- I. E. Tampu, A. Eklund, and N. Haj-Hosseini, "Inflation of test accuracy due to data leakage in deep learning-based classification of OCT images," Sci. Data, vol. 9, p. 580, 2022, https://doi.org/10.1038/s41597-022-01618-6.
- H. C. Shin, H. R. Roth, M. Gao, L. Lu, Z. Xu, I. Nogues, J. Yao, D. Mollura, and R. M. Summers, "Deep convolutional neural networks for computer-aided detection: CNN architectures, dataset characteristics and transfer learning," IEEE Trans. Med. Imaging, vol. 35, no. 5, pp. 1285-1298, May 2016, https://doi.org/10.1109/TMI.2016.2528162.
- S. J. Pan and Q. Yang, "A survey on transfer learning," IEEE Trans. Knowl. Data Eng., vol. 22, no. 10, pp. 1345-1359, Oct. 2010, https://doi.org/10.1109/TKDE.2009.191.
- R. Mormont, P. Geurts, and R. Marée, "Comparison of deep transfer learning strategies for digital pathology," in Proc. IEEE Conf. Comput. Vis. Pattern Recognit. Workshops (CVPRW), Jun. 2018, pp. 2262-2271.
- M. Sokolova and G. Lapalme, "A systematic analysis of performance measures for classification tasks," Inf. Process. Manage., vol. 45, no. 4, pp. 427-437, Jul. 2009, https://doi.org/10.1016/j.ipm.2009.03.002.
- I. Goodfellow, Y. Bengio, and A. Courville. Deep learning. vol. 1, no. 2, pp. 1-800. Cambridge: MIT press. 2016, https://doi.org/10.4258/hir.2016.22.4.351.
- M. Macenko, M. Niethammer, J. S. Marron, D. Borland, J. T. Woosley, X. Guan, C. Schmitt, and N. E. Thomas, "A method for normalizing histology slides for quantitative analysis," in Proc. 2009 IEEE Int. Symp. Biomed. Imaging: From Nano to Macro (ISBI), 2009, pp. 1107-1110, https://doi.org/10.1109/ISBI.2009.5193250.
- E. Reinhard, M. Ashikhmin, B. Gooch, and P. Shirley, "Color transfer between images," IEEE Comput. Graph. Appl., vol. 21, no. 5, pp. 34-41, Sep.-Oct. 2001, https://doi.org/10.1109/38.946629.
- G. Landini, G. Martinelli, and F. Piccinini, “Colour deconvolution: stain unmixing in histological imaging,” Bioinformatics, vol. 37, no. 10, pp. 1485-1487, 2021, https://doi.org/10.1093/bioinformatics/btaa847.
- H. Zhang, M. Cisse, Y. N. Dauphin, and D. Lopez-Paz, "mixup: Beyond empirical risk minimization," arXiv:1710.09412, 2017, https://doi.org/10.48550/arXiv.1710.09412.
- S. Yun, D. Han, S. J. Oh, S. Chun, J. Choe, and Y. Yoo, "CutMix: Regularization strategy to train strong classifiers with localizable features," In Proceedings of the IEEE/CVF international conference on computer vision, pp. 6023-6032, 2019, https://openaccess.thecvf.com/content_ICCV_2019/html/Yun_CutMix_Regularization_Strategy_to_Train_Strong_Classifiers_With_Localizable_Features_ICCV_2019_paper.html.
- E. D. Cubuk, B. Zoph, J. Shlens, and Q. V. Le, "RandAugment: Practical automated data augmentation with a reduced search space," in Proc. IEEE/CVF Conf. Comput. Vis. Pattern Recognit. Workshops (CVPRW), 2020, arXiv:1909.13719.
- J. Cohen, "A coefficient of agreement for nominal scales," Educ. Psychol. Meas., vol. 20, no. 1, pp. 37-46, Apr. 1960, https://doi.org/10.1177/001316446002000104.
- T. Fawcett, "An introduction to ROC analysis," Pattern Recognit. Lett., vol. 27, no. 8, pp. 861-874, Jun. 2006, https://doi.org/10.1016/j.patrec.2005.10.010.
- R. R. Selvaraju, M. Cogswell, A. Das, R. Vedantam, D. Parikh, and D. Batra, "Grad-CAM: Visual explanations from deep networks via gradient-based localization," Int. J. Comput. Vis., vol. 128, no. 2, pp. 336-359, Feb. 2020, https://doi.org/10.1007/s11263-019-01228-7.
Agoes Santika Hyperastuty, is students who are studying at the Department of Electrical Engineering, State University of Malang. She specializes in image processing, deep learning, and breast cancer. Currently, she is developing a breast cancer scoring system using histopathological images of breast cancer with CNN. Email: agoes.santika.2405349@students.um.ac.id ORCID: https://orcid.org/0009-0006-3731-059X Scopus ID: https://www.scopus.com/authid/detail.uri?authorId=57205294541 Google Scholar: https://scholar.google.com/citations?user=TUVtE64AAAAJ&hl=id |
|
Anik Nur Handayani is a senior lecturer and researcher at the Department of Electrical Engineering, Faculty of Engineering, State University of Malang, Indonesia. His research areas include Digital Image Processing, Machine Learning, Embedded Systems, and Intelligent Assistance Technologies. He has been actively involved in various national research projects and has published numerous scientific papers related to computer vision and human-computer interaction. Email: anik.nur.ft@um.ac.id ORCID: https://orcid.org/0009-0003-0767-8471 Scopus ID: https://www.scopus.com/authid/detail.uri?authorId=57193701633 Google Scholar: https://scholar.google.com/citations?user=nqPHjbMAAAAJ&hl=en |
|
Heru Wahyu Herwanto is a faculty member at the Department of Electrical Engineering, Faculty of Engineering, State University of Malang, Indonesia. His research focuses on embedded systems, digital signal processing, the Internet of Things (IoT), and machine learning applications. He has contributed to numerous scientific publications and national research programs in the field of intelligent systems and automation. Email: heru.wahyu.ft@um.ac.id ORCID: https://orcid.org/0009-0000-0796-3596 Scopus ID: https://www.scopus.com/authid/detail.uri?authorId=57194026701 Google Scholar: https://scholar.google.co.id/citations?user=XZq2mHkAAAAJ&hl=id |
|
Nor Salwa Damanhuri received her Bachelor of Science (Hons.) in Electrical and Electronics Engineering from Universiti Tenaga Nasional (UNITEN), Malaysia, in March 2002. She completed her Master of Science in Control Systems Engineering at The University of Sheffield, United Kingdom, in September 2005, and obtained her Doctor of Philosophy (Ph.D) in Bioengineering from the University of Canterbury, Christchurch, New Zealand, in 2015. She is currently an Associate Professor at the Centre for Electrical Engineering Studies, Universiti Teknologi MARA (UiTM), Penang Branch, Malaysia. Her research interests include biomedical engineering, digital signal processing, mathematical modeling, control systems, and solar PV system applications. Email: norsalwa071@uitm.edu.my Google Scholar: https://scholar.google.com/citations?user=O3DojDMAAAAJ&hl=en |
Agoes Santika Hyperastuty (Performance Evaluation of ResNet50 and VGG16 in Automated Multi-Stage Breast Cancer Histopathology Grading)