ISSN: 2685-9572 Buletin Ilmiah Sarjana Teknik Elektro
Vol. 8, No. 1, February 2026, pp. 272-293
Application of AI-IoT Technologies to Develop the Smart LED Display Management and Monitoring System for the Laboratory
Trinh Luong Mien, Vu Van Duy, Trinh Thi Huong, Nguyen Trung Dung
Faculty of Electrical-Electronic Engineering, University of Transport and Communications, Hanoi, Vietnam
ARTICLE INFORMATION |
| ABSTRACT |
Article History: Received 09 November 2025 Revised 18 January 2026 Accepted 27 February 2026 |
| 
Smart LED display systems are widely used to provide useful information to users, ranging from simple LED screens to complex screens management and monitoring systems involving a large number of diverse devices, capable of integrating modern technologies. This research focuses on developing a smart LED display management and monitoring system for a laboratory using AI-IoT technologies, which combines deep learning, computer vision, edge computing, embedded system, IoT Communication (MQTT), and web-based management. The goal is to provide convenience, efficiency, and flexibility for users and managers, enabling easy remote information updates and real-time display on LED screens, while simultaneously automatically monitoring and accurately counting the number of people entering and leaving the laboratory. The development of the system includes designing an ESP32-based central LED control board, selecting the P2.5 LED modules, the jetson nano, the Logitech C505e camera, suitable for low-cost educational research. Subsequently, the article introduces the image processing algorithm for counting people based on YOLOv7 TensorRT inference and develops the web management interface based on the Next.js platform, combined with data communication via MQTT protocol. This research was then experimentally implemented at the Mitsubishi FA Laboratory at the university of transport and communications (UTC). The experimental results showed that the Web interface features a grid layout divided into three functional groups, allowing for display content configuration, graphical visualization, clear status display. It provides networked link-tags for updating date/time, temperature/humidity, and In/Out people counts in real-time on both the Web and the LED screen via MQTT/ WebSocket protocols. The experimental results also indicated that the proposed algorithm for counting people In/Out the laboratory achieves high accuracy, over 90%, under normal, stable lighting conditions. This confirms that the proposed smart LED display system operates efficiently, stably, and reliably, and suitable for promoting the digital management of laboratories at a low investment cost. |
Keywords: LED Display Management; Jetson Nano-ESP32 Kit; Internet of Things (IoT); Artificial Intelligence (AI); Deep Learning (DL); Computer Vision (CV); MQTT Protocol; YOLO-Based Object Detection |
Corresponding Author: NguyenTrung Dung, Faculty of Electrical-Electronic Engineering, University of Transport and Communications, Hanoi, Vietnam. Email: dungnt1@utc.edu.vn |
This work is open access under a Creative Commons Attribution-Share Alike 4.0 
|
Document Citation: T. L. Mien, V. V. Duy, T. T. Huong, and N. T. Dung, “Application of AI-IoT Technologies to Develop the Smart LED Display Management and Monitoring System for the Laboratory,” Buletin Ilmiah Sarjana Teknik Elektro, vol. 8, no. 1, pp. 272-293, 2026, DOI: 10.12928/biste.v8i1.15263. |
- INTRODUCTION
The LED display device is an electronic screen that utilizes Light Emitting Diode (LED) technology to present information in the form of text, images, or dynamic effects. The LED display systems provide visual information and allow for content modification according to practical requirements. In the context of industry 4.0, the application of LED display systems has become increasingly widespread in many fields, including advertising, commerce, warning systems, traffic monitoring, factories, schools, hospitals, and administrative agencies. These systems serve not only as information display devices but are also integrated with numerous modern technologies to enhance user efficiency, such as the flexible content display capabilities and convenient remote control for information updates, thereby optimizing costs and improving overall system operational performance.
In recent years, smart LED display systems have become increasingly popular due to their superior advantages, such as energy efficiency and high durability, which facilitate reduced maintenance costs. Additionally, they offer flexible and easy content update capabilities via remote control protocols like Wi-Fi, Bluetooth, or wired networks, enabling the diverse display of information ranging from text, icons, and warnings to real-time sensor data.
Some recent studies have focused on the development of smart LED display systems, ranging from design, fabrication, and testing to the application of modern technologies within these systems. Other studies address the issue of energy efficiency in LED screens by integrating energy-saving controllers, adjusting brightness based on ambient light, and utilizing renewable energy sources such as solar power. The research [1] designed and fabricated a GSM-based mobile digital message display to serve modern public relations purposes, facilitating easy and remote updates of new messages. The research [2] indicated that installing solar panels can reduce the energy consumption of outdoor LEDs by up to 30%. Simultaneously, the trend of integrating artificial intelligence into LED displays is also being emphasized to automate content changes based on data from motion and sound sensors. The research [3] presented a real-time, long-distance display-camera communication system utilizing an LED-DCC clustering scheme to improve VLC signal quality and enhance the reliability of information extraction from cameras. However, this research needs to further improve the channel capacity of the LED-DCC system and implement it in practical applications. The study [4] introduced an automatic smart signage control system based on wireless communication and LED signage to warn drivers at accident-prone locations, using data from cameras detecting traffic conditions and sensors monitoring environmental parameters that may affect traffic. The study [5] presented the design and implementation of an IoT-based door signage system to notify the status of room occupants, helping to reduce the time required to change room status, increase the accuracy of the signage, and eliminate the need for physical contact with the sign. The studies [6] and [7] introduced an LED screen controller design based on FPGA and STM32, enabling easy reception of display data from USB, Ethernet, and SD card interfaces with high data throughput and efficient operation. The study [8] presented an auto-configuring LED display system based on computer vision to determine the position of each LED and communicate via the MQTT protocol, allowing LEDs to function as pixels to display a collective image. The studies [9][10] presented solutions for updating LED bulletin boards using wireless IoT technology with experimental models on Arduino/ESP32 kits, facilitating easy remote interaction and enabling users to quickly share and receive the latest information on mobile devices. The study [11] introduced key concepts regarding hardware and software design to realize the deployment of large-screen LED display systems in stadiums, demonstrating the diverse applicability of LED display systems. The studies [1]-[11] initially yielded positive results, meeting a wide range of applications in LED screen usage. However, these studies mainly focus on the LED display function, and have not yet provided AI-powered people counting functionality, nor have they fully integrated display and monitoring functions into a complete system.
In the digital society of connected things, in addition to some of the above studies on IoT applications for LED screens, IoT technology is also being studied by scientists for application in a variety of other practical applications, such as monitoring power load [12], monitoring electrical equipment in classrooms [13][14], monitoring gas leak [15][16], monitoring the engine oil level [17], automation and monitoring in agriculture [18]-[20], monitoring temperature/humidity [21]-[24] and monitoring environmental air [25]. These studies demonstrate the great potential and practical effectiveness of applying IoT technology in LED screen display monitoring management systems.
The research [26] presents the application of machine vision techniques and Yolov5 algorithm to detect LED faults on display panels by visual inspection using images collected from cameras. Research [27] introduces an overview of integrated deep learning solutions utilizing convolutional neural networks (CNN) algorithms, or Yolo, to detect faults in solar panels or to detect road surface cracks [28]. Meanwhile, research [29] develops algorithms based on Yolov3 and Yolov4 models to detect license plates, research [30]-[32] applies AI based on multi-task cascaded convolutional neural networks or Yolo for vehicle identification and counting, and initially also obtains encouraging results, contributing to solving the problem of traffic monitoring, reducing congestion, and ensuring traffic safety.
The research on human object detection monitoring using AI has been presented in a number of works [33]-[40]. The research [33] applies Yolov5 or the research [34] applies Yolov8, Yolov11 to detect human objects in search and rescue operations using drones, thereby allowing faster victim location determination, or application to detect the location of car drivers to help improve driving safety [35]. The research [36] develops the Yolo algorithm to detect people in residential areas concentrated in public areas, helping to improve social order and security. The research [37] presents evaluation results and recommendations for using Yolov8, Yolov5 in various specific applications. The research [38] presents the Yolov8 application for people counting recognition during festivals, anniversaries and pilgrimages, allowing to ensure social order and security, analyze people flows to find bottlenecks and report daily on people entering and leaving specific management areas. The research [39] focuses on the process of deploying deep learning models for real-time object detection using YOLOv4, however the system gives false detection results when there is clutter in the background or small objects. The research [40] applies AI-IoT technology to allow remote automatic monitoring of student activities in the classroom and send information to users via the network.
Nowadays, the trend of applying AI technology to monitor and detect objects, while integrating IoT technology for remote communication, is increasingly being researched and applied popularly. Therefore, researching the integration of AI-IoT technologies into the LED display monitoring management system for public areas such as hospitals, schools... will bring practical effects to users, especially in monitoring human actions, counting the number of people in the monitoring area, thereby serving many other target tasks. One of those tasks is the digital management of university laboratories, including monitoring equipment, tracking student entry and exit from the laboratory, and displaying this information visually, objectively, and automatically in real time on LED display screens.
This article focuses on the development of a smart LED display management and monitoring system capable of remote control, enabling flexible content display and integrating modern AI-IoT technologies. The system is built upon a hardware platform consisting of an IoT board combined with a Jetson nano embedded computer acting as the central controller, utilizing a camera for on-site image acquisition. The smart LED display management and monitoring system is designed to receive data from various sources, including camera data, sensor signals, and data direct input from users either on-site or remotely via the Web interface.
The novel contributions achieved in this article are as follows:
- Propose a smart LED display management and monitoring system architecture for laboratories that applies IoT technology for remote control and monitoring over the network, and AI technology for monitoring and counting the number of people In/Out the laboratory.
- Design an ESP32-based central control board for the smart LED display management and monitoring system and selecting appropriate hardware components, including P2.5 LED modules, HD-A4L card, Jetson nano embedded computer, and Logitech C505eHD camera.
- Propose the algorithm and develop the program for counting people In/Out the laboratory based on YOLOv7 TensorRT inference.
- Develop the Web management program for the laboratory smart LED display system. The Web management program plays a central role in user interaction and data coordination between the LED display system and the image processing system. The Web management program is developed based on the Next.js platform, combining Front-End and Back-End in a unified architecture, and establishes data communication connections with edge computing devices via the MQTT protocol to enable real-time information updates on the LED panels.
In addition to the problem statement presented above, the remaining content of the article is organized into the following parts: Part 2 presents the design of the smart LED display management and monitoring system for laboratories; Part 3 presents the image processing algorithm for counting people entering and leaving the laboratory based on YOLOv7 TensorRT inference; Part 4 details the development of the Web management interface for the smart LED display system; Part 5 presents the experimental results and quality assessment of the system at the Mitsubishi FA laboratory. The final part provides the conclusion and future development directions.
- DESIGN OF THE SMART LED DISPLAY MANAGEMENT AND MONITORING SYSTEM FOR THE LABORATORY
- Proposed System Component Architecture
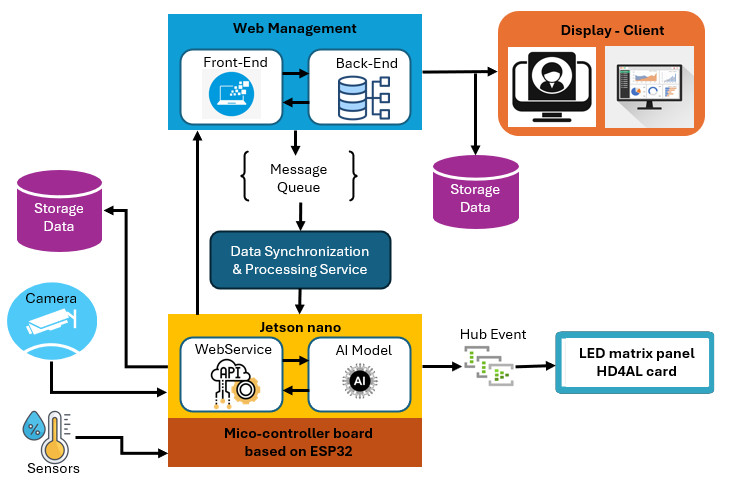
The smart LED display management and monitoring system for the laboratory comprises hardware components and software programs designed to process sensor signals and camera data, as well as to control information displayed on an LED screen with dimensions of 1280x320 mm. The smart LED display management and monitoring system for the laboratory possesses the following primary functions: Displaying device operating status (Indicating whether equipment is active, in standby mode, or experiencing a malfunction); Laboratory safety warnings issuing alerts based on data from room temperature sensors,…; Real-time data updates continuously from sensors located within the laboratory; Remote control via network enabling users to adjust LED display content remotely using computers or mobile phones. The general block diagram of the smart LED display management and monitoring system for the laboratory is illustrated in Figure 1.
Figure 1. Block diagram of the smart LED display management and monitoring system components
The smart LED display management and monitoring system for the laboratory consists of the following main component blocks.
- Central control block: Comprises a central control board based on ESP32 and Jetson nano for signal processing, image processing, communication control, and LED display control. Specifically, the Jetson nano acts as an edge node. it runs a lightly WebService (receiving/sending data via MQTT), executes the AI model (YOLOv7 TensorRT) for people-counting image processing, and connects via LAN to the HDA4L card to drive the P2.5 LED matrix panel. The ESP32-based central control board acts as an embedded controller, IoT node, low-level controller, performing sensor data collection (temperature, humidity, smoke, ...), managing I/O ports, Wi-Fi communication, and sending/receiving data/commands at the device level. The ESP32-based control board and Jesson nano communicate with each other via UART and/or MQTT.
- Electronic display board: Consists of a P2.5 LED matrix and HD-A4L card. The HD-A4L card receives commands and data from the central control block, subsequently performing decoding and controlling the LED matrix display. The P2.5 LED matrix panel displays text, images, and content according to the requested data.
- Surveillance camera: Installed within the laboratory to provide video streams to the Jetson nano. The camera supplies input data for the AI program module to count the number of people In/Out the laboratory.
- Sensors: Collect temperature, humidity, smoke … and transmit signals to the microcontroller board.
- Storage block: Stores display content, system logs, and people counting history (JSON files).
- Worker block: perform periodic tasks, historical data, synchronizing data Web-Jetson-Storage
- Display–Client block: Computers/devices displaying the web dashboard (browser). Operators can observe the current number of people in the laboratory and the content currently displayed on the LED panel.
- Web management block: Comprises the Front-end (Next.js) and Back-end (API + logic processing). This block provides a web interface for users in the laboratory (or remotely) to input display content (text, images, notifications) and monitor the number of people in the laboratory in real-time. The Back-end can save content and people counting history to the storage block.
The system is constructed based on a multi-layer architecture, combining processing at the Web server and processing at the Jetson nano edge device. All components are interconnected via LAN network and the MQTT communication protocol, enabling real-time data exchange. On the operator side, the system provides a Web management block consisting of a Front-end interface (Next.js) and Back-end (API and processing services). This block is responsible for receiving requests for display content input, displaying the number of people in the laboratory, and interacting with the storage area to record activity history.
On the edge computing side, the Jetson nano handles image processing to count people entering and exiting based on collected camera data and controls the P2.5 LED display via the HD-A4L card. The Jetson nano simultaneously deploys a WebService/MQTT client and a deep learning YOLOv7 model optimized by TensorRT. The main component blocks exchange data via MQTT combined with HTTP/API, separated into two distinct data streams: the LED display control stream and the people counting monitoring stream. This architecture allows for a clear separation between the user interface layer, the AI people counting processing layer, and the physical display layer, while leveraging parallel processing capabilities at the edge device.
The separation of the LED display control flow and the laboratory In-Out people counting flow is achieved by splitting them into two subroutines within two apps files, which are then installed on a custom-configured Jesson nano. This allows heavy AI inference tasks to run independently of real-time display tasks, thereby avoiding resource contention, reducing latency, and preventing display errors that could affect counting accuracy. This architecture helps the system maintain stable performance and high reliability even under high display load or traffic, while also increasing system scalability and maintainability can be seen in Figure 2.
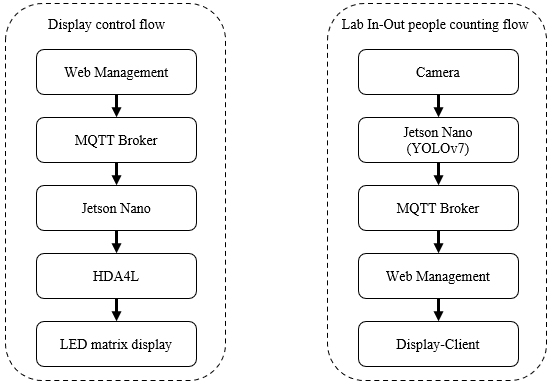
Figure 2. Configuration of data flow separation between the system's main blocks
- Design of the Central Control Board for the Smart LED Display Management and Monitoring System
The central control board is a critical component of the system, ensuring accurate, flexible information display and remote-control capabilities. In this design, the central control board is based on the ESP32, integrated with the Jetson nano and HD-A4L card to display content on the LED display. The functions of the central control board include: capable of connecting to Wi-Fi or 4G networks, allowing data reception and control of LED display content via remote interfaces such as computers or mobile applications; acquiring and processing input sensor signals; communicating with the Jetson nano; outputting control signals to the LED screen; and enabling automatic real-time information display and updates on the LED. The controller design must ensure stability, scalability, and performance optimization for the system to operate effectively under practical usage conditions. The combination of hardware components – the ESP32-based on central control board, Jesson nano, HD A4L card, and LED display panels – allows for simultaneous fulfillment of requirements for space, display capabilities, flexible control, and processing power, thereby demonstrating the suitability and feasibility of the system for practical deployment in a laboratory with low investment costs. The central control board for the smart LED display management and monitoring system in this study is developed based on the ESP32, with the schematic diagram presented in the Figure 3.
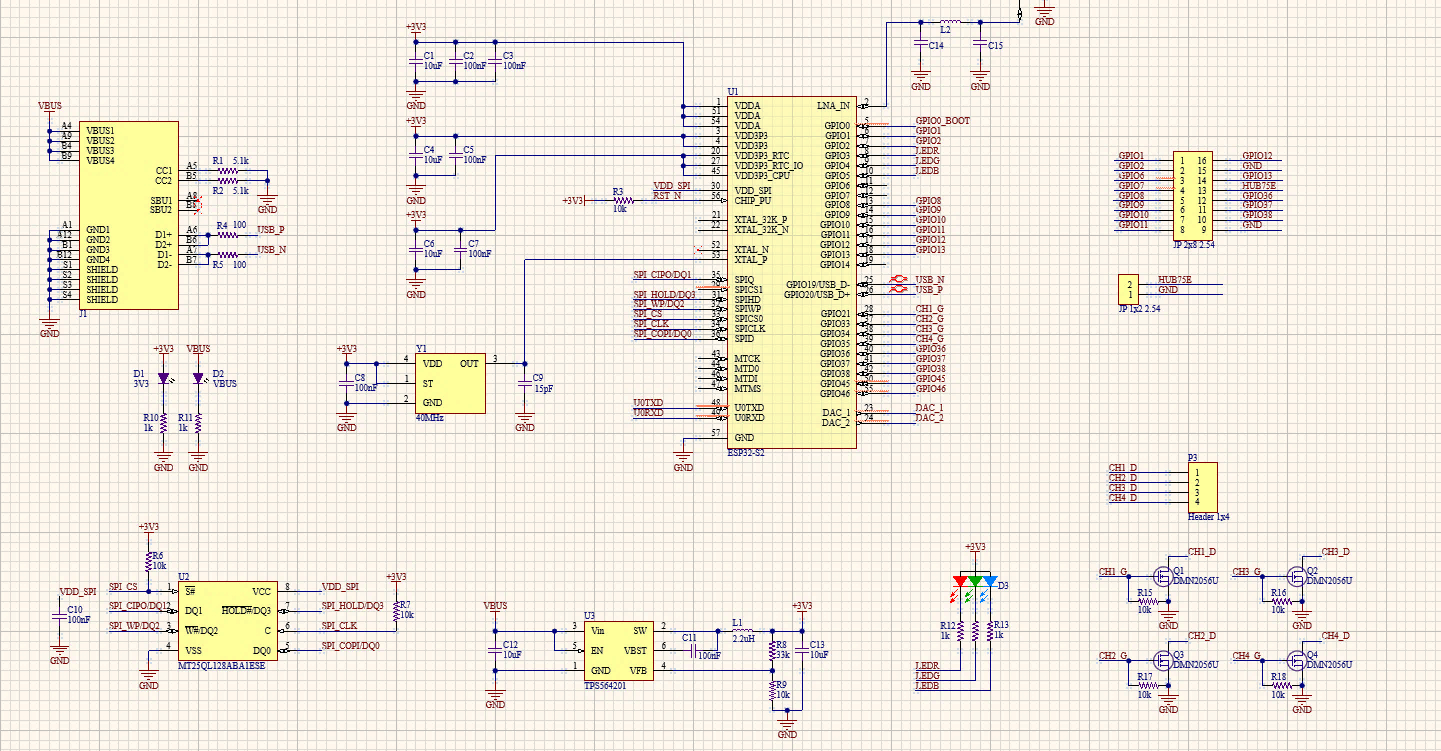
Figure 3. Schematic diagram of the central controller for LED panels
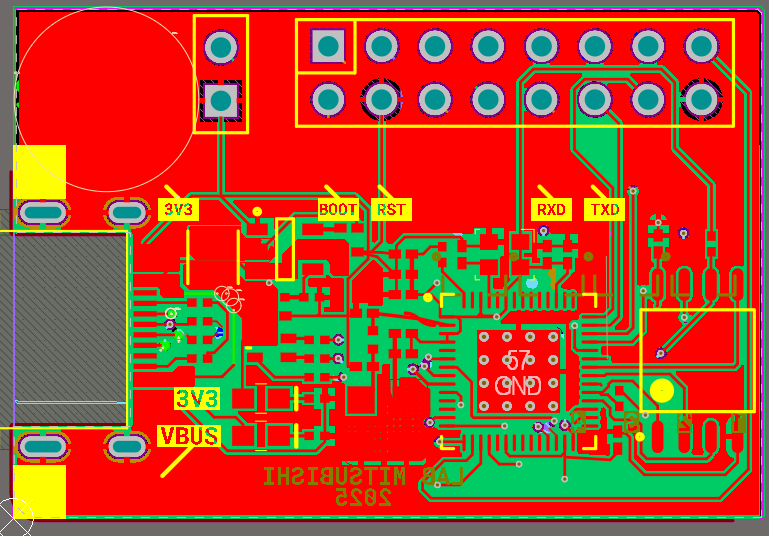
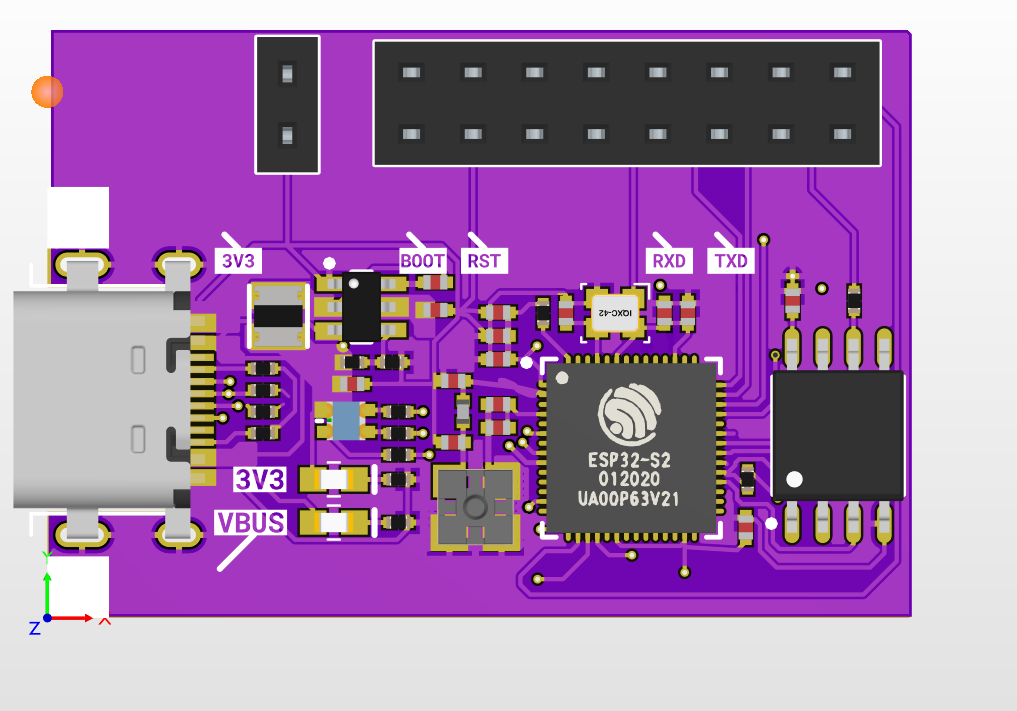
Based on this schematic diagram, the Printed Circuit Board (PCB) for the central control board of the smart LED display management and monitoring system is obtained, as shown in the Figure 4 to Figure 5. The ESP32-based central control board acts as an embedded IoT station node, performing low-level control, sensor data collection, I/O port management. This ESP32-based central control board communicates with Jetson nano via UART and/or MQTT; it integrates closely with Jetson nano – acting as an edge AI device – performing AI inference (Laboratory In-Out people counting), processing high-level logic, and deciding on appropriate LED display content. This creates a comprehensive, scalable, and reliable system architecture with clearly separated functions and low investment costs.
| 
|
Figure 4. The 2D PCB layout of the central controller for LED panels | Figure 5. The 3D PCB view of the central controller for LED panels |
- Selection of Key Components for the Smart LED Display Management and Monitoring System
- Selection of P2.5 LED Modules
The design requires an LED display screen with dimensions of 1280x320mm can be seen in Figure 6. The system utilizes P2.5 LED modules with individual dimensions of 320x160mm. The P2.5 LED display was chosen because of its small pixel pitch and high display density, ensuring clear content and text at short viewing distances characteristic of the laboratory. Its flexible module size allows for easy placement in limited spaces while maintaining aesthetics. Consequently, the configuration requires 4 modules along the horizontal axis and 2 modules along the vertical axis. And the total number of P2.5 LED modules required is 8 modules.
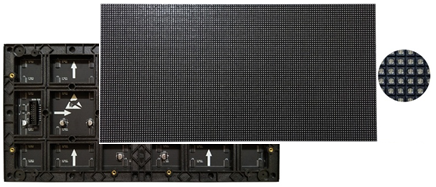
Figure 6. Panels LED P2.5 module
Key specifications of the P2.5 LED module
- Pixel pitch: 2.5mm (distance between pixel centers).
- Module size: commonly 320x160mm
- LED type: SMD 3in1 (Red, Green, Blue).
- Brightness: 600-1000+ CD/m2, adjustable.
- Refresh rate: High (e.g. 1920Hz, 3840Hz+) for smooth, flicker-free images.
- Viewing angle: Wide, around 160° horizontal/vertical.
- Best viewing distance: 2.5m - 25m.
- Scan method: 1/32 scan or higher for better performance.
- Power: DC 5V, low average consumption (e.g., 250-300 W/m²).
- Selection of LED Control Card
In this study, the HD-A4L card is selected as the LED display controller can be seen in Figure 7. The HD-A4L is a versatile LED multimedia player designed for digital signage, providing both offline and online (HDMI) control capabilities, along with diverse connectivity options (LAN, Wi-Fi, USB, HDMI). It operates on a 5V/12V DC power supply. This device manages video, images, and text content via the Android operating system and features cloud and mobile management capabilities. The HD-A4L control card was selected because it meets the system requirements due to its stable LED control, flexible configuration, and convenient network communication. This allows for remote content updates and easy integration with a central management platform, meeting the need for real-time information display in the laboratory environment.
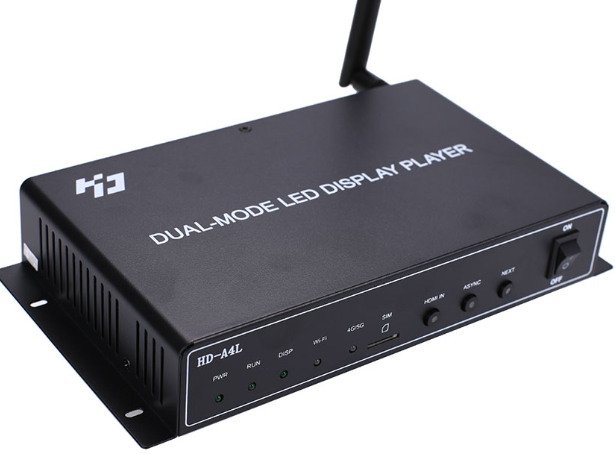
Figure 7. LED display multimedia player HD-A4L
Key specifications of the card HD-A4L
- Control modes: Asynchronous (USB, LAN, Wi-Fi), synchronous (HDMI), cloud management.
- Control range: Max 655360 pixels (16384 wide x 4096 high).
- Content: Video, Pictures, GIF, Text, Tables, Clocks, Weather.
- Video playback: supports 2x4K, 6x1080p, 10x720p streams; formats Mp4, Avi, Mov, Mkv.
- Resolution: Supports up to 4K, 60Hz output.
- Memory: 2GB RAM, 16GB internal storage (expandable via USB).
- Connectivity: Gigabit Ethernet, 2.4GHz/5GHz Wi-Fi, 2x USB (Type-A, OTG), HDMI In, 3.5mm Audio out, Sensor ports.
- Power: DC 5V-12V, low consumption (<18W).
- Selection of Embedded Computer for Image Processing
The image processing device selected for this study is the Jetson nano can be seen in Figure 8. The Jetson nano enables image processing, recognition, and the counting of people entering and exiting the laboratory using the image processing program developed in this research. Jetson nano was chosen because it provides sufficiently powerful AI processing capabilities for computer vision tasks such as people detection and counting, while its compact size, low power consumption, and reasonable cost make it ideal for deploying Edge AI in the laboratory without requiring a large server infrastructure.
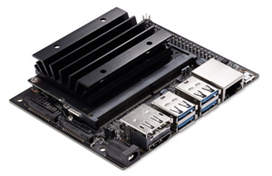
Figure 8. Jetson nano developer kit
The main specifications of the Jetson nano are as follows:
- CPU Quad-core ARM Cortex-A57 @ 1.43 GHz,
- GPU NVIDIA Maxwell architecture với 128 CUDA cores,
- AI performance: 472 GFLOPS (FP16), TensorRT, cuDNN, OpenCV, DeepStream.
- Memory: 4 GB 64-bit LPDDR4,
- Storage: 16 GB eMMC 5.1
- Connectivity and I/O: Gigabit Ethernet, 1xUSB3.0, 3xUSB 2.0, 1x4 PCIe Gen2, Display- HDMI 2.0, DisplayPort 1.2, eDP 1.4, Camera -12 lanes MIPI CSI-2, GPIO, I²C, I²S, SPI, UART
- Power: 5-10W
- Selection of Camera
In this system, the Logitech C505e HD camera is selected to facilitate monitoring and to count individuals entering and exiting the laboratory. The basic specifications of camera Logitech C505e HD
- Video: Resolution HD 720p widescreen video, 60° diagonal field of view along with HD 720p/30 fps resolution, Fixed focus, Right light 2 auto light correction.
- Connectivity: USB-A plug and play USB cable up to 2 meters.
The Logitech C505e camera was chosen because it provides stable image quality and HD resolution sufficient to meet the YOLOv7 human detection requirements in the laboratory, maintaining accurate bounding box and reducing errors in tracking and counting people. It also offers good compatibility with Jetson Nano via USB plug-and-play, requiring no complex driver installation, enabling quick deployment, reduced integration costs, and increased operational reliability.
- DEVELOPMENT OF AN IMAGE PROCESSING PROGRAM FOR COUNTING PEOPLE ENTERING AND EXITING THE LABORATORY
To execute image processing functions and count the number of people entering and exiting the laboratory, the smart LED display management and monitoring system is equipped with Jetson nano quad-core ARM Cortex-A57 hardware and a Logitech C505e HD Webcam, with technical specifications as detailed in Part 2. The camera is tasked with monitoring and acquiring video footage of individuals entering and exiting the laboratory, subsequently transmitting this data to the Jetson nano. Upon receipt, the Jetson nano processes the data by executing the AI model developed in this study to detect and count the number of people entering and exiting the laboratory. The image processing program for counting people is organized into specific sub-modules, comprising: the image acquisition and pre-processing module, the inference module using the YOLOv7 TensorRT model, the post-processing module, and the people counting module.
- Image Acquisition and Pre-processing Module
The image pre-processing module utilizes OpenCV to continuously capture frames from the connected camera at an appropriate frame rate (approximately 10–20 fps). Each frame undergoes the following pre-processing steps:
- Conversion of the color space from BGR to RGB.
- Resizing to match the input dimensions required by the YOLOv7 model (640×640).
- Normalization of pixel values to the range [0,1] and reformatting of the tensor as required by TensorRT.
- Inference Module with YOLOv7 TensorRT Model
The YOLOv7 model is pre-trained/fine-tuned, subsequently converted into the TensorRT engine format. The inference module loads this TensorRT engine into the GPU of the Jetson nano to perform calculations for each pre-processed frame. The inference results include a list of bounding boxes, confidence scores, and class labels for each detected object.
- Image Post-processing Module
The post-processing module filters bounding boxes labeled "person" with a confidence score exceeding a predefined threshold (set at 0.8). Non-maximum suppression (NMS) algorithms are applied to eliminate duplicate bounding boxes. The image processing module is organized as a continuous loop; however, the interval between inference cycles can be configured to balance processing speed and system resources.
- In/Out People Counting Module
The objective is to count the number of people entering and exiting the laboratory in real-time. Input data consists of a video frame sequence from a camera positioned facing downward towards the laboratory entrance. Each frame undergoes a processing chain: OpenCV pre-processing, human detection inference using the TensorRT-optimized YOLOv7 model, followed by multi-target tracking to maintain trajectory identity. In-Out event recording is based on a line-crossing rule within a fixed Region of Interest (ROI), thereby minimizing noise outside the doorway area.
- Geometric Processing Principles for Counting People Entering and Exiting
In the image coordinate system, a counting line  is established parallel to the laboratory door threshold. For each tracked human target with a specific ID, the representative point is defined as the "foot" of the bounding box (the coordinates of the midpoint of the bottom edge) at time step k denoted as
 . The "line crossing" event is registered when the sign of the relative position of
  with respect to changes between two consecutive samples, and the displacement exceeds a minimum threshold within a corridor of width d surrounding the line, this mechanism is implemented to eliminate jitter or fluctuations near the line edge. The direction of movement is determined by the motion vector
  relative to the line's normal vector; Movement of a target from outside the Region of Interest (ROI) to the inside is labeled as "In", while movement in the opposite direction is labeled as "Out". Each unique ID is recorded for a maximum of one event per crossing instance, utilizing an "already counted" flag mechanism and a debouncing cycle based on a fixed number of frames can be seen in Figure 9.
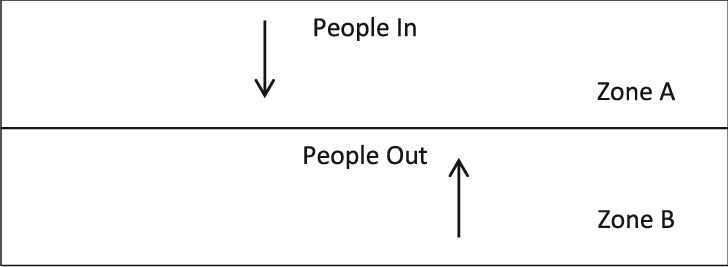
Figure 9. Illustration of the laboratory In/Out counting zone
- Relative position with respect to the counting line

The signed distance from point to line is calculated along the normal vector:
| 
| (1) |
Sign of the relative position:
| 
| (2) |
 = +1: The point lies on one side of the counting line (inside the ROI). = -1: The point lies on the opposite side of the counting line (outside the ROI). = 0: The point lies exactly on the counting line (rare due to fragmented images).
Condition for "crossing the line" within corridor  . The counting corridor of thickness (width) d surrounding the line is described by:
| 
| (3) |
Between two consecutive frames (k -1) and k, the "crossing the line" event of the id is only accepted if it simultaneously satisfies the following conditions:
- Change in sign of relative position (moving from one side to the other):
| 
| (4) |
- Minimum displacement to eliminate small oscillations (jitter) near the edge:
| 
| (5) |
- Located within the corridor surrounding the line in at least one of the two samples:
| 
| (6) |
- Determining In/Out direction
Displacement vector between two frames:
| 
| (7) |
Displacement component along the normal direction:
| 
| (8) |
If  < 0: Movement is from outside to inside the ROI (labeled In). If > 0: Movement is from inside to outside the ROI (labeled Out).
Furthermore, by knowing the number of people entering and exiting the laboratory, we can also estimate the number of people present in the laboratory in real-time. Let In(t) and Out(t) be the number of entries and exits recorded in the time interval  . The quantity of people present (Occupancy) at time t is updated according to the difference equation:
| 
| (9) |
The value  is initialized according to the initial state (default is 0 or as confirmed by the operator). To limit accumulated drift due to counting errors, the system allows for scheduled re-calibration (e.g., at midnight) or upon manual confirmation can be seen in Figure 10.
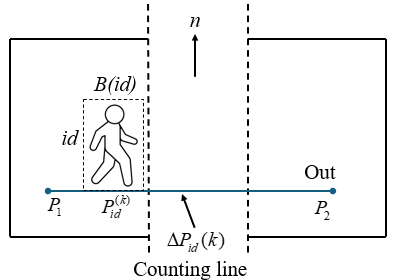
Figure 10. Determination of the direction of people entering and exiting the laboratory
- Algorithm for Counting People Entering and Exiting
At each sampling instance, the process initiates by acquiring a frame from the camera. Subsequently, the image undergoes BGR-to-RGB color space conversion, resizing to the model's input dimensions of 640x640 pixels, and pixel value normalization. The pre-processed frame is fed into the YOLOv7 TensorRT engine; the output consists of a set of bounding boxes accompanied by class labels and confidence scores. Detections labeled "person" are retained, and Non-maximum suppression (NMS) is applied to eliminate duplicate detections. The detection results serve as input observations for the tracking module (utilizing DeepSORT) to assign and maintain stable identities (IDs) for each individual over time. For each active trajectory, the system updates the new foot point coordinates and evaluates the conditions for crossing the corridor surrounding the counting line, verifying the change in side and ensuring the minimum displacement speed is met. If these conditions are satisfied, an "In" or "Out" event is recorded, and the total entry count In(t), exit count Out(t), and current occupancy Occ(t) are upadated. Periodic updates occur every  t (1–2 seconds) or immediately upon a state change, the variables In, Out, Occ along with timestamps, are transmitted to the LED display. Simultaneously, event records (containing Track ID, In/Out status, people count, and timestamp) are archived in a log file.
Regarding error control, in cases of temporary tracking loss due to brief occlusion, the identity is maintained via a Time-To-Live (TTL) parameter spanning a specific number of frames. If the TTL expires without a matching observation, the trajectory is terminated without generating a false event. Furthermore, in the event of an interruption in the Jetson's connection to the camera or the broker, the process automatically attempts to reconnect and logs the intervals of data loss. Here is the Pseudo-Code for implementing the proposed algorithm for counting the number of people In/Out the laboratory.
Proposed Algorithm for Laboratory In-Out counting based on YOLOv7 TensorRT inference |
1: Load TensorRT engine E_trt (FP16/INT8), set conf_thres, nms_thres 2: Initialize camera and MQTT client (topic "vms1/countPeople") 3: While system is running do 4: Capture a frame I from the camera 5: Pre-process: resize + letterbox to (W, H), normalize, form tensor X 6: Run inference: Z = E_trt(X) 7: Decode all anchors: obj = σ(obj_p), p_i = σ(c_{i,p}), score_i = obj · p_i, x, y, w, h from (x_p, y_p, w_p, h_p) as Algorithm Training YOLOv7 [x] 8: Filter detections: keep boxes with max(score_i) ≥ conf_thres 9: Apply class-wise NMS with IoU threshold nms_thres 10: Count number of boxes with class = "person": count_people++ 11: Publish count_people via MQTT on topic "vms1/countPeople" 12: (Option) draw bounding boxes on frame I and display 13: End While |
- DEVELOPMENT OF THE WEB MANAGEMENT PROGRAM FOR THE SMART LED DISPLAY MANAGEMENT AND MONITORING SYSTEM FOR THE LABORATORY
The Web management block plays a central role in user interaction and data coordination between the display system and the image processing system can be seen in Figure 11. It is developed based on the Next.js platform, integrating both the Front-end and Back-End within a unified architecture. The Web management block operates according to a sequential process initiating with application startup. Upon user access, the system first reads necessary configuration information, including the laboratory identifier (LabID), MQTT broker address, communication topics, and a list of default effects and colors.
After configuration, the system proceeds to initialize the user interface with main menus such as Dashboard, Display control, History, and Configuration. Simultaneously, initial state variables are established with the current people count set to 0. Subsequently, the system establishes a connection to the MQTT broker via the WebSocket. Upon successful connection, the system subscribes to receive information from topics, specifically the people counting topic, and transitions into an event loop operational mode. Within this loop, the system continuously processes two parallel data streams: The first thread is to handle user operations on the interface such as viewing dashboard, controlling display, viewing history or changing configuration. When the user wants to send a control command, the system will check the validity of the data before packaging it into JSON format and sending it to the Back-End or publishing it directly to MQTT.
The Web management block also processes MQTT messages received from the people counting system. Whenever there is a new message about the number of people, the system will analyze the data, update the current status and add it to the history, then automatically update the Dashboard interface so that users can see the latest information. Throughout operation, the system continuously monitors the MQTT connection status. If a disconnection is detected, the system updates the interface to notify the user and automatically attempts to reconnect. Finally, when the user closes the application, the system performs cleanup operations, such as disconnecting MQTT and releasing resources, before terminating completely.
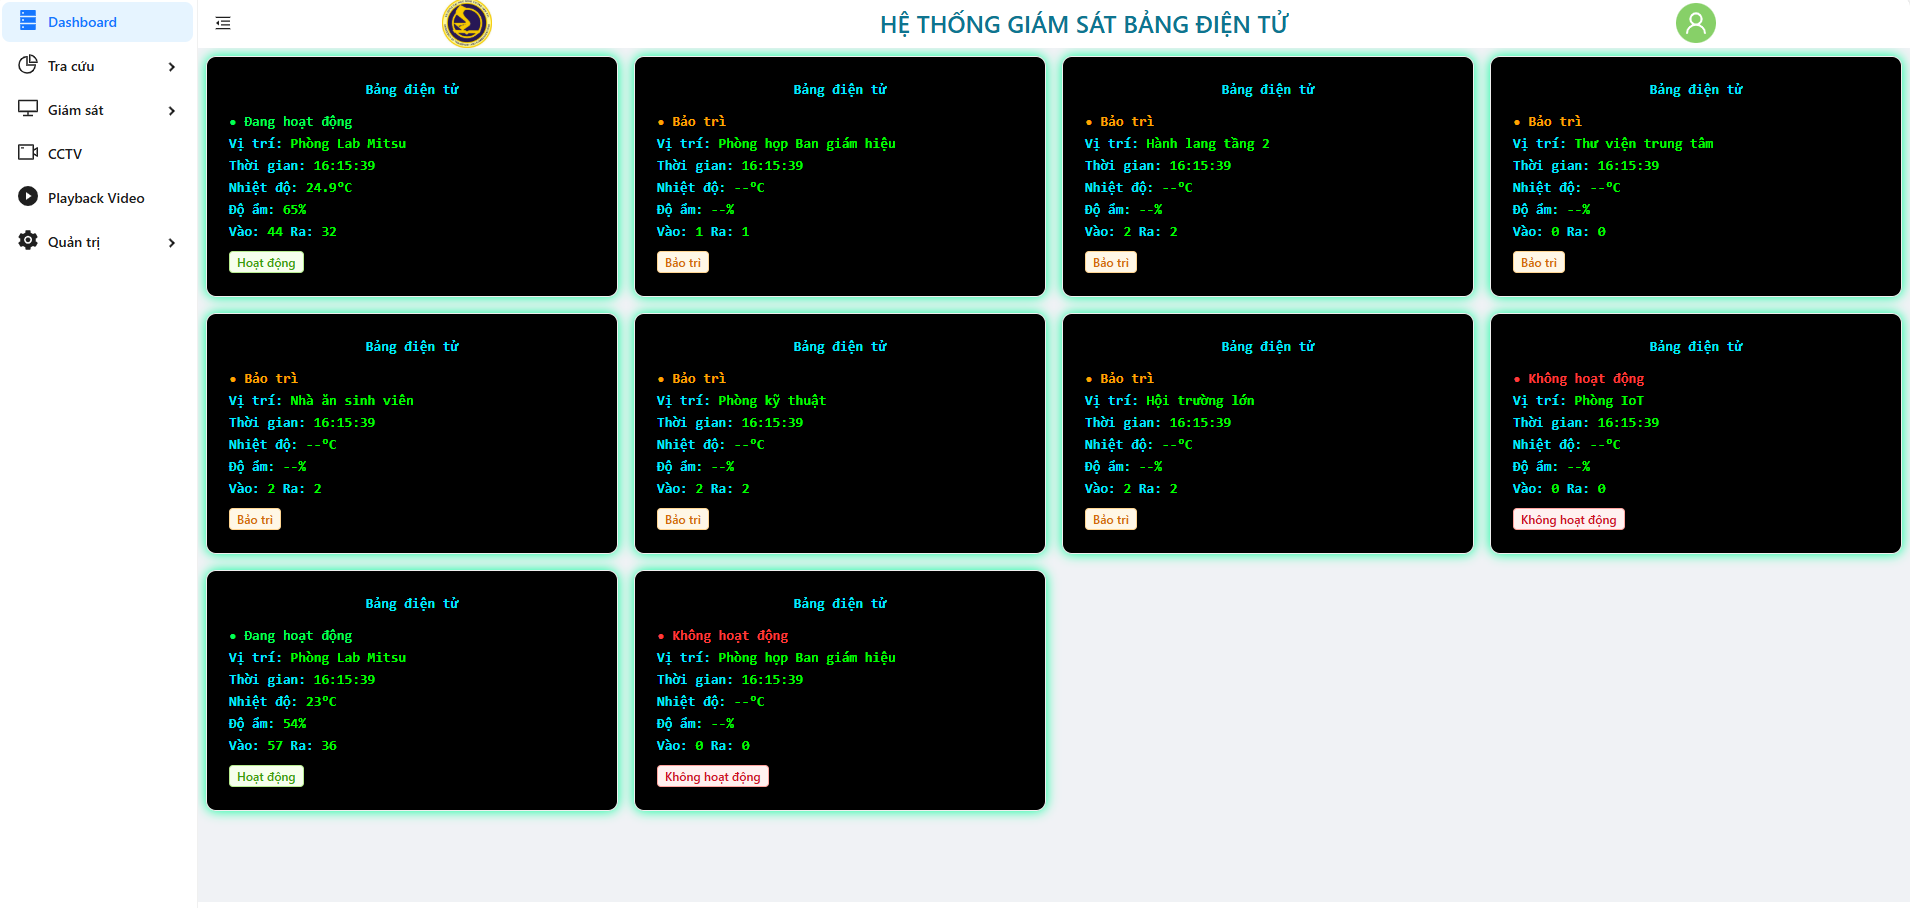
Figure 11. Web dashboard management for configuring LED panels
- Front-End Functions
The Front-end is built on React/Next.js, operating primarily on the client-side (browser), and is responsible for the following functions:
- Displaying Functional Screens:
- Display control window: Allows for text input, color selection, and selection of images from the available background library.
- People monitoring window: Displays the current number of people and basic statistical information of the electronic LED panels.
- Basic configuration window (if applicable): Laboratory information, connection parameters, warning thresholds.
- Organization based on Component Architecture:
- Each interface area (content input form, people count display card, charts, menu bar) is encapsulated into an independent React component.
- Shared components (buttons, input fields, dialog boxes) are reused across multiple pages to ensure interface consistency and ease of maintenance.
- State Management:
- Local State is used for simple interactions (e.g., form input, color selection).
- For real-time data (people count, connection status), the Front-End utilizes a global state management layer to ensure related components are updated synchronously.
- JSON Data Processing:
- The Front-End receives and generates JSON objects according to the system's common standard (display_info, people_count_data).
- Data is constructed and validated before transmission to minimize errors at lower layers.
By leveraging Next.js server-side rendering (SSR) capabilities for static pages, the interface ensures fast loading speeds and user-friendliness, while dynamic (real-time) components are updated via MQTT/ WebSocket on the client side.
- Back-End Functions
The Back-End of the Web management block is implemented utilizing Next.js API Routes, encompassing the following primary functions:
- Processing Logic Related to Display Content:
- Receives requests from the Front-End (including text content, visual effects, and display configurations).
- Standardizes data and appends metadata such as laboratory information, creation timestamp, and operator identity (if available).
- Archives records to storage (JSON files or databases) to ensure historical traceability.
- Processing People Counting Data:
- Receives people counting messages from the Jetson nano (via the MQTT bridge).
- Stores data and provides APIs enabling queries based on time intervals, facilitating charting and analytical tasks.
- System Configuration Management:
- Maintains shared configuration information: MQTT broker address, laboratory lists, and device specifications.
- Provides APIs allowing the user interface to read/write configurations as necessary.
- Basic Security and Authorization:
- Authenticates users accessing administrative functions.
- Segregates privileges between viewers and operators.
By leveraging Next.js's “full-stack” model, Front-End and Back-End are placed in the same project, simplifying deployment and synchronizing data types (types, schemas) between the two sides.
- User Interface Design
The design of the Web management interface for the smart LED display system focuses on simplicity and intuitiveness to serve effective monitoring. It prioritizes minimizing the steps required to display a notification. Error messages and warnings are presented clearly to enable rapid recognition by operators.
- Overall layout:
- Navigation bar area (top or left): Includes dashboard, display control, history, and configuration.
- Central area: Displays the main content of each specific function.
- Status bar area: Indicates MQTT connection status, Jetson nano status, and current people count.
- Display control interface:
- Features a concise content input form with clearly marked mandatory fields.
- Parameters such as color, font size, and background color are presented as selection lists (dropdowns, radio buttons) to minimize input errors.
- Includes a "preview" area simulating the LED display to help operators visualize results before sending commands.
- People counting monitoring interface:
- The current people count is displayed as a "big number" for easy long-distance observation.
- Adjacent charts or timelines show people count variations, supporting the assessment of laboratory usage levels.
- Warning colors (e.g., turning red) can be implemented when the count exceeds configured thresholds.
- MQTT Integration in Web Management
The Web management block establishes data communication with edge computing devices via the MQTT protocol. This ensures timely data updates and satisfies the system's real-time requirements. Figure 12 illustrates the data linkage between the Jetson nano edge device and the Web application.
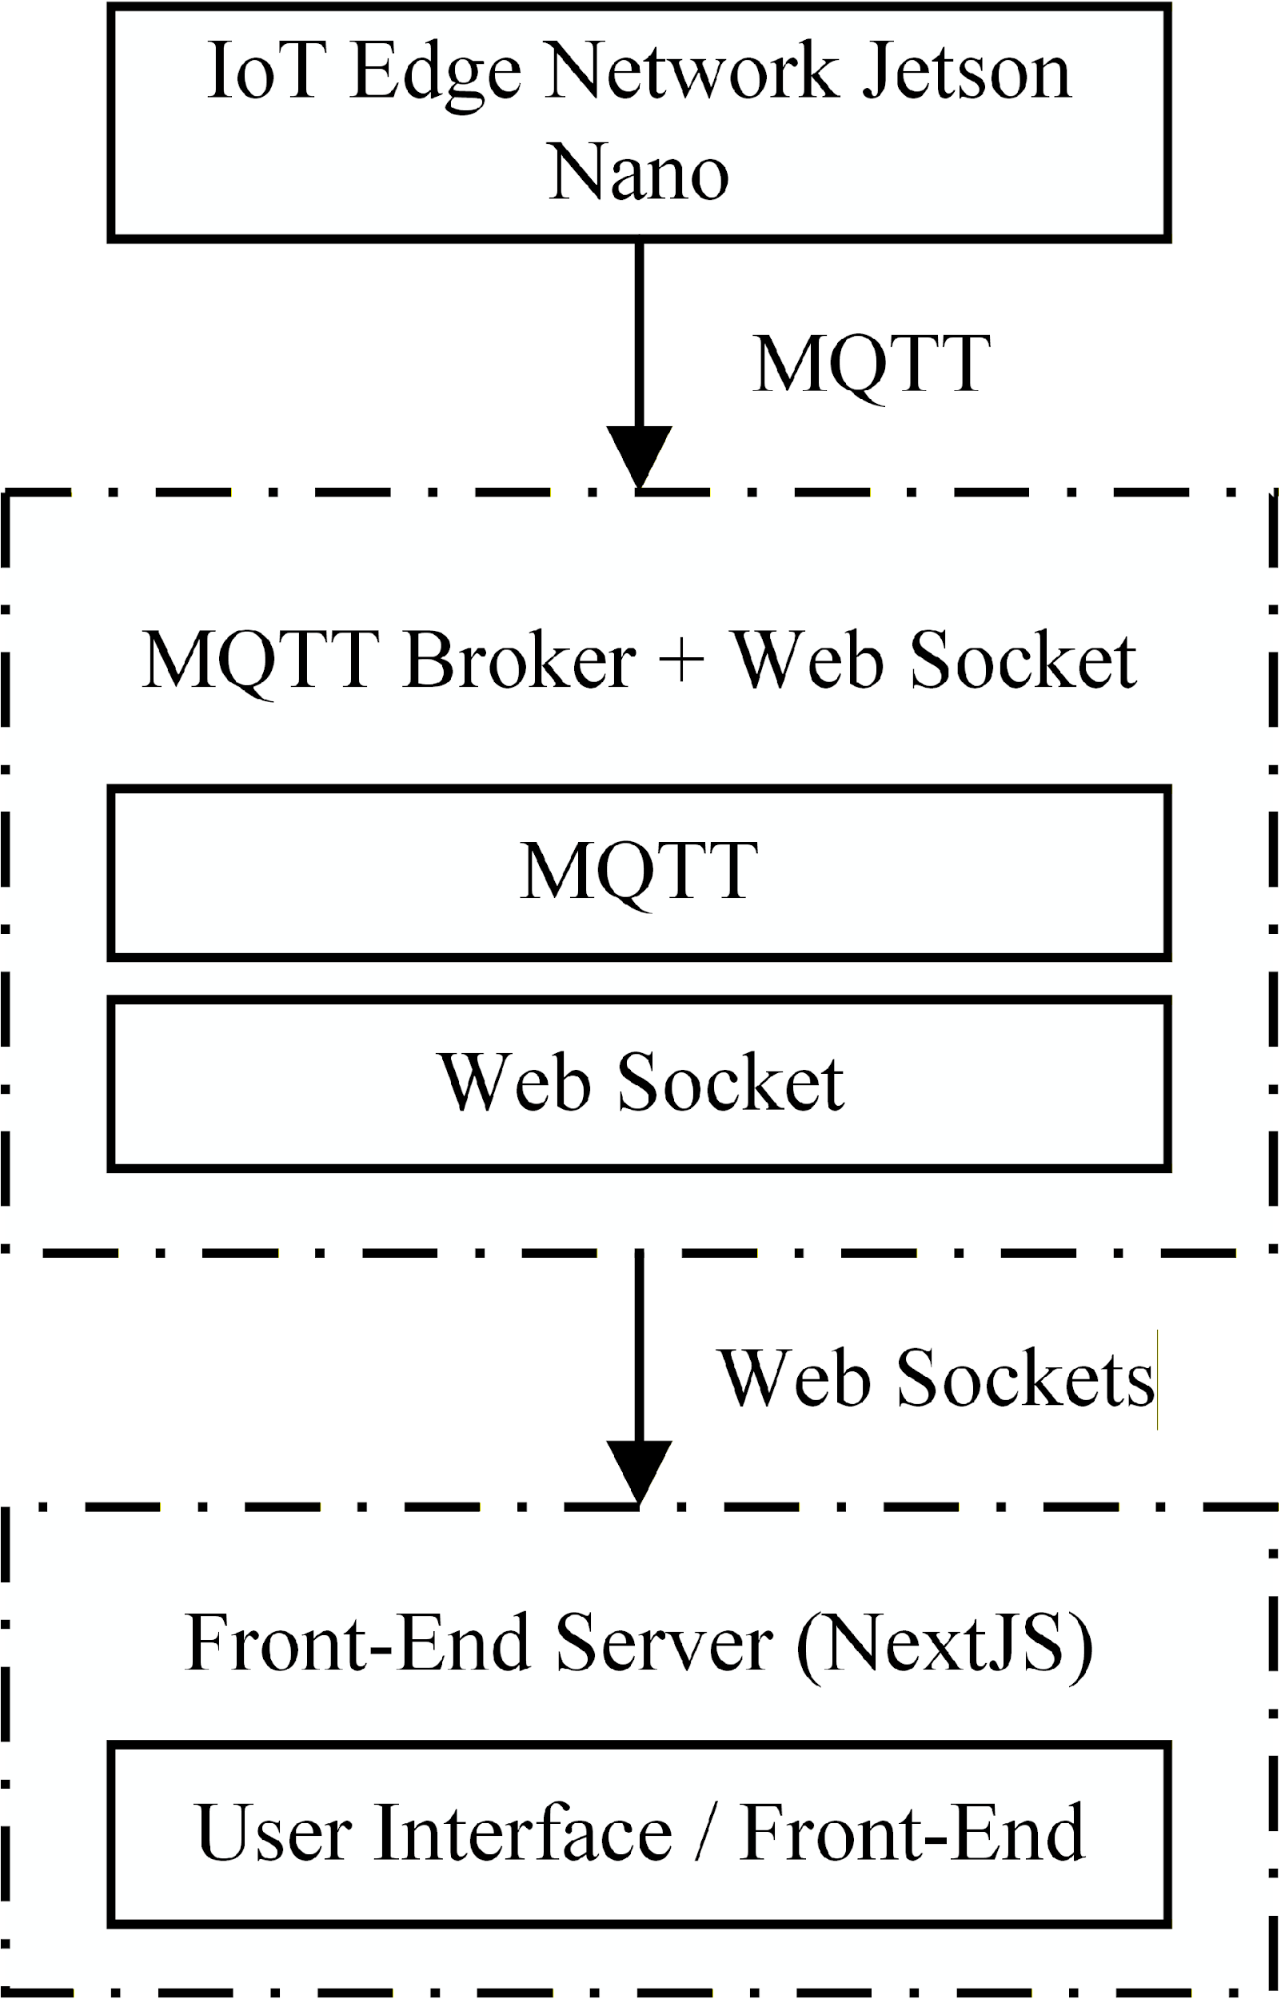
Figure 12. MQTT integration linking the Edge device and the Web application
The integration of MQTT is designed according to the following principles:
- MQTT Connection from The Front-End
- The web application utilizes an MQTT client via the WebSocket protocol to establish a connection with the MQTT Broker.
- Upon connection, the application subscribes to necessary topics, typically lab/people_count- to receive people counting data from the Jetson nano.
- When a user initiates a display command, the Front-End or Back-End publishes a message to the lab/display topic.
- Publish/Subscribe Model within Web Management
- Interface components do not interact directly with sockets but rather through a shared "MQTT service" layer. This layer is responsible for establishing, maintaining, and restoring connections in case of interruption; converting MQTT messages into JavaScript/JSON objects; and updating the state.
- Consequently, the remainder of the application operates solely on standardized data, avoiding dependency on specific protocol details.
- Error Handling and Connection Status
- The application monitors disconnection and reconnection events, reflecting them directly on the interface (e.g., the "Connected/Disconnected" icon in the corner of the window).
- In the event of an MQTT disconnection, the application temporarily disables the display command transmission button to prevent generating commands that cannot be successfully sent to the control device.
- Scalability
- Topics are designed to include a lab_id, allowing for future expansion to multiple laboratories or various LED boards without requiring changes to the Web architecture.
- Integrating MQTT as a shared service facilitates the easy addition of new message types (e.g., sensor data, other warnings) by simply adding the corresponding subscriber.
With this design, the Web management block serves not only as a user interface but also as an intermediate node coordinating information between the operator, the AI system on the Jetson nano, and the LED display board, ensuring data consistency and real-time responsiveness.
- EXPERIMENTATION OF THE SMART LED DISPLAY MANAGEMENT AND MONITORING SYSTEM FOR THE LABORATORY
- Installation of the Smart LED Display Management and Monitoring System at the Mitsubishi FA Laboratory
The installation of the smart LED display management and monitoring system was conducted at the Mitsubishi FA laboratory at UTC, comprising the components illustrated in Figure 13. The specific components and devices are as follows: (1)-LED matrix panels; (2)-Network equipment cabinet and HD-A4L card for controlling data display (video, images, text, ...) on the LED panels; (3)-Jetson nano control cabinet and central control board; (4)-Web management program running on the computer; (5)-Logitech C505eHD camera installed under the laboratory door frame to count the number of people In/Out the laboratory. The system is designed within a unified architecture, integrating the LED control Web management program and AI Edge devices processing for real-time people In/Out counting. It incorporates standardized MQTT/JSON communication, feedback loops, and professional operational metrics (median/p95, ID-switch), allowing for rapid deployment, competitive pricing, and easy scalability for managing multiple laboratories.
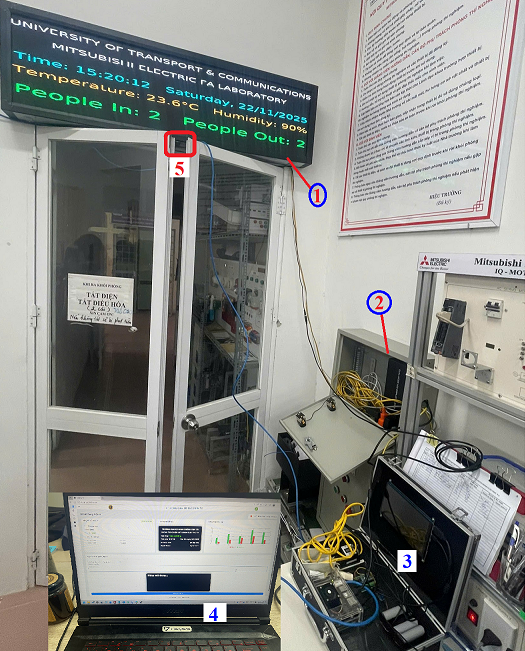
Figure 13. Installation of the smart LED display management and monitoring system at the Mitsubishi FA laboratory
- Experimental Results of the Laboratory People Counting Algorithm
The testing of the proposed algorithm for counting the number of people entering and exiting the laboratory was conducted on Jetson nano hardware, utilizing real-world data collected from the Logitech C505eHD camera installed at the laboratory entrance. The testing process for the people counting algorithm was conducted under three different scenarios: Scenario 1: Normal In/out flow with normal lighting. Scenario 2: Crowded In/out flow with potential trajectory intersections and normal lighting. Scenario 3: Normal In/out flow with variable lighting conditions. Initialization of the ROI (blue color) and counting line (yellow color) is aligned with the door position; the displayed FPS ranges from ~10.5 to 10.9, with an inference time (Inf) of ~59 ms per inference (using the TensorRT engine) can be seen in Figure 14.
The overlay results align with the logic of the "detection – tracking – line crossing" algorithm. Error rates increase in test scenarios involving intersecting paths or lighting variations due to ID-switching and confidence fluctuations. Parameters such as a corridor of ±12px, minimum displacement of 10px, and a Time-To-Live (TTL) of 15 frames significantly reduced over-counting and under-counting can be seen in Figure 15. In/Out counting accuracy was evaluated based on the number of correct counts compared to ground truth labels in standard recording sessions. The accuracy metric is defined as follows:
| 
| (10) |
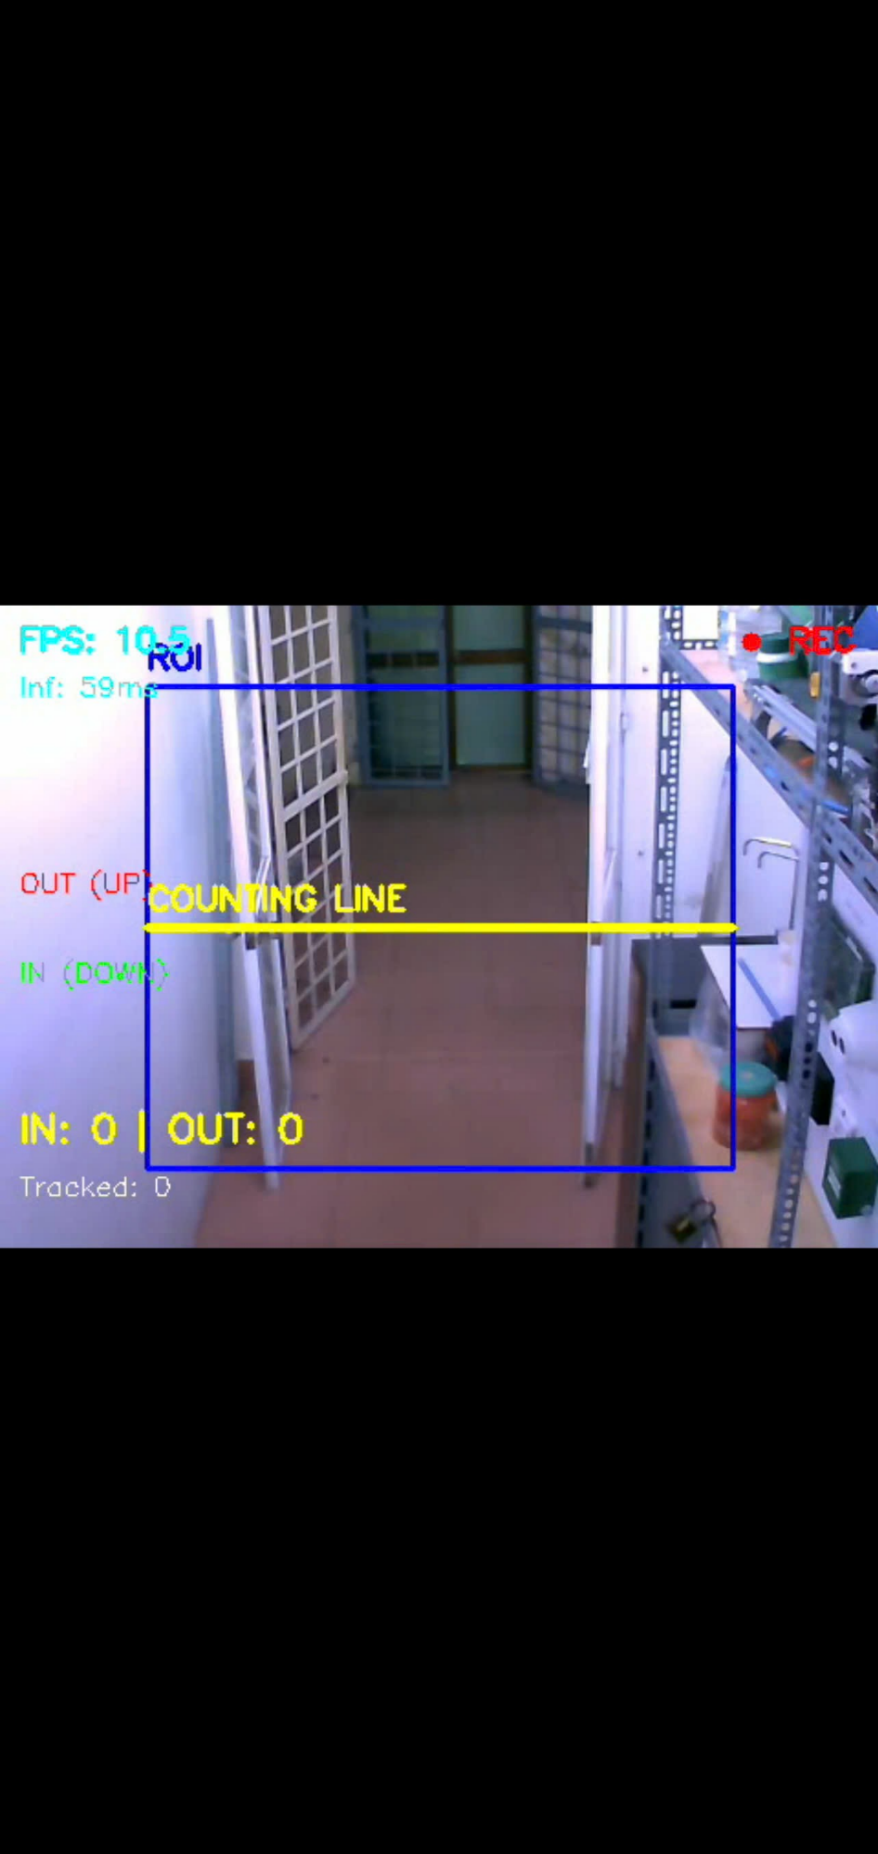
Figure 14. ROI & Counting line frame prior to target detection
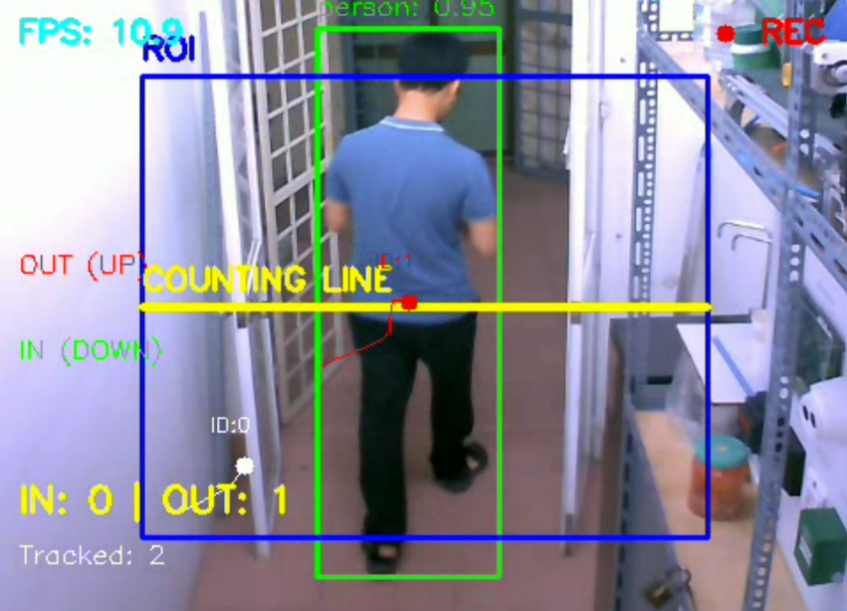
Figure 15. Detection overlay, trajectory & line crossing events
For occupancy (number of people present), errors are reported using Mean Absolute Error (MAE) and Root Mean Square Error (RMSE) between the estimated  and the actual count during the testing period. Additionally, end-to-end latency (from frame capture to Web display) and inference speed (FPS) on the Jetson nano are two critical performance metrics. The Table 1 provides measurement results for 30-minute sessions per scenario. In cases of crowding or prolonged occlusion, the system also records the ID switch rate as an indicator of tracker stability.
Table 1 shows that the laboratory In-Out people counting accuracy consistently remained above 90% in all three scenarios (95.8%, 90.6%, 92.1%). In scenario 2 (crowded, intersection), performance decreased with FPS dropping from 16.2 to 13.1, latency increasing from 420ms to 560ms, and ID-switch increasing by 4.7%, but the system still achieved 90.6% accuracy. The errors arising from prolonged obstruction or people standing still near the counting line are directly related to the chosen system configuration: the counting corridor width (corridor ±12 px) helps eliminate spurious oscillations when objects move close to the edge but can slow event recording when objects stop for a long time in this area, while TTL=15 frames allows for maintaining identification during short obstructions but still leads to track termination and increased ID-switch if the obstruction time exceeds the allowed threshold.
Table 1. Accuracy of counting people In/Out & number of people present Occ
Scenario | FPS average | Delay end-to-end | Accuracy  | MAE  | RMSE Occ | ID switch |
Scenario 1 | 16.2 | 420ms | 95.8% | 0.6 | 0.9 | 1.2% |
Scenario 2 | 13.1 | 560ms | 90.6% | 1.3 | 1.8 | 4.7% |
Scenario 3 | 12.4 | 640ms | 92.1% | 1.1 | 1.6 | 3.1% |
Experimental results with the proposed algorithm demonstrate fast and accurate human detection, even when multiple individuals appear simultaneously. It accurately tracks individual movement across frames, assigns unique IDs to each object, and avoids duplicate counting when individuals move slowly or stand still. This ensures the system maintains high accuracy, achieving over 90%. Errors primarily occur when individuals occlude each other or remain stationary within the counting corridor for extended periods. The use of a finite-thickness corridor and minimum displacement conditions helps eliminate false fluctuations caused by image jitter. Tracking techniques with re-identification (re-ID) reduce ID switching during short occlusions; for long occlusions, selecting a downward-angled camera position and a sufficiently wide ROI are decisive factors. The mechanism of scheduled recalibration and manual confirmation helps eliminate accumulated drift during long-term operation without affecting the real-time experience. This indicates that the proposed algorithm/ program meets the practical requirements for the laboratory management and monitoring.
The system operation testing revealed the performance results of the Jetson nano, HD-A4L, and LED P2.5 devices as shown in the Figure 16. The Jtop parameter results for the Jetson nano show GPU usage at a high level ~80–98%, clock speed at ~921MHz, CPU usage fluctuating with tracking load, GPU temperature remain safe ~38–50°C, CPU temperature remain safe ~41–51°C, no throttling was observed and system-wide power consumption at ~6.7–7.8W, and the MQTT daemon and Python inference processes remained stable. This demonstrates that the proposed hardware system achieves good energy efficiency, and confirms that the hardware is suitable, operates stably, and is durable for the AI-IoT pipeline under real testing conditions.
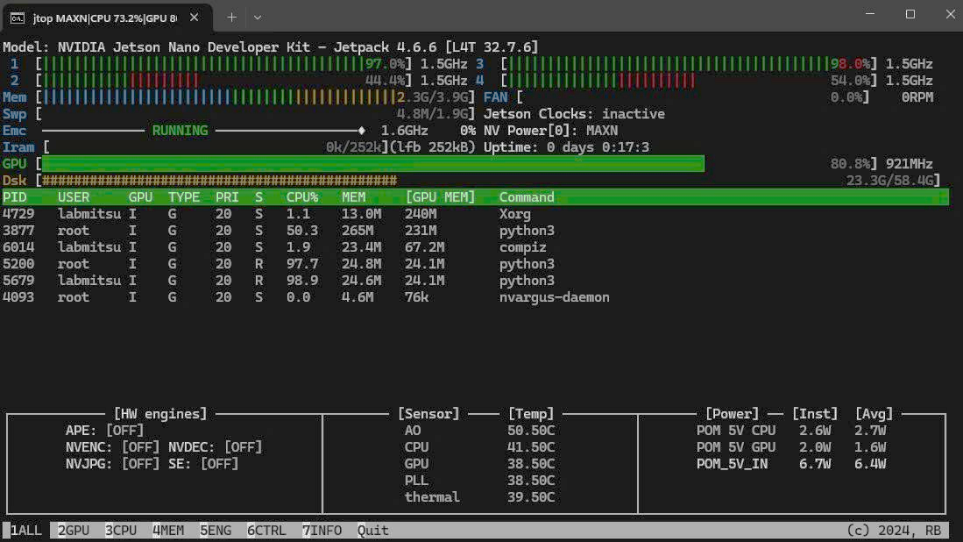
Figure 16. Jtop – Jetson nano system load during inference
Some real-world LED display results at the Mitsubishi FA laboratory are described in Figure 17, consisting of the following main information fields: laboratory information & status, current time (hour, date), room temperature/humidity, and the number of people entering/exiting the laboratory. The display pipeline achieves a latency of under 0.65s ( ) even with images included; the Jetson nano maintains 9-15 FPS with safe temperatures and low power consumption; the HD-A4L successfully receives and applies the program can be seen in Table 2.
Figure 17. Result of laboratory information & In-Out people count display on the LED panel
Table 2. System hardware performance evaluation
Index (HW) | Scenario 1 | Scenario 2 | Scenario 3 |
FPS Inference (YOLOv7-TRT) | 16.2 | 13.1 | 12.4 |
Temperature GPU (°C) | 60 | 63 | 64 |
Estimated Power (W) | 7.8 | 8.5 | 8.7 |
Successful MQTT Publish (Jetson→Broker) | 100% | 100% | 100% |
LatencyWeb→LED (text) median/p95 | 310/520 ms | 320/540 ms | 330/560 ms |
LatencyWeb→LED (128×128) median/p95 | 390/640 ms | 410/660 ms | 420/680 ms |
Display updated/OK (HDA4L) | 100% | 100% | 100% |
- Results of Web Management Interface Development for Monitoring LED Panels
The web interface layout is organized in an intuitive grid format, clearly separating the status monitoring area, the LED content preview area, and the control configuration block. This allows operators to quickly grasp important information and perform operations with minimal steps. This layout effectively supports real-time management and reduces errors during display configuration. The web interface windows display the status of each board: active (green), maintenance (yellow), and inactive (red). Each tag provides location, system time, temperature/humidity, and real-time In/Out people counters. All data tags are updated via MQTT/WebSocket on the web interface, assisting managers in effectively operating and monitoring the system can be seen in Figure 18. The left-side functional group displays Jetson nano status (CPU temp, RAM, uptime, FPS); the middle functional group is the P2.5 LED board preview (512×128 px) simulating actual content; the right-side functional group shows the graph of people entering/exiting per minute; and the bottom functional group is the configuration form for content (text/image/effects) and font size settings.
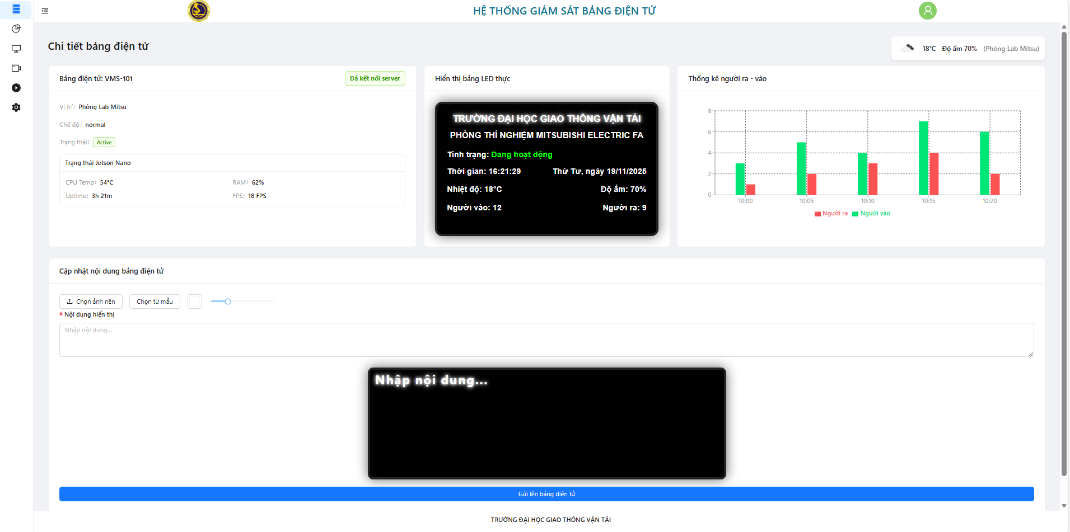
Figure 18. Web interface displaying information of the smart LED display management and monitoring system
The system supports a background image library and provides a live preview prior to finalizing the configuration. The preview command demonstrates that the background content is accurately applied in the preview and is synchronized with the display program on the HD-A4L card after transmitting the display command to the LED panels can be seen in Figure 19. The Dashboard, LED display, and history/preview functions operate stably, with automatic reconnection capabilities during brief network interruptions. The data display latency is minimal, making it suitable for near real-time monitoring. Table 3 shows that the Web system achieved very low data loss rates and low latency, fully meeting the requirements for real-time monitoring and control, thereby demonstrating that this developedWeb platform is reliable enough for continuous operation in a laboratory environment.
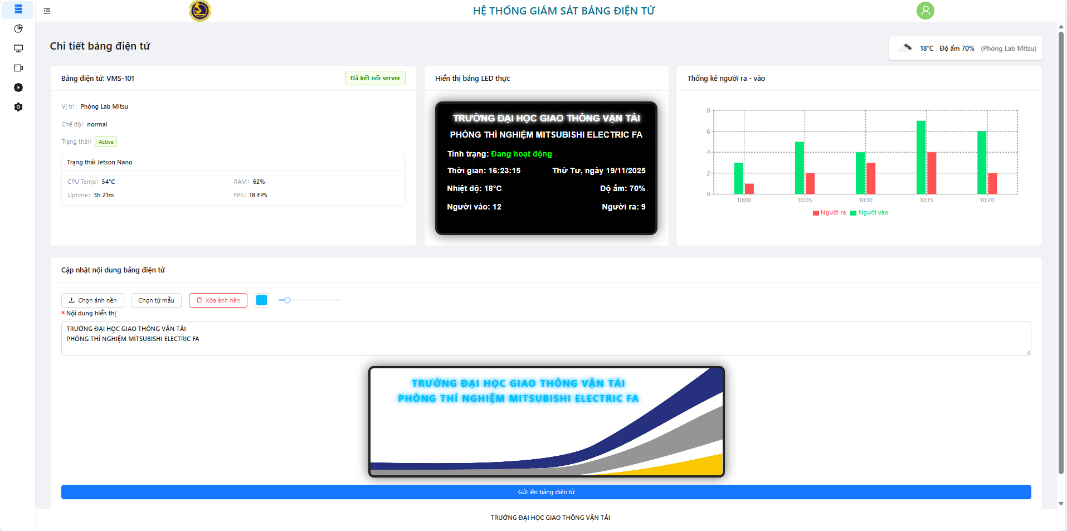
Figure 19. Preview of background and display content on LED panels
Table 3. Web Operation Metrics (3 sessions × 30 minutes)
Index (Web) | Median | p95 |
Dashboard update rate | 1.00 Hz | 1.00 |
MQTT reconnection time (Web) | 1.7 s | 3.9 s |
MQTT→UI delay (big-number) | 120 ms | 220 ms |
UI message drop rate | 0 % | 0 % |
Rendering errors/component freezes | 0 % | 0 % |
- CONCLUSION
This article presents the results of developing the Smart LED display management and monitoring system for the laboratory, successfully applied at the Mitsubishi FA laboratory at UTC. The system is equipped with hardware comprising an ESP32-based control circuit board integrated with a Jetson nano embedded computer, a Logitech camera, P2.5 LED modules, and an HD-A4L card. Subsequently, the authors developed an algorithm and image processing program for counting people entering and exiting the laboratory based on YOLOv7 TensorRT inference, alongside a Web management program to support easy and effective remote system management and monitoring. The Web management program enables the display of device operating status, laboratory safety warnings, and real-time data updates. It facilitates remote monitoring and content updates via computers or mobile phones. The people counting program running on the Jetson nano allows for high-accuracy recognition and counting of individuals entering and exiting the laboratory, satisfying real-time requirements.
The experimental results have confirmed the smart laboratory LED display system operational effectiveness and reliability. Specifically, the people counting algorithm based on the YOLOv7 achieved a high accuracy of over 90%. Furthermore, the LED web management program operates stably, offering a convenient and user-friendly interface that allows for easy expansion to multiple LED panels. Although the system achieved high accuracy in most test scenarios for In-Out the laboratory people counting, some limitations were noted when lighting changed sharply, many people simultaneously entering/exiting and intersecting, obscuring each other, or moving close together in a confined space. In these cases, ID-switching or temporary track loss could occur, leading to a slight increase in counting error. Additionally, when high people density persisted, the increased processing load resulted in a predicted decrease in FPS, although the system remained stable.
Future research will focus on developing edge AI models to further enhance people counting accuracy, under changing lighting conditions, people entering and exiting stand still near the corridor, either obscured the long passageway, ... or improving warning functions, and generating reports and statistics for the Web management program. Simultaneously, the system will integrate data processing and analysis of IoT sensor data, security cameras, ... The smart LED display management solution not only assists in monitoring individuals in enclosed spaces but is also scalable for integration with control, warning, or data statistical systems, serving management and industrial automation goals, such as smart classrooms management or monitoring worker entry and exit in factories.
Acknowledgement
This research is funded by University of Transport and Communications (UTC) under grant number T2025-DT-005.
REFERENCES
- A. S. Uyi, A. E. Airoboman, R. Ogu and C. Okwuokenye, "Development of a GSM Enabled Real-Time Electronic Display Board," 2024 IEEE PES/IAS PowerAfrica, pp. 01-05, 2024, https://doi.org/10.1109/PowerAfrica61624.2024.10759372.
- Z. Chen, C. B. Sivaparthipan, and B. Muthu, “IoT based smart and intelligent smart city energy optimization,” Sustainable Energy Technologies and Assessments, vol. 49, p. 101724, 2022, https://doi.org/10.1016/j.seta.2021.101724.
- J. Li et al., "Long-Distance, Real-Time LED Display-Camera Communication System Based on LED Point Clustering and Lightweight Image Processing", Photonics 9, no.10, p. 721, 2022, https://doi.org/10.3390/photonics9100721.
- A. Torralba, J. P. García-Martín, J. M. González-Romo, M. García-Castellano, J. Peral-López and V. Pérez-Mira, "An Autonomous, Intelligent Sign Control System Using Wireless Communication and LED Signs for Rural and Suburban Roads," in IEEE Intelligent Transportation Systems Magazine, vol. 14, no. 2, pp. 115-128, March-April 2022, https://doi.org/10.1109/MITS.2021.3049375.
- A. C.Caliwag, H. M. Canilang, M. A. Kamali, E. M. Caliwag, and W. Lim, “Design and Implementation of an IoT-Based Door Signage Control System,” Journal of the Korean Institute of Communications and Information Sciences, vol. 46, no. 4, pp. 696-705, 2021, https://doi.org/10.7840/kics.2021.46.4.696.
- S. Chen et al., “Passive matrix Micro-LED display driven by STM32 microcontroller using a two-wire serial transmission method,” In Journal of Physics: Conference Series, vol. 2524, no. 1, p. 012004, 2023, https://doi.org/10.1088/1742-6596/2524/1/012004.
- Z. Zou et al., "FPGA-based LED Display Technology," 2019 IEEE 4th Advanced Information Technology, Electronic and Automation Control Conference (IAEAC), pp. 2460-2463, 2019, https://doi.org/10.1109/IAEAC47372.2019.8997982.
- T. Facchinetti, A. Bonandin, G. Benetti and D. D. Martini, "Distributed architecture for a smart LEDs display system based on MQTT," 2020 25th IEEE International Conference on Emerging Technologies and Factory Automation (ETFA), pp. 1243-1246, 2020, https://doi.org/10.1109/ETFA46521.2020.9212084.
- B. Jyothi, D. Geethika, A. R. Khan, B. M. Prudhvi, M. A. S. V. Ratnakar and M. V. Vardhan, "Smart Illuminated Display Board," 2024 10th International Conference on Electrical Energy Systems (ICEES), pp. 1-7, 2024, https://doi.org/10.1109/ICEES61253.2024.10776858.
- P. Anuradha and K. S. Theja, "IoT Based Real Time LED Display Board," 2022 International Conference on Recent Trends in Microelectronics, Automation, Computing and Communications Systems (ICMACC), pp. 1-4, 2022, https://doi.org/10.1109/ICMACC54824.2022.10093434.
- H. Jiang, J. Xu and K. Wang, "Software and hardware design and implementation of LED display system of stadium big screen," 2011 International Conference on Multimedia Technology, pp. 3663-3666, 2011, https://doi.org/10.1109/ICMT.2011.6002193.
- I. Surya and J. Kustija, “Dashboard for Industrial Load Control and Remote Power Factor Correction Based on Adafruit’s MQTT”, Buletin Ilmiah Sarjana Teknik Elektro, vol. 5, no. 1, pp. 76–85, 2023, https://doi.org/10.12928/biste.v5i1.7494.
- M. A. Hailan, N. M. Ghazaly, and B. M. Albaker, “ESPNow Protocol-Based IIoT System for Remotely Monitoring and Controlling Industrial Systems,” Journal of Robotics and Control (JRC), vol. 5, no. 6, pp. 1924-1942, 2024, https://doi.org/10.18196/jrc.v5i6.21925.
- M. Ţălu, “Exploring IoT Applications for Transforming University Education: Smart Classrooms, Student Engagement, and Innovations in Teacher and Student-focused Technologies”, Buletin Ilmiah Sarjana Teknik Elektro, vol. 7, no. 1, pp. 9–29, 2025, https://doi.org/10.12928/biste.v7i1.12361.
- M. Mustofa and A. . Fadlil, “Design an Internet of Things-Based LPG Gas Leak Detection System”, Buletin Ilmiah Sarjana Teknik Elektro, vol. 4, no. 3, pp. 122–131, 2023, https://doi.org/10.12928/biste.v4i3.5572.
- Y. Munsadwala, P. Joshi, P. Patel and K. Rana, "Identification and Visualization of Hazardous Gases Using IoT," 2019 4th International Conference on Internet of Things: Smart Innovation and Usages (IoT-SIU), Ghaziabad, India, 2019, pp. 1-6, 2019, https://doi.org/10.1109/IoT-SIU.2019.8777481.
- S. Sharma, S. Das, J. Virmani, M. Sharma, S. Singh and A. Das, "IoT Based Dipstick Type Engine Oil Level and Impurities Monitoring System: A Portable Online Spectrophotometer," 2019 4th International Conference on Internet of Things: Smart Innovation and Usages (IoT-SIU), pp. 1-4, 2019, https://doi.org/10.1109/IoT-SIU.2019.8777703.
- V. Puranik, Sharmila, A. Ranjan and A. Kumari, "Automation in Agriculture and IoT," 2019 4th International Conference on Internet of Things: Smart Innovation and Usages (IoT-SIU), pp. 1-6, 2019, https://doi.org/10.1109/IoT-SIU.2019.8777619.
- D. Mishra, A. Khan, R. Tiwari and S. Upadhay, "Automated Irrigation System-IoT Based Approach," 2018 3rd International Conference On Internet of Things: Smart Innovation and Usages (IoT-SIU), pp. 1-4, 2018, https://doi.org/10.1109/IoT-SIU.2018.8519886.
- R. A. Kjellby, L. R. Cenkeramaddi, A. Frøytlog, B. B. Lozano, J. Soumya and M. Bhange, "Long-range & Self-powered IoT Devices for Agriculture & Aquaponics Based on Multi-hop Topology," 2019 IEEE 5th World Forum on Internet of Things (WF-IoT), pp. 545-549, 2019, https://doi.org/10.1109/WF-IoT.2019.8767196.
- I. Miladinovic and S. Schefer-Wenzl, "NFV enabled IoT architecture for an operating room environment," 2018 IEEE 4th World Forum on Internet of Things (WF-IoT), pp. 98-102, 2018, https://doi.org/10.1109/WF-IoT.2018.8355128.
- W. Eka Sari, E. Junirianto, and G. Fatur Perdana, “System of Measuring PH, Humidity, and Temperature Based on Internet of Things (IoT)”, Buletin Ilmiah Sarjana Teknik Elektro, vol. 3, no. 1, pp. 72–81, 2021, https://doi.org/10.12928/biste.v3i1.3214.
- D. D. Sanjaya and A. Fadlil, “Monitoring Temperature and Humidity of Boiler Chicken Cages Based on Internet of Things (IoT)”, Buletin Ilmiah Sarjana Teknik Elektro, vol. 5, no. 2, pp. 180–189, 2023, https://doi.org/10.12928/biste.v5i2.4897.
- D. T. Ma’arij and A. Yudhana, “Temperature and Humidity Monitoring System in Internet of Things-based Solar Dryer Dome”, Buletin Ilmiah Sarjana Teknik Elektro, vol. 5, no. 3, pp. 323–335, 2023, https://doi.org/10.12928/biste.v5i3.8633.
- S. M. Khan, M. T. Mahi and M. Rasheduzzaman, "Design and Implementation of a Low-Cost Weather Monitoring System using ESP-NOW," 2024 13th International Conference on Electrical and Computer Engineering (ICECE), pp. 437-442, 2024, https://doi.org/10.1109/ICECE64886.2024.11024940.
- J. Park, J. Bae, J. Lim, B. Kim and J. Jeong, "LED-Display Defect Detection Based on YOLOv5 and Transformer," in IEEE Access, vol. 11, pp. 124660-124675, 2023, https://doi.org/10.1109/ACCESS.2023.3325487.
- M. I. M. Ameerdin, M. H. Jamaluddin, A. Z. Shukor, and S. Mohamad, “A review of deep learning-based defect detection and panel localization for photovoltaic panel surveillance system,” International Journal of Robotics and Control Systems, vol. 4, no. 4, pp. 1746-1771, 2024, https://doi.org/10.31763/ijrcs.v4i4.1579.
- T. L. Mien, N. D. Tu, and N. Van Lam, “Deploying YOLOv8 for Real-Time Road Crack Detection on Smart Road Length Measurement Devices,” Journal of Future Artificial Intelligence and Technologies, vol. 2, no. 1, pp. 135-144, 2025, https://doi.org/10.62411/faith.3048-3719-102.
- H. I. K. Fathurrahman and C. Li-Yi, “Character Translation on Plate Recognition with Intelligence Approaches”, Buletin Ilmiah Sarjana Teknik Elektro, vol. 4, no. 3, pp. 105–110, 2023, https://doi.org/10.12928/biste.v4i3.7161.
- A. R. Zulkifli, K. Ali, and Z. Abd Rahman, “Raspberry Pi Based Intelligent Traffic Signal Control at Intersections,” In Control, Instrumentation and Mechatronics: Theory and Practice (pp. 391-405, 2022, https://doi.org/10.1007/978-981-19-3923-5_34.
- T. Luong Mien and V. Van Duy, "Development of the System of Monitoring Traffic Vehicle Volume and Density on the Vietnam’s Street," 2022 11th International Conference on Control, Automation and Information Sciences (ICCAIS), Hanoi, Vietnam, 2022, pp. 292-297, 2022, https://doi.org/10.1109/ICCAIS56082.2022.9990367.
- T. L. Mien and V. V. Duy, “Research on Building the System of the Identification and Detection Traffic Violations Vehicles at Vietnamese Intersections,” In International Conference on Engineering Research and Applications, pp. 831-838, 2022, https://doi.org/10.1007/978-3-031-22200-9_87.
- N. Bachir and Q. A. Memon, “Benchmarking YOLOv5 models for improved human detection in search and rescue missions,” Journal of Electronic Science and Technology, vol. 22, no. 1, p. 100243, 2024, https://doi.org/10.1016/j.jnlest.2024.100243.
- A. D. Baharuddin and M. A. M. Basri, “A YOLO-Based Target Detection Algorithm for DJI Tello Drone,” International Journal of Robotics and Control Systems, vol. 5, no. 3, pp. 1608-1624, 2025, https://doi.org/10.31763/ijrcs.v5i3.1898.
- T. A. R. Shyaa and A. A. Hashim, “Enhancing real human detection and people counting using YOLOv8,” In BIO Web of Conferences, vol. 97, p. 00061, 2024, https://doi.org/10.1051/bioconf/20249700061.
- N. Chandra and S. P. Panda, "A Human Intruder Detection System for Restricted Sensitive Areas," 2021 2nd International Conference on Range Technology (ICORT), pp. 1-4, 2021, https://doi.org/10.1109/ICORT52730.2021.9582099.
- N. M. Muriyah, J. H. Sim, and A. Yulianto, “Evaluating YOLOv5 and YOLOv8: advancements in human detection,” Journal of Information Systems and Informatics, vol. 6, no. 4, pp. 2999-3015, https://doi.org/10.51519/journalisi.v6i4.944.
- T. A. R. Shyaa and A. A. Hashim, “Enhancing real human detection and people counting using YOLOv8,” In BIO Web of Conferences, vol. 97, p. 00061, 2024, https://doi.org/10.1051/bioconf/20249700061.
- Y. Xiao, Z. Tian, J. Yu, Y. Zhang, S. Liu, S. Du, and X. Lan, “A review of object detection based on deep learning,” Multimedia Tools and Applications, vol. 79, no. 33, pp. 23729-23791, 2020, https://doi.org/10.1007/s11042-020-08976-6.
- T. L. Mien, V. Van An, and T. T. Huong, “Research and development of the pupil identification and warning system using AI-IoT,” Journal of Robotics and Control (JRC), vol. 3, no. 4, pp. 528-534, 2022, https://doi.org/10.18196/jrc.v3i4.14978.
AUTHOR BIOGRAPHY
Trinh Luong Mien obtained his PhD degree at Russian University of Transport (RUT MIIT) in Russia in 2012. He is Assoc.Prof.Dr., Head of Lab, Head of Department Cybernetics, Vice Dean of Faculty of Electrical - Electronic Engineering, University Transport and Communications in Vietnam since 2004. His main research is the development of intelligent control algorithms for the technological and manufacturing processes in industry and transportation. Email: mientl@utc.edu.vn. Orchid: https://orcid.org/0000-0003-4305-7130. Scopus: 59305481700 Google Scholar: https://scholar.google.com.vn/citations?user=9HtgrIUAAAAJ&hl. |
|
Vu Van Duy is an engineer in Control Engineering and Automation, graduated from UTC in 2023. Currently, he is studying for a master's degree at UTC. His research interests include embedded systems-IoT, AI algorithm & model development, Web programming (front-end, back-end). |
|
Trinh Thi Huong is a lecturer at UTC. She received her PhD in 2019 from HUST. Her main research interests are doppler frequency; communication in transportation; communication in railways, high-speed railways. |
|
Nguyen Trung Dung has a master's degree in Control Engineering and Automation. He is a lecturer at UTC. His research interests include Scada/IoT systems, electric drives, and automatic electric drives. |
Trinh Luong Mien (Application of AI-IoT Technologies to Develop the Smart LED Display Management and Monitoring System for the Laboratory)