Buletin Ilmiah Sarjana Teknik Elektro ISSN: 2685-9572
Vol. 8, No. 2, April 2026, pp. 515-529
CNN-Based Transfer Learning Models for Histopathological Detection of Non-Hodgkin Lymphoma on Histopathological Images
Aghnia Hasya Affan 1, Basari 1,2
1 Biomedical Engineering, Department of Electrical Engineering, Faculty of Engineering, Universitas Indonesia, Indonesia
2 Research Center for Biomedical Engineering, Faculty of Engineering, Universitas Indonesia, Indonesia
ARTICLE INFORMATION |
| ABSTRACT |
Article History: Received 04 November 2025 Revised 11 February 2026 Accepted 30 April 2026 |
| 
More than 85.720 new cases and 21.000 fatalities from lymphoma were reported globally in 2021. This type of cancer can spread through the body using the lymphatic system and then enter the blood. Since lymphoma affects the lymphatic system, it can be hard to diagnose correctly because there are many different subtypes, such as Mantle Cell Lymphoma (MCL), Follicular Lymphoma (FL), and Chronic Lymphocytic Leukemia (CLL). The diagnostic complexity of lymphoma highlights the need for more accurate and reliable automated diagnostic methods. This research proposes a transfer learning approach employing pre-trained Convolutional Neural Network (CNN) models using DenseNet-201, Xception, and ResNet-50, for lymphoma subtype classification. The dataset consists of microscopic histopathology images from three lymphoma classes (MCL, FL, and CLL). Each image was resized and segmented into 24 non-overlapping patches, followed by Macenko stain normalization and data augmentation. Model performance was evaluated using a random sampling with a fixed random seed train–validation–test split, and validated using cross-validation method. The proposed approach achieved classification accuracies of 96.7% for DenseNet-201, 97.15% for Xception, and 96.3% for ResNet-50. These results indicate that deeper architectures with efficient feature reuse and depthwise separable convolutions improve the detection of subtle morphological differences among lymphoma subtypes. Despite limitations related to dataset size and external validation, the findings demonstrate the potential of transfer learning-based CNN models as decision-support tools for lymphoma diagnosis. |
Keywords: Classification; CNN; Histopathology; Lymphoma; Transfer Learning |
Corresponding Author: Basari, Research Center for Biomedical Engineering, Faculty of Engineering, Universitas Indonesia, Indonesia. Email: basari.st@ui.ac.id |
This work is open access under a Creative Commons Attribution-Share Alike 4.0 
|
Document Citation: A. H. Affan and B. Basari, “CNN-Based Transfer Learning Models for Histopathological Detection of Non-Hodgkin Lymphoma on Histopathological Images,” Buletin Ilmiah Sarjana Teknik Elektro, vol. 8, no. 2, pp. 515-529, 2026, DOI: 10.12928/biste.v8i2.15207. |
- INTRODUCTION
In 2021, there were more than 85.720 new cases and approximately 21.000 deaths worldwide that were caused by lymphoma [1]. Lymphoma is a heterogeneous group of hematological malignancies. The lymphatic system is comprised of lymph nodes and vessels that help remove extra fluid from the body, return it to the blood, and filter out old, damaged, or unhealthy cells. Lymph nodes contain T and B cells. Lymphoma occurs when one or both of these cells turn malignant [2]–[4]. This cancer can appear almost anywhere in the body, especially in lymph node tissue, and then spread systemically through the lymphatic system and into the blood, affecting other organs such as the lungs and liver. Due to its biological complexity and morphological variability, lymphoma presents significant diagnostic challenges, particularly when distinguishing between closely related subtypes such as Chronic Lymphocytic Leukemia (CLL), Mantle Cell Lymphoma (MCL), and Follicular Lymphoma (FL).
The difficulty of diagnosing and classifying the many forms of lymphoma highlights the critical need for more effective and precise diagnostic techniques. The diagnostic process, as it currently stands, depends largely on the analysis of histopathological slides manually, supplemented by immunophenotyping, cytogenetics, and molecular studies, as per the guidelines of the World Health Organization [5]–[7]. Manual histopathological analysis is time-consuming, labor-intensive, and subject to interpersonal and intra-person variations, especially in resource-deficient areas. Such factors can contribute to diagnostic delays, misdiagnoses, and poor treatment responses.
Recent advances in artificial intelligence (AI), particularly deep learning, have demonstrated strong potential in medical image analysis. Deep learning models, especially Convolutional Neural Networks (CNNs), can automatically learn hierarchical feature representations from raw image data, making them well-suited for analyzing complex histopathological patterns that are difficult to quantify using handcrafted features [8]–[10]. In oncology, deep learning has shown promising results in tumor detection, subtype classification, and prognosis prediction, outperforming traditional machine learning approaches in many imaging-based tasks [11]–[13].
In the context of lymphoma, deep learning offers distinct advantages due to its ability to capture subtle morphological differences among lymphoma subtypes from histopathological images. Several studies have reported improved diagnostic accuracy using CNN-based models for lymphoma classification, however, important challenges remain [14]–[17]. These include limited labeled datasets, class imbalance between lymphoma subtypes, variability in staining and image acquisition, and the lack of model interpretability, which hinders clinical trust and adoption [18]–[21]. Moreover, many existing studies focus on single subtypes or small datasets, limiting their generalizability in real-world clinical settings.
To address these challenges, transfer learning has emerged as a promising technique. This way, the trained model on massive amounts of data can be fine-tuned for medical image tasks when the data is not sufficient. Although transfer learning proves promising, there is a lack of sufficient research regarding the application of this technique for categorizing varying lymphomas, particularly when studied in terms of histopathological images of CLL, MCL, and FL [22]–[24].
Driven by the imperative need for improved diagnostic tools within the context of lymphoma this paper proposes and evaluates a deep learning approach for a transfer learning framework for the classification of lymphomas (CLL, MCL, and FL) based on histopathological images using CNN, especially for their ability to cope with scenarios involving a small number of samples for training, as well as for their applicability for classifying samples that belong to morphologically similar lymphomas. The objective of this study will be to improve upon the educational foundation established by past works for enhanced throughput, efficiency, and accuracy for AI-assisted lymphoma diagnostics.
- METHODS
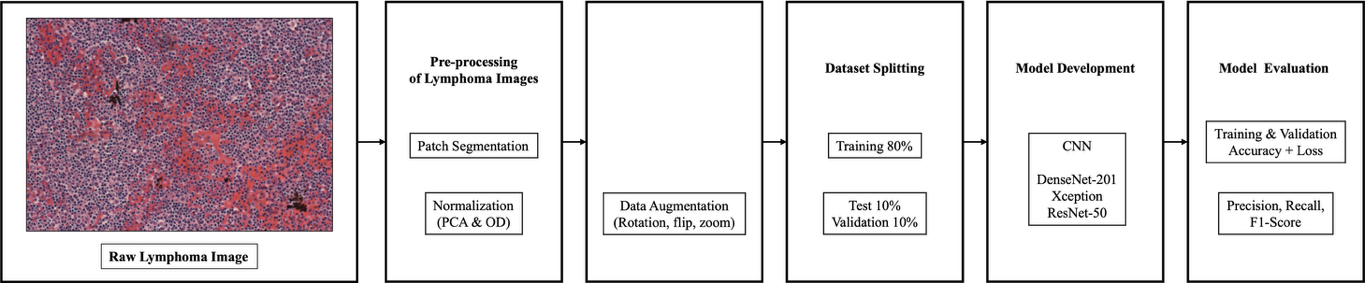
The proposed framework for this research work is shown in Figure 1. It can be seen that the proposed method aims to enhance the accuracy of lymphoma classification through the use of an optimized deep learning system.The histopathological images that were processed were segmented into patches, were then normalized, and finally, image augmentation was performed. After this, the dataset was split into pieces, namely, the train, validation, and testing sets. There were three architectures of the convolutional neural network that were used as classifiers. Performances were evaluated through accuracy measures.
Figure 1. Proposed Framework
- Dataset
The dataset used in this study comes from Kaggle and is called the Malignant Lymphoma Classification Dataset. It consists of 374 high-resolution histopathological images acquired using hematoxylin and eosin (H&E). The dataset includes three malignant lymphoma subtypes: Chronic Lymphocytic Leukemia (CLL) with 113 images, Follicular Lymphoma (FL) with 139 images, and Mantle Cell Lymphoma (MCL) with 122 images. All the images are in TIFF format, which keeps detailed shape and color information important for studying tissues under a microscope. These images exhibit WSI-like characteristics, such as large spatial dimensions and rich tissue context, but they do not represent full gigapixel whole-slide images acquired with standard digital slide scanners. Instead, the images correspond to high-resolution microscopic fields of view (FOVs) that capture substantial tissue regions suitable for patch-based analysis. These images were collected by different pathologists from various locations, which means there is a lot of variation in how the tissue samples are stained. This variation is similar to what is seen in real clinical practice and makes it harder to develop accurate models. Some examples of the data used in this study are shown in Figure 2.
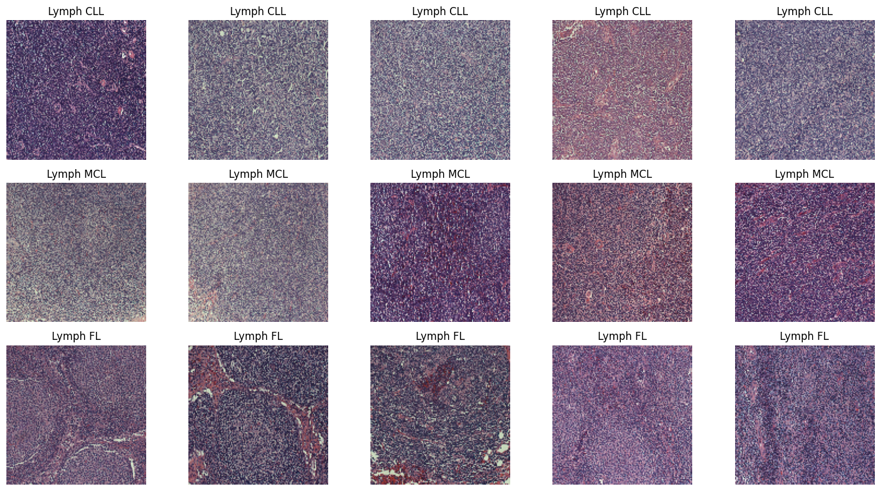
Figure 2. Lymphoma Image Sample
- Data Pre-processing
Preprocessing is an important part of medical image analysis because raw histopathological images often have noise and staining inconsistencies, which can cause less accurate classification outcomes [25]–[27]. An overview of the preprocessing steps used in this study is shown in Figure 3.
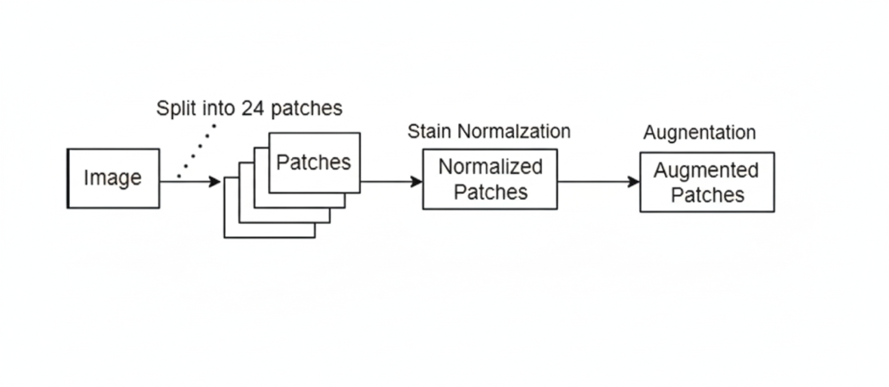
Figure 3. Data Pre-processing Diagram Flowchart
- Patch Segmentation
Due to the large size of the histopathological images, we adopted the patch-based concept to train the CNN efficiently and extract the features of particular regions of the images. Moreover, since the images are not gigapixel images but do contain large regions of different patterns in the tissue, the strategy of dividing the images into smaller regions would enable the network to focus on the details at the cell and tissue levels, as well as make the images appear larger than they are.
For each histopathological image, a tiling operation was carried out, wherein the image was sliced into a grid of fixed patches without overlap, applying a non-overlapping tiling technique. The patch extraction was carried out with a patch size of 224×224 pixels and a patch stride of the same value. In contrast to the typical sliding windows used for full images, the tiling strategy in this approach prevents the generation of redundant samplings and correlations between patches to achieve full coverage of the tissue areas.
Resulting in 24 separate patches per image, as shown in Figure 4. This approach make sure that every part of the histopathology image is covered, and it also greatly increases the number of different examples the model can learn from. The tiling operation strikes a balance between coverage and efficiency, ensuring that all areas in the image are covered adequately. By using this method, the size of the dataset becomes 24 times larger. This gives the deep learning model a more diverse and richer set of data points to learn from, increasing the number of pictures accessible for training and assessment.
- Stain Normalization
Following segmentation, each recovered picture patch was carefully stain-normalized to ensure consistency across the sample. Stain normalization was performed using the Macenko method to correct for differences in color caused by imaging equipment, staining techniques (Hematoxylin and Eosin, or H&E), and tissue processing. The Macenko method involves converting the image into Optical Density (OD) space, identifying background pixels, determining the primary stain vectors using Principal Component Analysis (PCA), estimating stain concentrations, and finally reconstructing the image using standardized target stain vectors. For dependable and successful model training, this meticulous process ensures that every patch maintains a consistent statistical distribution of hue and intensity.
- Data Augmentation and Dataset Splitting
To improve the model’s performance, data augmentation techniques were used to create more training samples and reduce overfitting. Each image was resized to 224×224×3 pixels, then applied random transformations such as rotation, flipping, and zooming. The dataset was then divided into a training set, a validation set, and a testing set with a ratio of 80:10:10 using random sampling with a fixed random seed. This made sure that each group had a good mix of different types, which helped in checking how well the model performs. We didn't use any special methods to fix class imbalance because the classes were already fairly balanced after we did the patch extraction.
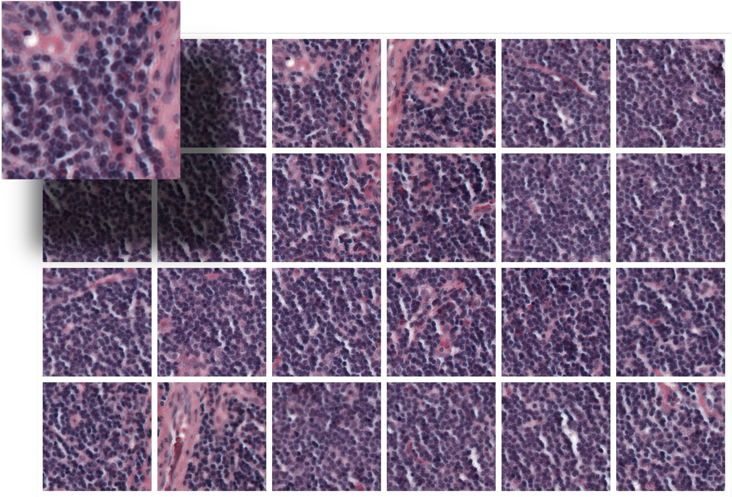
Figure 4. Image Patch Segmentation Illustration
- Convolutional Neural Network (CNN) Models
Transfer learning is the methodology of using pre-trained models to improve the training of new models, as these apply knowledge gained from solving one problem to related new ones [28]. That means transferring characteristics learned on huge datasets to a new network and retraining only the classification part with a small dataset, which would enhance the performance. This methodology is exemplified in the analysis of a pre-trained model for malignant lymphoma classification [29][30].
CNNs are one of the breakthroughs in deep learning, especially in image diagnosis and analysis. Unlike traditional machine learning, CNNs make use of convolutional filter layers followed by fully connected layers to learn directly from image data without explicit feature selection. Because they are efficient in handling large numbers of features during training, they have become very important in medical imaging for the diagnosis of blood cancer [31][32]. Advanced algorithms for CNNs have been developed, establishing them as among the leading tools in computer vision. A real-world application involves training a CNN model to differentiate large-cell cancers from small-cell cancers, proving its effectiveness in real-world applications [33]. Figure 5 shows a general architecture of CNN.
- DenseNet-201
DenseNet, or Densely Connected Convolutional Networks, has been performing well in medical image analysis, including for histopathological images used in the detection of cancers [34]–[37]. In its dense connectivity architecture, it improves the flow of information and feature map propagation, thus reducing the problem of vanishing gradients. DenseNet-201 consists of 201 layers that are divided into dense blocks; each layer can directly take features from all previous layers. The combination of these features results in more information being retained, thereby using the features more effectively. Between the blocks, a few layers use small convolution and average pooling in order to avoid the complexity of the model. This helps the network capture more granular details of the detailed features, accelerates learning, and reduces the overall number of parameters. Its ability to spread features strongly makes it good at capturing detailed and subtle histopathological textures while maintaining efficient gradient flow.
- Xception
Xception, or “Extreme Inception”, is a more advanced version of the Inception model. It employs a special type of convolution known as depthwise separable convolutions, which makes the model more efficient in its run time and with less processing power. It contains two steps: a 1×1 convolution to combine information across channels, and a depthwise convolution applying a separate filter to each input channel. This model has 36 convolutional layers followed by fully connected layers to learn better with relatively fewer resources. It works well for classifying medical images and is good at learning important spatial and color features. This makes it suitable for analyzing images of stained tissues. Xception finds better interrelationships across various channels on its own and hence is more effective and efficient compared with ResNet and DenseNet models [38].
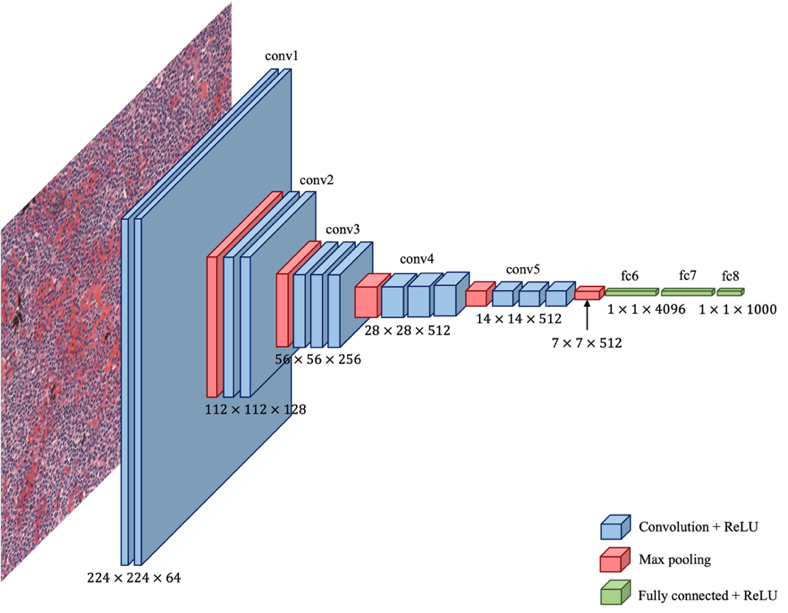
Figure 5. CNN Architecture
- ResNet-50
ResNet-50 is a 50-layer convolutional neural network designed to address the vanishing gradient problem prevalent in deep learning models. It includes 25.6 million parameters and is primarily composed of convolutional layers, pooling layers, and residual layers with shortcut connections. The architecture features a single convolutional layer followed by 16 bottleneck residual blocks, each using 1×1, 3×3, and 1×1 convolutions. The innovative skip connection allows the output from earlier layers to bypass subsequent layers, enhancing gradient flow through deeper layers and enabling efficient training and high accuracy. ResNet-50 provides stable training, strong baseline performance, and robust feature extraction from complex tissue patterns.
- Evaluation Metrics
Performance of the predictive model is analyzed in terms of traditional measures of performance, such as precision, recall, accuracy, and F1-Score [39]. Parameters are numbers or values that show how well the system is working, what results it is giving, or what happens when it is tested. They help to measure and understand the system's performance and outcomes, defined with respect to the notions of True Positives (TP), True Negatives (TN), False Positives (FP), and False Negatives (FN) [40]. The performance matrix is shown in Table 1. Accuracy is the ratio of the total number of data points that the system predicts correctly compared to the total number of data points. Precision is the ratio of correctly predicted positive classes to the total number of predicted positive classes. Recall is the ratio of correctly predicted positive classes by the system to the total number of actual positive classes. The F1-Score is calculated by taking the average of precision and recall. The F1-Score helps balance precision, which shows how accurate the positive predictions are, and recall, which shows how many of the actual positive cases were correctly identified [41].
Table 1. Performance matrix
No | Formula |
Accuracy | 
|
Precision | 
|
Recall | 
|
F1-Score | 
|
- Evaluation Setup
All the experiments were done using Google Colaboratory, a cloud-based platform that offers GPU-accelerated environments for deep learning research. The system was configured with an NVIDIA A100 GPU with 40 GB VRAM, an Intel Xeon CPU, and a 12 GB RAM virtual machine. The software environment was Python 3.10, TensorFlow 2.15, Keras, OpenCV, NumPy, Pandas, Matplotlib, and Scikit-learn for model development, image pre-processing, and evaluation. To ensure a fair comparison among models, a single fixed set of training hyperparameters was applied across all experiments. Each model was trained for 25 epochs using a batch size of 32 and a learning rate of  .
.
- RESULT AND DISCUSSION
- Data Quantity and Distribution after Preprocessing
The original dataset balance was initially 122 MCL, 139 FL, and 113 CLL Whole-Slide pictures. Figure 6 shows the dataset expanded to 2.712 CLL, 3.336 FL, and 2.928 MCL images after patching, resulting in a significantly larger, more evenly distributed dataset. Through segmentation, the model acquired more representative features for each lymphoma subtype, improving its generalization and classification performance and reducing overfitting in the analysis of medical images. Table 2 shows the number of data points the systems randomly split into 80% for training, 10% for validation, and 10% for testing, resulting in a total of 7.179 training samples, 896 validation samples, and 901 testing samples.
- Performance Results of Convolutional Neural Network (CNN) Models
All models are tested for their performance under the same conditions. This will ensure a fair and unbiased comparison between the models. As described in Section 2.5, some common parameters like dataset split, resolution, data augmentation, and training parameters are used for DenseNet-201, Xception, and ResNet-50. Thus, differences in performance can be attributed mainly to the architectural differences, rather than differences in other conditions. This section shows how well the DenseNet-201, Xception, and ResNet-50 models performed in classifying the test data. The models were checked using accuracy, precision, recall, and F1-score. To better understand their performance and how they make decisions, we also used confusion matrices, learning curves, and Grad-CAM images.
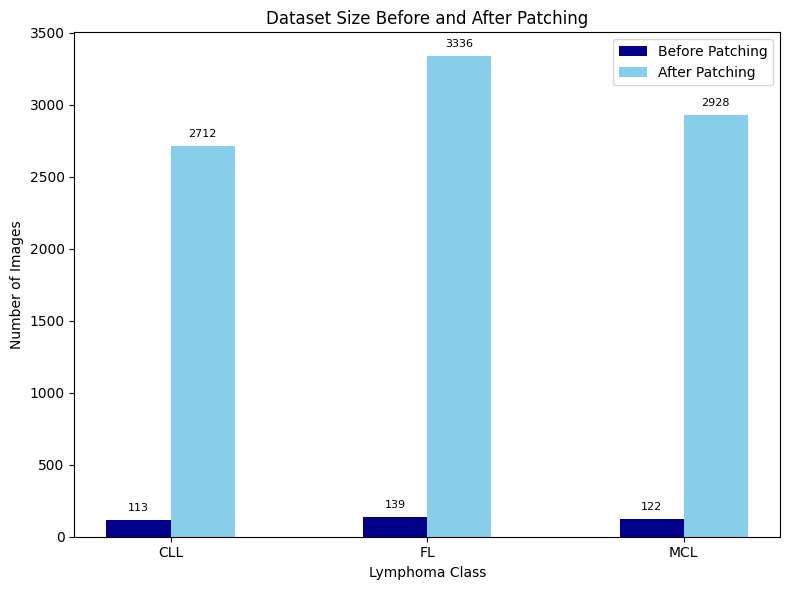
Figure 6. Dataset Size Before and After Patch Segmentation
Table 2. Lymphoma Dataset
Class | Total Images | Training (80%) | Validation (10%) | Testing (10%) |
CLL | 2.712 | 2.169 | 271 | 272 |
MCL | 2.928 | 2.342 | 292 | 294 |
FL | 3.336 | 2.668 | 333 | 335 |
Total | 8.976 | 7.179 | 896 | 901 |
- Performance Results of DenseNet-201
Performance is carried out using the DenseNet-201 architecture. Figure 7(a) and Figure 7(b) show model training and validation accuracy and loss, and Figure 7(c) shows the confusion matrix results. At the final epoch, DenseNet-201 achieved a training accuracy of 97.61% and validation accuracy of 98.33%, with corresponding training and validation losses of 0.0763 and 0.0531, respectively, indicating no evident overfitting. As shown in Table 3, the model demonstrated a strong ability to categorize the three lymphoma subtypes. The precision values recorded were 0.98 for CLL, 0.97 for FL, and 0.95 for MCL, whereas the recall values were 0.97, 0.96, and 0.97, respectively, demonstrating effective identification of positive instances in all categories. F1-scores, which balance precision and recall, were 0.97 for CLL and FL, and 0.96 for MCL. Macro averages were 0.967 for all metrics, showing that the system was working well on all subtypes, whereas weighted averages were calculated as 0.967 for precision, recall, and 0.963 for F1-score, taking into account the distribution of subtypes. This showcases that the system is correctly identifying different subtypes of lymphoma within the test dataset. Of the three subtypes, CLL had the highest precision, which could be related to the relatively more homogeneous cell morphology. MCL, additionally, has a more varied morphology, which could account for its slightly lower precision. There was no significant difference between the precision values. Overall, DenseNet-201 achieved an overall classification accuracy of 96.7% on the test dataset.
The Grad-CAM image of DenseNet-201, shown in Figure 7 (d), shows extensive but orderly patterns of activation across regions where there are a lot of densely packed lymphoid cells. The regions where the attention is focused are the ones where the color is yellow and red, which are concentrated in regions with a lot of nuclei. In such regions, one can easily observe the variability in the size of the nuclei, the density of the contents, and the organization of the cells. This is not surprising given the nature of DenseNet, which is known to have a deeply interconnected architecture such that it can take in both the detailed textural information in early layers and the more intricate patterns in late layers. Hence, one can conclude that DenseNet-201 is paying attention to very small details in a tissue image, rather than paying attention to color or background.
Figure 7. Performance Results of DenseNet-201: (a) Accuracy, (b) Loss, (c) Confusion Matrix,
(d) Grad-CAM
Table 3. Performance Results of DenseNet-201
Class | Precision | Recall | F1-Score |
CLL | 0.98 | 0.97 | 0.97 |
FL | 0.97 | 0.96 | 0.97 |
MCL | 0.95 | 0.97 | 0.96 |
- Performance Results of Xception
Performance is carried out using the Xception architecture. Figure 8(a) and Figure 8(b) show model training and validation accuracy and loss, and Figure 8(c) shows the confusion matrix results. At epoch 25, the Xception model reached a training accuracy of 98.11% and validation accuracy of 98.55%, while the training and validation losses converged to 0.0575 and 0.0417, indicating no evident overfitting. As shown in Table 4, CLL achieved a precision of 0.97, a recall of 0.98, and an F1 score of 0.98, indicating accurate and comprehensive identification of positive cases. FL and MCL both had precision, recall, and F1-score of 0.97, reflecting consistent performance across these subtypes. Macro averages were 0.967 across all metrics, indicating consistent performance across subtypes. The weighted averages also showed 0.97 across all metrics. Overall, the model reliably distinguishes among the three lymphoma subtypes, with slightly higher performance on CLL, suggesting minor differences in classification effectiveness across the subtypes. The Xception model achieved the highest overall accuracy of 97.15% among all evaluated architectures. Xception performs better might be justified by its capability to decouple spatial and channel-wise feature learning, allowing it to locate more precisely the abnormal lymphoid aggregates and nuclear arrangements characteristic of various lymphoma subtypes.
Xception Grad-CAM, as shown in Figure 8(d), presents a more focused and tighter area of activity, mainly around the central lymphoid structures. Xception has clearer lines between important and less important parts of the image. This is because Xception uses a type of convolution known as depthwise separable convolutions, which help the model in learning spatial and channel features separately. Therefore, Xception highlights specific parts of the image that form the important elements, such as groups of abnormal lymphocytes and areas with a high count of cell nuclei, while ignoring the less relevant background.
Figure 8. Performance Results of Xception: (a) Accuracy, (b) Loss, (c) Confusion Matrix,
(d) Grad-CAM
Table 4. Performance Results of Xception
Class | Precision | Recall | F1-Score |
CLL | 0.97 | 0.98 | 0.98 |
FL | 0.97 | 0.97 | 0.97 |
MCL | 0.97 | 0.97 | 0.97 |
- Performance Results of ResNet-50
Performance is carried out using the ResNet-50 architecture. Figure 9(a) and Figure 9(b) show model training and validation accuracy and loss, and Figure 9(c) shows the confusion matrix results. ResNet-50 showed stable convergence, with final training and validation accuracies of 97.29% and 98.44%, and closely aligned loss values, suggesting balanced learning behavior. As shown in Table 5, CLL achieved precision, recall, and F1 scores of 0.97, indicating balanced and accurate classification. FL had a precision of 0.97, a recall of 0.97, and an F1-score of 0.96, indicating slightly lower sensitivity compared to the other subtypes. MCL showed precision of 0.96, recall of 0.97, and an F1-score of 0.96, suggesting slightly lower precision and higher recall. Macro averages across all subtypes were 0.963 for precision, recall, and F1-score, while the weighted averages were similar. The model performs well and consistently across all subtypes. Among the subtypes, CLL did the best, while FL had lower recall and MCL had slightly lower precision. ResNet-50 achieved an overall accuracy of 96.3%, demonstrating competitive but slightly lower performance compared to DenseNet-201 and Xception.
The output of Grad-CAM on ResNet-50 is shown in Figure 9(d), which shows a more fragmented and distributed attention pattern on the image. The areas that are deemed important to focus on are no longer grouped together. Although there is still attention to areas with a higher number of lymphoid cells, there isn’t a significant focus on them like there is with a more attention-focused model like DenseNet-201 and Xception. This is because ResNet-50 relies on a residual learning technique, allowing it to maintain a stable gradient and train on generic features. Although this is an efficient classification method, there may be a less-than-optimal identification of minute details in cellular structure. These findings are further supported by 5-fold and 10-fold cross-validation results, which demonstrate consistent performance across different data splits.
Figure 9. Performance Results of ResNet-50: (a) Accuracy, (b) Loss, (c) Confusion Matrix,
(d) Grad-CAM
Table 5. Performance Results of ResNet-50
Class | Precision | Recall | F1-Score |
CLL | 0.97 | 0.97 | 0.97 |
FL | 0.97 | 0.95 | 0.96 |
MCL | 0.95 | 0.97 | 0.96 |
- Cross-Validation Results and Model Robustness
To further evaluate the robustness of the models and avoid possible bias in the train and test split, cross-validation with a 5-fold and 10-fold cross-validation setup was performed for the three CNN architectures with the same preprocessing and hyperparameter setting. The cross-validation setup included patches and ensured proper data distribution. As shown in Table 6, DenseNet-201 achieved the highest mean accuracy in both validation strategies (95.67% for 5-fold and 94.33% for 10-fold), followed by Xception (94.67% and 94.15%) and ResNet-50 (93.34% and 92.67%).
Across all models, the cross-validation results are consistent with the single split evaluation, demonstrating stable performance and good generalization capability. The accuracy in DenseNet-201 is the highest in both cross-validation methods, followed by the Xception, and then ResNet-50. Although the cross-validation accuracy is slightly lower when compared with the fixed split validation accuracy, this is to be expected in histopathological analysis due to increased variability across folds and reduced training data per fold. Importantly, the consistent performance ranking across both validation strategies indicates stable learning behavior and good generalization capability of the proposed models.
- Effect of Model Depth and Feature Learning on Performance Results
Differences in the performance of DenseNet-201, Xception, and ResNet-50 models can be considered as a result of their architectures being deep, as well as their ability to extract features. DenseNet-201, with its strong connectivity, has the ability to extract histopathological information. Its design facilitates the passage of gradients through the network, thus eliminating the issues associated with the vanishing gradients. In addition, its precision and recall are well balanced across all lymphoma subtypes. Xception models demonstrate more precise relationships in the different channels with regard to spatial correlations, as the depth will define the usage of separable convolutions. Xception models demonstrate more precise relationships between different feature channels when it comes to spatial relationships, as the depth will define the usage of separable convolutions. Even though Macenko stain normalization makes the overall color look the same in histopathological images, there are still differences in how much stain is present, where it is located, and how the tissue looks in different areas. This architecture is able to capture how strong the stains are in different areas and complex texture variations found in lymphoma histopathology images, even after Macenko stain normalization, while maintaining computational efficiency.
DenseNet-201 uses a dense structure to effectively share features, which will allow for fine details in cell texture as well as small architectural patterns to pass through various layers without hindrance. These details are particularly important in tissue sample analysis, where minor variations in nuclear morphology and tissue organization may determine the diagnosis of specific lymphoma subtypes. Xception separates the learning of spatial features from channel-wise intensity information, making it effective at capturing variations in cell density and relative staining intensity after normalization. In contrast, ResNet-50 tends to focus on learning more generic hierarchical features through residual connections, which may make it less sensitive to subtle morphological differences among lymphoma subtypes. Overall, these findings suggest that for histopathology classification tasks in which subtle morphological differences between lymphoma subtypes are crucial, deeper, more highly connected architectures, such as DenseNet-201 and Xception, are more effective.
- Comparative Analysis
We review related prior studies with similar titles in terms of using pre-trained DL models to analyze histopathology images to diagnose malignant lymphomas and create new datasets [37]. Various pre-trained models leveraged knowledge learned during training with ImageNet in performing different tasks for the creation of new datasets. Convolutional and adjuvant layers in DL models have been utilized in analyzing histopathological images of malignant lymphomas. Utilizing totally connected layers, the activation function classifies each image into its appropriate class.
Table 7 compares the performance of the proposed models with the recent works. Among the individual architectures, the Xception model resulted in the highest accuracy, yielding a value of 97.15%, followed by DenseNet-201 and ResNet-50, respectively, offering accuracies of 96.7% and 96.3%. Each one of the three CNN-based suggested approaches outperforms the base model performance results from the recent studies, including the performance of DenseNet-201 (93%), Xception (95%), and ResNet-50 (87.52%). The results also bring out the excellent feature extraction and classification capabilities of modern convolutional networks; especially, Xception's depthwise separable convolutions enhance the computational efficiency and performance.
Compared to previous research works [20] and [30], several key reasons are why the improved result in this research happens. These reasons involve the utilization of the Macenko algorithm to normalize the stain, increase the amount of data used in several patches, and optimize in-depth pre-trained models. Compared to previous research works, it is likely that previous research works used fewer data or more straightforward methods in processing data, which could result in constraints in how those results can or will be used in different contexts. This research is also different in that it provides an analysis of model decisions through Grad-CAM analysis.
- Limitations and Clinical Implications
Despite the excellent performance attained, this research has a number of limitations. These are: first, the research used only one public set for experimentation, which may reduce generalization to validation sets derived from different sources. While the Macenko technique reduces the staining variations, some variations are still likely to impact the performance. Further validation should be considered in the future.
Clinically, the accuracy and performance attained suggest that the models practiced in this research have the potential to become computer-aided diagnostic tools that assist pathologists in the classification of the subtype of a lymphoma. However, these models need to be validated and tested before being employed in the clinic. Ensemble or hybrid modeling strategies were not explored in this study, as the primary objective was to evaluate and compare the intrinsic feature learning capabilities of individual CNN architectures.
Table 6. Cross-Validation Performance
Model | 5-fold CV Accuracy (%) | 10-fold CV Accuracy (%) |
DenseNet-201 | 95.67 | 94.33 |
Xception | 94.67 | 94.15 |
ResNet-50 | 93.34 | 92.67 |
Table 7. Performance Comparison
Paper | Model | Accuracy (%) |
Proposed Method | DenseNet-201 | 96.7 |
Xception | 97.15 |
ResNet-50 | 96.3 |
Previous Works | DenseNet-201 [30] | 93 |
Xception [30] | 95 |
ResNet-50 [20] | 87.52 |
- CONCLUSIONS
This work proves the effectiveness of transfer learning-powered CNN models for the automatic classification of lymphoma subtypes in histopathological images. Of the three CNN models used for the comparison, the Xception model performed the best (97.15% accuracy), followed by the DenseNet-201 model (96.7%) and the ResNet-50 model (96.3%). The effectiveness of the Xception model may be ascribed to the use of depthwise separable convolutions in the model, which promote the detection of lymphoma subtype morphology and texture features at the finest levels. Additionally, the dense connectivity property of the DenseNet model ensures the retention of the finest structural details of the image. Both of these aspects of the respective models offset the complexity of the lymphoma diagnostic problem, which is a fine-line classification task.
The proposed method shows an improvement of about 2 to 9% points in the accuracy of lymphoma classification compared with the previous studies, which suggests the effectiveness of the preprocessing strategy for enhanced robustness and discrimination in digital pathology applications. The study adds to the literature on the impact of CNN architecture and preprocessing techniques, which provides helpful information for the design of CNN models for clinical applications and assists in understanding the contribution of preprocessing techniques for enhanced robustness and discrimination.
From a practical point of view, computational efficiency was also taken into account. Although DenseNet-201 is good at capturing detailed features, it takes longer to process because of its dense connections. ResNet-50 offers a good mix of depth and speed, while Xception gives the best balance between accuracy and processing time. This makes Xception better for situations where quick and efficient processing is needed, like in near-real-time or high-volume clinical screening. These qualities help make it possible to use these models in computer-aided diagnosis tools, which can help pathologists by making their work less subjective and reducing their workload, especially during regular lymphoma screenings.
Although these are encouraging findings, this study is based on a single-source database, which can be somewhat problematic in terms of generalization for an institution that has differing staining procedures or perhaps even vendors of image scanners. Future studies should focus more on external validation of their results by multi-center datasets to check robustness and generalizability. Secondly, CNN-Transformer hybrid architectures appear to be a promising area to explore. Additionally, ensembling techniques of weighted soft-voting or a combination of Xception and DenseNet architectures could be considered to improve stability as well as classification accuracy. Apart from that, it is important to incorporate explainability tools like Grad-CAM to improve trustworthiness by identifying meaningful areas. This area of study has enormous potential to bring advancements to automated lymphoma diagnosis.
ACKNOWLEDGEMENT
The authors would like to thank to Universitas Indonesia for PUTI Grant 2025 No. PKS-380/UN2.RST/HKP.05.00/2025.
REFERENCES
- S. Soltane, S. Alsharif, and S. M. Serag Eldin, “Classification and diagnosis of lymphoma’s histopathological images using transfer learning,” Computer Systems Science and Engineering, vol. 40, no. 2, pp. 629–644, 2021, https://doi.org/10.32604/CSSE.2022.019333.
- V. Gaidano et al., “A clinically applicable approach to the classification of B-cell non-hodgkin lymphomas with flow cytometry and machine learning,” Cancers (Basel), vol. 12, no. 6, pp. 1–18, 2020, https://doi.org/10.3390/cancers12061684.
- J. Carreras, N. Nakamura, and R. Hamoudi, “Artificial Intelligence Analysis of Gene Expression Predicted the Overall Survival of Mantle Cell Lymphoma and a Large Pan-Cancer Series,” Healthcare (Switzerland), vol. 10, no. 1, 2022, https://doi.org/10.3390/healthcare10010155.
- H. El Achi and J. D. Khoury, “Artificial intelligence and digital microscopy applications in diagnostic hematopathology,” Cancers (Basel), vol. 12, no. 4, pp. 1–15, 2020, https://doi.org/10.3390/cancers12040797.
- Z. Swiderska-Chadaj, K. M. Hebeda, M. van den Brand, and G. Litjens, “Artificial intelligence to detect MYC translocation in slides of diffuse large B-cell lymphoma,” Virchows Archiv, vol. 479, no. 3, pp. 617–621, 2021, https://doi.org/10.1007/s00428-020-02931-4.
- H. Miyoshi et al., “Deep learning shows the capability of high-level computer-aided diagnosis in malignant lymphoma,” Laboratory Investigation, vol. 100, no. 10, pp. 1300–1310, 2020, https://doi.org/10.1038/s41374-020-0442-3.
- K. Hübel, “Lymphoma: New Diagnosis and Current Treatment Strategies,” J Clin Med, vol. 11, no. 6, pp. 10–12, 2022, https://doi.org/10.3390/jcm11061701.
- W. Liu et al., “Improving survival of 3760 patients with lymphoma: Experience of an academic center over two decades,” Cancer Med, vol. 9, no. 11, pp. 3765–3774, 2020, https://doi.org/10.1002/cam4.3037.
- T. Doeleman, L. M. Hondelink, M. H. Vermeer, M. R. van Dijk, and A. M. R. Schrader, “Artificial intelligence in digital pathology of cutaneous lymphomas: A review of the current state and future perspectives,” Semin Cancer Biol, vol. 94, no. June, pp. 81–88, 2023, https://doi.org/10.1016/j.semcancer.2023.06.004.
- K. Thomsen, A. L. Christensen, L. Iversen, H. B. Lomholt, and O. Winther, “Deep Learning for Diagnostic Binary Classification of Multiple-Lesion Skin Diseases,” Front Med (Lausanne), vol. 7, pp. 1–7, 2020, https://doi.org/10.3389/fmed.2020.574329.
- W. D. Lewis, S. Lilly, and K. L. Jones, “Lymphoma: Diagnosis and treatment,” American Academy of Family Physicians, vol. 101, no. 1, pp. 34-41, 2020, https://www.aafp.org/pubs/afp/issues/2020/0101/p34.html.
- H. Wang, Z. Liu, J. Yang, L. Sheng, and D. Chen, “Using Machine Learning to Expand the Ann Arbor Staging System for Hodgkin and Non-Hodgkin Lymphoma,” BioMedInformatics, vol. 3, no. 3, pp. 514–525, 2023, https://doi.org/10.3390/biomedinformatics3030035.
- G. Steinbuss et al., “Deep learning for the classification of non-hodgkin lymphoma on histopathological images,” Cancers (Basel), vol. 13, no. 10, pp. 1–11, 2021, https://doi.org/10.3390/cancers13102419.
- M. Hamdi, E. M. Senan, M. E. Jadhav, F. Olayah, B. Awaji, and K. M. Alalayah, “Hybrid Models Based on Fusion Features of a CNN and Handcrafted Features for Accurate Histopathological Image Analysis for Diagnosing Malignant Lymphomas,” Diagnostics, vol. 13, no. 13, 2023, https://doi.org/10.3390/diagnostics13132258.
- R. Ferjaoui, M. A. Cherni, S. Boujnah, N. E. H. Kraiem, and T. Kraiem, “Machine learning for evolutive lymphoma and residual masses recognition in whole body diffusion weighted magnetic resonance images,” Comput Methods Programs Biomed, vol. 209, p. 106320, 2021, https://doi.org/10.1016/j.cmpb.2021.106320.
- M. R. Reena and P. M. Ameer, “A content-based image retrieval system for the diagnosis of lymphoma using blood micrographs: An incorporation of deep learning with a traditional learning approach,” Comput Biol Med, vol. 145, p. 105463, 2022, https://doi.org/10.1016/j.compbiomed.2022.105463.
- C. Xu et al., “A hybrid few-shot multiple-instance learning model predicting the aggressiveness of lymphoma in PET/CT images,” Comput Methods Programs Biomed, vol. 243, p. 107872, 2024, https://doi.org/10.1016/j.cmpb.2023.107872.
- S. Basu, R. Agarwal, and V. Srivastava, “Deep discriminative learning model with calibrated attention map for the automated diagnosis of diffuse large B-cell lymphoma,” Biomed Signal Process Control, vol. 76, p. 103728, 2022, https://doi.org/10.1016/j.bspc.2022.103728.
- N. Brancati, G. D. Pietro, M. Frucci, and D. Riccio, “A deep learning approach for breast invasive ductal carcinoma detection and lymphoma multi-classification in histological images,” IEEE, vol.7, 2019, https://doi.org/10.1109/ACCESS.2019.2908724.
- Y. Guo, P. Decazes, S. Becker, H. Li, and S. Ruan, “Deep Disentangled Representation Learning of Pet Images for Lymphoma Outcome Prediction,” Proceedings - International Symposium on Biomedical Imaging, pp. 2018–2021, 2020, https://doi.org/10.1109/ISBI45749.2020.9098477.
- D. Li et al., “A deep learning diagnostic platform for diffuse large B-cell lymphoma with high accuracy across multiple hospitals,” Nat Commun, vol. 11, no. 1, 2020, https://doi.org/10.1038/s41467-020-19817-3.
- C. Syrykh et al., “Accurate diagnosis of lymphoma on whole-slide histopathology images using deep learning,” NPJ digital medicine, vol. 3, no. 1, p. 63, 2020, https://doi.org/10.1038/s41746-020-0272-0.
- U. V. Somaratne, K. W. Wong, J. Parry, F. Sohel, X. Wang and H. Laga, "Improving Follicular Lymphoma Identification using the Class of Interest for Transfer Learning," 2019 Digital Image Computing: Techniques and Applications (DICTA), pp. 1-7, 2019, https://doi.org/10.1109/DICTA47822.2019.8946075.
- X. Zhang, K. Zhang, M. Jiang, and L. Yang, “Research on the classification of lymphoma pathological images based on deep residual neural network,” Technology and Health Care, vol. 29, pp. S335–S344, 2021, https://doi.org/10.3233/THC-218031.
- B. Sheng, M. Zhou, M. Hu, Q. Li, L. Sun, and Y. Wen, “A blood cell dataset for lymphoma classification using faster R-CNN,” Biotechnology and Biotechnological Equipment, vol. 34, no. 1, pp. 413–420, 2020, https://doi.org/10.1080/13102818.2020.1765871.
- I. Häggström et al., “Deep learning for [18F]fluorodeoxyglucose-PET-CT classification in patients with lymphoma: a dual-centre retrospective analysis,” Lancet Digit Health, vol. 6, no. 2, pp. e114–e125, 2024, https://doi.org/10.1016/S2589-7500(23)00203-0.
- R. Tambe, S. Mahajan, U. Shah, M. Agrawal, and B. Garware, “Towards designing an automated classification of lymphoma subtypes using deep neural networks,” ACM International Conference Proceeding Series, pp. 143–149, 2019, https://doi.org/10.1145/3297001.3297019.
- S. Rajadurai, K. Perumal, M. F. Ijaz, and C. L. Chowdhary, “PrecisionLymphoNet: advancing malignant lymphoma diagnosis via ensemble transfer learning with CNNs,” Diagnostics, vol. 14, no. 5, p. 469, 2024, https://doi.org/10.3390/diagnostics14050469.
- J. Zhang, W. Cui, X. Guo, B. Wang, and Z. Wang, “Classification of digital pathological images of non-Hodgkin’s lymphoma subtypes based on the fusion of transfer learning and principal component analysis,” Med Phys, vol. 47, no. 9, pp. 4241–4253, 2020, https://doi.org/10.1002/mp.14357.
- A. Haghofer et al., “Histological classification of canine and feline lymphoma using a modular approach based on deep learning and advanced image processing,” Sci Rep, vol. 13, no. 1, pp. 1–15, 2023, https://doi.org/10.1038/s41598-023-46607-w.
- M. U. Nasir et al., “Hematologic Cancer Detection Using White Blood Cancerous Cells Empowered with Transfer Learning and Image Processing,” J Healthc Eng, vol. 2023, no. 1, p. 1406545 2023, https://doi.org/10.1155/2023/1406545.
- N. Kaur and A. Singh, "A Novel Advanced Transfer Learning Based Approach for Leukemia Detection," 2024 International Conference on Cybernation and Computation (CYBERCOM), pp. 415-419, 2024, https://doi.org/10.1109/CYBERCOM63683.2024.10803147.
- M. A. Elaziz et al., “Medical image classification utilizing ensemble learning and Levy flight-based honey badger algorithm on 6G-enabled Internet of Things,” Computational Intelligence and Neuroscience, vol. 2022, no. 1, p. 5830766, 2022, https://doi.org/10.1155/2022/5830766.
- I. N. Muhsen, D. Shyr, A. D. Sung, and S. K. Hashmi, “Machine Learning Applications in the Diagnosis of Benign and Malignant Hematological Diseases,” Clin Hematol Int, vol. 3, no. 1, p. 13, 2020, https://doi.org/10.2991/chi.k.201130.001.
- L. Irshaid et al., “Histopathologic and Machine Deep Learning Criteria to Predict Lymphoma Transformation in Bone Marrow Biopsies,” Arch Pathol Lab Med, vol. 146, no. 2, pp. 182–193, 2022, https://doi.org/10.5858/ARPA.2020-0510-OA.
- C. S. Lisson et al., “Deep Neural Networks and Machine Learning Radiomics Modelling for Prediction of Relapse in Mantle Cell Lymphoma,” Cancers (Basel), vol. 14, no. 8, 2022, https://doi.org/10.3390/cancers14082008.
- J. Uddin, “Attention-Based DenseNet for Lung Cancer Classification Using CT Scan and Histopathological Images,” Designs (Basel), vol. 8, no. 2, 2024, https://doi.org/10.3390/designs8020027.
- Z. Zhong, M. Zheng, H. Mai, J. Zhao, and X. Liu, “Cancer image classification based on DenseNet model,” J Phys Conf Ser, vol. 1651, no. 1, 2020, https://doi.org/10.1088/1742-6596/1651/1/012143.
- J. S. Mohlman, S. D. Leventhal, T. Hansen, J. Kohan, V. Pascucci, and M. E. Salama, “Improving Augmented Human Intelligence to Distinguish Burkitt Lymphoma from Diffuse Large B-Cell Lymphoma Cases,” Am J Clin Pathol, vol. 153, no. 6, pp. 743–759, 2020, https://doi.org/10.1093/AJCP/AQAA001.
- C. Perry et al., “Image-Based Deep Learning Detection of High-Grade B-Cell Lymphomas Directly from Hematoxylin and Eosin Images,” Cancers (Basel), vol. 15, no. 21, 2023, https://doi.org/10.3390/cancers15215205.
- H. E. Achi et al., “Automated diagnosis of lymphoma with digital pathology images using deep learning,” Annals of Clinical & Laboratory Science, vol.49, no.2, 2019, https://www.annclinlabsci.org/content/49/2/153.short.
AUTHOR BIOGRAPHY

| Aghnia Hasya Affan received the Bachelor’s degree in Biomedical Engineering at The Institut Teknologi Sepuluh Nopember (ITS) in 2023. She is currently pursuing a Master’s degree in Biomedical Engineering at Universitas Indonesia focusing on artificial intelligent for medical informatics and health applications. Email: aghnia.hasya31@ui.ac.id |
|
|

| Basari (IEEE member S’05, M'12) was born in Tegal, Central Java, Indonesia, in November 1979. He received the B.E. degree in Electrical Engineering from Universitas Indonesia, Jakarta, Indonesia, in 2002 and the M.E. and D.E. degrees in Electrical Engineering from Chiba University, Japan, in 2008 and 2011, respectively. He worked at Radio Network Planning of PT Indonesian Satellite Corporation Tbk (Indosat Co.Ltd) and Radio Network Operation of PT Telkomsel, Indonesia, from 2003 to 2004. He joined the Faculty of Engineering, Universitas Indonesia, in Sep. 2011 and became a Permanent Faculty Member in 2012. His main interests currently are in the areas of biomedical engineering (informatics, diagnosis, and therapy), microwave medical imaging, MRI system, microstrip antennas, planar arrays, microwave medical devices, radar applications, metamaterials, MIMO antennas, reconfigurable antennas, RFIDs, UWB antennas, nano-satellite, microwave circuits, reflectarray, mobile satellite antennas. Dr. Basari was secretary of the IEEE MTT/AP Indonesia Chapter from 2012 to 2015. In 2016 and 2017, he was vice-chair of IEEE MTT/AP-S Joint Chapter Indonesia Section. Starting from 2018 to 2019, he serves as Chair of IEEE MTT/AP-Society Joint Chapter Indonesia Section. He has been General Chair of the International Symposium on Biomedical Engineering (ISBE) 2016. He was the principal editor for the IEEE publication of Quality in Research (QiR) 2017. He is also involved in some technical conferences and a national journal in the area of Engineering and Technology. He was Managing Editor of Makara Journal of Technology from 2016 to 2018. Now, he has been Editor in Chief in the same Journal (Makara Journal of Technology, Universitas Indonesia) since 2018. From 2018 to 2021 and 2022-present, he also serves as a Head of Biomedical Engineering Programs in the Department of Electrical Engineering, UI. He was a recipient of IEEE AP-Society Japan Chapter Young Engineer Award, Who’s Who in the World, Dean Award of Chiba University, APRASC-URSI Young Scientist Award, the 2015 QiR Best Paper Award, FTUI Dean for Covid-19 Product Innovation, Product license, royalty, and UI Rector Award for commercial product’s royalty, in 2010, 2011, 2011, 2013, 2015, 2020, 2021, 2022, and 2023 respectively. Email: basari.st@ui.ac.id Orcid: https://orcid.org/0000-0002-5608-0893 |
Aghnia Hasya Affan (CNN-Based Transfer Learning Models for Histopathological Detection of Non-Hodgkin Lymphoma on Histopathological Images)