ISSN: 2685-9572 Buletin Ilmiah Sarjana Teknik Elektro
Vol. 8, No. 2, April 2026, pp. 488-503
Adaptive Feature Selection using Fisher-Based Supervised Hill Climbing for Dysgraphia Handwriting Classification
Kartika Candra Kirana 1, Anik Nur Handayani 1, Nur Eva 2, Aji Prasetya Wibawa 1,
Wahyu Nur Hidayat 3, Kohei Arai 4
1 Department of Electrical Engineering and Informatics, Universitas Negeri Malang, Malang, East Java, Indonesia
2 Faculty of Psychology, Universitas Negeri Malang, Malang, East Java, Indonesia
3 Graduate Institute of Digital Learning and Education, National Taiwan University of Science and Technology, Taipei, Taiwan
4 Science and Engineering Faculty, Saga University, Saga, Japan
ARTICLE INFORMATION |
| ABSTRACT |
Article History: Received 17 October 2025 Revised 02 April 2026 Accepted 25 April 2026 |
| 
Dysgraphia features selection remains a challenge. Fisher’s criterion excels at highlighting the discriminative features of dysgraphia but lacks guidance for choosing the optimal number of features. Whereas Hill Climbing shows robust feature selection but often gets trapped in local optima. This study aims to avoid the Hill Climbing trap in local optima when selecting the best dysgraphia feature. Thus, the Fisher-Based Supervised Hill Climbing (FSHC) method is introduced. The contribution of this study is an optimized machine-learning-guided hill-climbing method that uses a classifier on a validation set as the objective function. A plateau mechanism also guided Hill Climbing exploration, not by a single Fisher point but by the neighboring subsets. The dataset used contains the graphomotor slant line task from 119 children aged 8-15 years (47.5% diagnosed with dysgraphia), with 10000 to 50000 data points per user. It is organized into kinematic, spatial, dynamic, and temporal features, yielding 117 sub-features. A stratified 5-fold cross-validation is set for training and testing, reaching 21 features. Comparative test—Linear SVM, SVM RBF, Sigmoid SVM, Polynomial SVM, Random Forest, AdaBoost, KNN, Decision Tree, Gradient Boosting, Gaussian Naive Bayes, and Gaussian Classifier—showed that linear SVM achieves the best performance with a weighted average precision, recall, and F1 score of 0.93. Linear SVM also outperformed the three approaches: no feature selection, the traditional Fisher, and machine-learning-based feature selection (weighted KNN and SVM). It can be concluded that the proposed method is more robust than the state of the art by highlighting key points for avoiding overfitting. |
Keywords: Feature Selection; Hill Climbing; Fisher’s Criterion; Dysgraphia; Online Handwriting |
Corresponding Author: Anik Nur Handayani, Department of Electrical Engineering and Informatics, Universitas Negeri Malang, Malang, East Java, Indonesia Email: aniknur.ft@um.ac.id |
This work is open access under a Creative Commons Attribution-Share Alike 4.0 
|
Document Citation: K. C. Kirana, A. N Handayani, N. Eva, A. P. Wibawa, W. N. Hidayat, and K. Arai, “Adaptive Feature Selection using Fisher-Based Supervised Hill Climbing for Dysgraphia Handwriting Classification,” Buletin Ilmiah Sarjana Teknik Elektro, vol. 8, no. 2, pp. 488-503, 2026, DOI: 10.12928/biste.v8i2.14983. |
- INTRODUCTION
A neurological condition that can impair learning is defined as a specific learning disorder (SLD) [1]. Dysgraphia is one category of SLD that is rarely studied [2]. The rare exploration due to practical barriers that require expert assessment, such as dyslexia associations and acquisition tools that involve pressure, time, and pen-movement sensors [3]. However, it is often found in childhood [4]. The dysgraphia case is increasing significantly, with 14 to 20 % of the school-age population suffering from SLD [5]. Dysgraphia specifically results from visual-motor impairments, leading to writing difficulties and an uneven handwriting pattern [6]. Dysgraphia is important to detect early because it is an indication of neurodevelopmental disorders, such as autism [7], Parkinson’s [8], and ADHD [9], although not displaying physical disabilities [10]. Other learning disorders, such as dyspraxia [11][12] and dyslexia [13][14], often exacerbate dysgraphia symptoms. Early recognition of learning disorders, particularly dysgraphia, can lead to obtaining appropriate treatment [15]. It also maintains learner psychology [16] and avoids mental health disorders [17].
The Beknopte Beoordelingsmethode voor Kinderhandschriften [18], also known as the BHK test [19], is one of the most widely used methods for assessing indications of dysgraphia [20]. This manual pen-and-paper test requires an expert to evaluate not only the construction [21] and time of writing [22], but also the consistency of handwriting [23]. A dependency on diagnostic experts leads to high diagnostic costs [24]. Digitalization of dysgraphia tests is equivalent to the improvement of a handwriting acquisition tool [25], such as the stylus [26] and tablets [27]. In addition to relying on test tools, the assignment of the BHK test is also a concern. There is one task of the various BHK tests that has been published publicly, namely, the graphomotor slant line task [28]. The graphomotor slant line task measures the slope of a handwriting line, simulating fine motor control during writing [29]. The graphomotor slant line captures the spatial, temporal, dynamic, and kinematic aspects of handwriting [30]. Previous research shows that the graphomotor slant line of online handwriting enables analysis of writing time and the observation of pen pressure, which cannot be recognized in offline handwriting and other features [31]. Nevertheless, differences in writing pressure between paper and tablets require further study [32]. Moreover, online handwriting acquisition yields thousands of raw sensor points per test, necessitating robust feature representation to interpret handwriting characteristics [33].
Public dysgraphia datasets pose a challenge, leading to limited performance in dysgraphia classification [34], as reflected in the largely private dysgraphia datasets shown in Table 8. Moreover, recognizing dysgraphia in online handwriting using the graphomotor slant line is challenging because the task is more complex. The graphomotor slant line task achieves robust performance on most private data [35]. J. Kunhoth et al. (2023) showed that combining online handwriting features increased detection accuracy up to 80.8% [36], whereas J. Škunda et al. (2022) achieved 79.7% accuracy using eye movement [37]. In contrast, its performance degrades on most public data. Drotár & Dobeš (2020) demonstrated that the enormous challenge of the sentence task yielded an accuracy of 69.7%, which was similar to the graphomotor slant line [38]. J. Kunhoth et al. (2025) also demonstrated that combining multiple-instance aggregate features yielded the worst accuracy (61.89%) on complex sentence features compared with simpler word features (64.62%) [32]. The robust performance was achieved on most private data, whereas its performance degrades on most public data. This finding emphasizes that the main problem is not the modality of the online features used, but rather the greater complexity of public data assignments.
The biggest challenge in detecting dysgraphia through graphomotor slant line task is selecting the appropriate feature from thousands of raw data points [39]. Dechamps et al. (2021) identified potential features using Fisher’s criterion, yielding 15 of 90 features with 83% balanced accuracy on sentences resembling the graphomotor slant line task [19]. However, the best Fisher’s number is highly dependent on the researcher. There is no automatic method for selecting the optimal number of features, leading to manual selection that requires extensive trial and error [40].
Several researchers have demonstrated the potential of Hill Climbing as a heuristic for feature selection. L. Cornei et al. (2023) developed a hill-climbing approach that improves feature extraction solutions by up to 85% without supervision by eliminating redundant features on textual sub-datasets [41]. A. Naskar et al. (2023) demonstrated that the combination of Hill Climbing in Harmonic Search produces better feature representations by mutating the features [42]. The results of these studies show that Hill Climbing outperforms Particle Swarm Optimization, achieving up to 100% accuracy in medical data. Although the two studies applied Hill Climbing to different problems, they share a similar philosophy for stopping the search when it reaches a peak like climbing a mountain. Despite its superior performance, the Hill Climbing method often gets trapped in local optima [43]. Supervised learning is needed as a monitoring mechanism in the feature selection to overcome the weaknesses of Hill Climbing. L. Devillaine et al. (2021) demonstrated the potential of machine learning for feature selection, showing that linear SVMs were superior to traditional trees, achieving an accuracy of 70.8% [34]. They inspired the modification of the search strategy from greedy hill-climbing to backtracking. An adapted fixed-deterministic algorithm also performs to avoid instability from a random initialization [44].
This study focuses on overcoming the feature challenges of the graphomotor slant line task. Fisher’s criterion excels at measuring each feature’s ability to distinguish among classes. According to the research problem, there is no guidance on the optimal number of features to use. On the other hand, Hill Climbing shows excellent potential as a greedy heuristic for feature selection, but it often gets trapped in local optima, creating a research gap. Therefore, this study proposes adaptive selection using Fisher-based Supervised Hill Climbing (FSHC) as the first hybrid feature selection for classifying dysgraphia from online handwriting. This study contributes an optimized machine-learning-guided hill-climbing method that uses a classifier on a validation set as the objective function. Machine learning is designed as a supervised approach, a classifier’s performance on a validation set as the guiding objective function, to avoid Hill Climbing from getting trapped in local optima while searching for the best number of Fisher’s criterion. The most compatible classifier in the proposed method requires further investigation. We also added a plateau mechanism to accommodate minor fluctuation across neighboring subsets. The research questions asked in this study are as follows:
- RQ1. How can the online handwriting feature of the graphomotor slant line task classify dysgraphia?
- RQ2. How does the Fisher-based Supervised Hill Climbing (FSHC) select dysgraphia handwriting features adaptively?
- RQ3. How does the FSHC method avoid local optima traps?
- RQ4. How does the FSHC method compare to conventional feature selection?
- RQ5. How does the FSHC method compare to supervised feature selection?
- METHODS
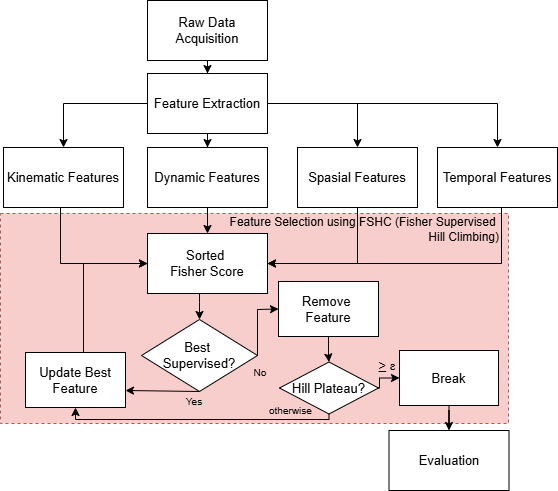
This chapter discusses the dataset and methodology used to diagnose dysgraphia, as depicted in Figure 1. The process begins with collecting raw data, which is then extracted into several types of features: kinematic, dynamic, spatial, and temporal. Afterward, the FSHC (Fisher-Based Supervised Hill Climbing) method is used to select the most relevant features. The selected features are used during training of the classification model to test their ability to recognize patterns. If the features achieve optimal performance, the process proceeds to the evaluation stage, using metrics such as precision, recall, and F1 Score. More specific explanations are outlined in each sub-chapter.
Figure 1. A Proposed Dysgraphia System Framework
- Dataset
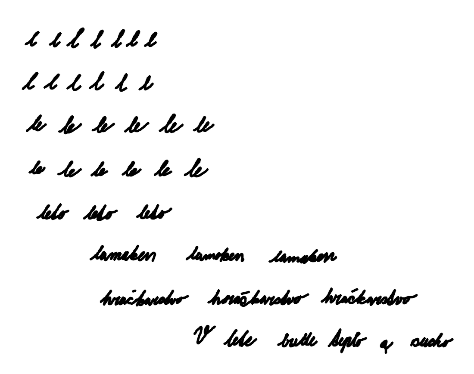
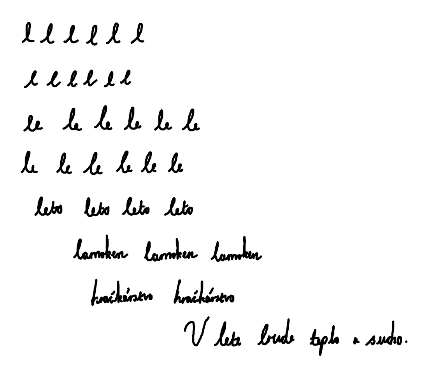
Figure 1 shows that the first step is acquiring raw data. We used the Sci_Rep dataset, which contains the graphomotor slant line task, as shown in Figure 2 [38]. The data consists of 119 children aged 8-15 years. Thirteen percent of the children were left-handed, while 87% were right-handed. Participants consisted of 34.1% girls (41 out of 120 children) and 65.9% boys (79 out of 120 children). 47.5% (57 children) were diagnosed with dysgraphia (Figure 2(a)), while 52.5% (63 children) were not (Figure 2(b)). Each child had approximately 10000–50000 raw data points, comprising seven parameters: x, y, time, pen status, azimuth, altitude, and pressure. We employ stratified 5-fold cross-validation for training and testing to prevent biased estimates.
| 
|
(a) | (b) |
Figure 2. Visualization of tabular Sci Rep Dataset [38] (a) Dysgraphia (b) Normal
- Feature Extraction
We extract 117 sub-features from seven parameters (x, y, time, pen status, azimuth, altitude, and pressure). There were four feature categories: 63 kinematic features, 30 spatial features, 14 dynamic features, and ten temporal features, as shown in Table 1. Kinematic features describe the characteristics of writing movements [45]. Spatial features describe the position and shape of writing in two-dimensional space [46]. Dynamic features describe changes in movement [47]. Temporal features describe the duration of writing [48]. The combination of four features reflects a graphomotor assessment of writing quality and speed, the main criteria of the BHK test [49]. Some features are divided into several statistical features, such as mean, median, maximum, minimum, standard deviation, 95th percentile, and 5th percentile [27].
Kinematic features consist of pen tilt, velocity, acceleration, and jerk [50]. Equation (1) shows that the total velocity ( ) is the change in coordinate position (
 ) and (
 ) over time (
 ). The change of the x and y coordinates over time () results in horizontal velocities (
 ) and vertical velocities (
 ), respectively, as shown in Equation (2) and Equation (3).
Acceleration ( ) describes the change in the movement of the writing pen. Each change in velocity () over time () sequentially produces horizontal (
 ) and vertical acceleration
  ) as shown in Equation (4) and Equation (5). The combination of the two accelerations yields the total acceleration, as calculated in Equation (6).
Jerk ( ) describes the irregularity of handwriting. Each rate of change of acceleration () with respect to time () sequentially produces horizontal and vertical jerk as shown in Equation (7) and Equation (8). The combination of vertical and horizontal jerk shows the total jerk calculated using Equation (9).
The spatial feature consists of several components: stroke, the difference between the first and last stroke ( ) based on position , and the line geometric [51]. There are three types of strokes: vertical stroke (
 ), horizontal stroke (
 ), and total stroke (
 ). Equation (10) shows the total stroke, while Equation (11) and Equation (12) show the horizontal and vertical segments partially. Based on Equation (10) to Equation (12), stroke is the difference between i and i+1 coordinates of the x and y axes. In contrast, the feature-dfls represents the difference between the final (
 and
and  ) and initial coordinates (
 and
and  ) on the and axes, as shown in Equation (13). The geometric line is derived from the line's width and height segments. The width and height segments are calculated based on the size of the handwritten character.
Dynamic features present the interaction of physical and sensorial aspects during writing [52]. It includes the parameters pressure, altitude, azimuth, and extreme local. Unlike kinematic features, which often contain many extreme outliers, pen orientation (altitude and azimuth) adapts to device characteristics rather than writing style. Therefore, granularization by percentile is unnecessary because the values tend to remain stable within a single writing task. Thus, there are only four derivative features, namely Mean, Maximum, Minimum, and Standard Deviation. Figure 3 shows the distributions of Altitude and Azimuth. Meanwhile, the local extreme is decomposed into nine sub-features because it is correlated with velocity and acceleration. In acceleration and velocity, local extremes show acceleration spikes (maximum) and a minimum on both. The temporal feature described the total duration, such as the time required to write [53]. The completion of a single segment is referred to as segment duration, while the total time until the end of the activity is called total duration. Total distance is also declared to measure the length of writing. In addition, Pen lift is measured as an on-air surface feature that calculates the time the stylus is lifted from the tablet surface.
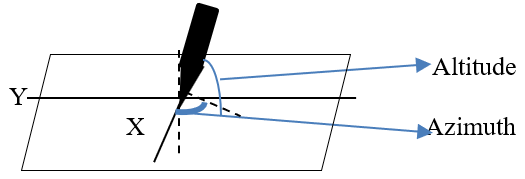
Figure 3. Altitude and Azimuth Visualization
Table 1. Feature Extraction
Category | Feature | Sub Feature |
Kinematic | Total Velocity, Total Jerk, Total Acceleration, Horizontal Velocity, Horizontal Jerk, Horizontal Acceleration, Vertical Velocity, Vertical Jerk, Vertical Acceleration | Mean, Median, Maximum, Minimum, Standard Deviation, 95th percentile, and 5th percentile |
Spatial | Stroke Length, Horizontal Stroke Length, Vertical Stroke Length, Difference First and Last Stroke (Y Position), | Mean, Median, Maximum, Minimum, Standard Deviation, 95th percentile, and 5th percentile |
Width Segment, Height Segment | Not derived in sub-features |
Dynamics | Local Extreme in Velocity, Local Extreme in Acceleration | Not derived in sub-features |
Pressure, Altitude, Azimuth | Mean, Maximum, Minimum, Standard Deviation |
Temporal | Segment Duration | Mean, Median, Maximum, Minimum, Standard Deviation, 95th percentile, and 5th percentile, sum- |
Total Duration, Total Length, Pen Lift | Not derived in sub-features |
- Feature Selection Method using Fisher-Based Supervised Hill Climbing
The purpose of this study is to develop an adaptive feature selection method that combines Fisher Score and the Hill Climbing algorithm, referred to as Fisher-Based Supervised Hill Climbing (FSHC). The Fisher Score serves as a filter stage, calculating each feature’s discriminatory power for the target class. Hill Climbing functions as a wrapper stage, performing a local search to identify the optimal feature combination from the Fisher ranking based on the classification model’s accuracy. Table 2 shows FSHC pseudocode. According to Table 2, the input is a feature matrix  , with n samples, m features, and an output matrix (). We adopted the deterministic hill climbing that improves the fixed starting strategy [44]. We use the highest SVM accuracy as the supervised score (
 ) to achieve the best feature map (
 ). A plateau mechanism also guided Hill Climbing exploration, not by a single Fisher point but by a wide range of them. The Fisher criterion is an objective function of Hill Climbing, as shown in Equation (14).
| 
| (14) |
| 
| (15) |
According to Equation (14), the Fisher score ( ) illustrates the discriminant function used to distinguish between classes based on the average (
 ) of feature
  across all samples. It refers to the number of samples (
 ) in class
  . In this study,
  , corresponding to the two classes in the dataset: dysgraphia and normal. Then the Fisher scores were sorted by the highest values of feats to be an initial subset of features (
 ), as shown in Equation (15).

| (16) |
Based on Equation (16), each sorted feature ( are validated by the Hill Climbing supervision function. The supervised score (
 ) is the accuracy of the classification model (
 ) trained on the feature subset
  and the dysgraphia label (). For each fold, the model is trained on the training split and evaluated on the corresponding validation split. The comparison of the supervised model is discussed in Sub-section 2.4.

| (17) |
Based on Equation (17), the highest-ranked features () are added as if supervision accuracy () improves; otherwise, they are removed as and . The plateau parameter ( ) with predefined tolerance (
 ) is applied to accommodate minor fluctuation across neighboring subsets. A plateau with a threshold
  is observed to obtain the best solution and prevent a non-optimal solution.
Table 2. Proposed Pseudocode
- Evaluation
A series of evaluations is used to measure the performance of the proposed method. The first scenario is observing the best supervised function and the plateau mechanism. Hyperparameter settings using default settings are shown in Table 3. Each of these parameters has a specific role in controlling model accuracy and computational efficiency. The second test compares the proposed method with conventional and machine-learning-based feature selection methods from prior studies, as shown in Table 4. We compare it with the baseline feature-extraction method that did not use feature selection, which classified 175 features using AdaBoost [49]. Whereas a Fisher-based feature selection method without a supervised method is also compared [19]. The compared method is highly dependent on the researcher and lacks an automated method for selecting the optimal number of features, resulting in manual feature selection that requires extensive trial and error. Table 4 also compares the proposed method and machine-learning-based feature selection, which consists of weighted KNN [38] and an SVM-based feature selection [34]. These four comparisons are chosen because they were applied to the same BHK tests. The evaluation metrics used to measure classification performance are accuracy, precision, recall, and F1 score, as shown in Equation (18) to Equation (22).
Based on Equation (18) to Equation (22), the metric evaluation involves four parameters: true positives ( ), true negatives (
 ), false positives (
 ), and false negatives (
 ), each of which depends on the diagnosis (
 ). TP represents correctly detected diagnoses in the positive class, while indicates correctly detected diagnoses in the negative class. indicates an error in detecting the diagnosis class, while indicates an error in detecting the opposition class. Accuracy is the ratio of correct detections to the total number of data points. Precision is the ratio of correctly detected results to all data in a particular diagnostic class. In contrast, Recall is the ratio of correct diagnoses to the total amount of data in that diagnostic class. The balance between recall and precision is measured using the F1 score. The measurement matrix for each evaluation (
 ) computes a weighted average of class weights to quantify the imbalance in the probabilities of samples () relative to the total data (
 ) for each class (), as shown in Equation (22).
Table 3. Hyperparameter of Comparison Feature Supervised Function
Model | Hyperparameter | Value |
SVM b
| Kernel | {RBF [19], linear [36], polynomial [54], sigmoid [55]} |
C | 1.0 |
Gamma a | Scale |
Coefficient a | {0,1} |
Random Forest b (RF) [34], AdaBoost b [47] | N estimators | {200} |
K-Nearest Neighbors (KNN) [38] | N neighbors | {5, 10} |
Metric | {'Euclidean', 'Manhattan'} |
Decision Tree b (DT) [56] | Max depth | {None, 5, 10} |
Gradient Boosting b (GB) [57] | N estimators | 100 |
Learning rate | 0.1, 0.01 |
Gaussian Naive Bayes (GNB) | Var Smoothing | 
|
Gaussian Classifier (GRBF) b | Kernel | RBF |
a RBF and a Polynomial only, b Model uses 42 Random states |
Table 4. Feature Extraction Comparison
Approaches | Feature Extraction | Classifier |
Conventional Feature Selection | Without Feature Extraction [49] | AdaBoost |
Fisher [19] | SVM RBF |
Machine Learning-based Feature Selection | Weighted KNN [38] | Random Forest |
SVM-based selection feature [34] | Random Forest |
The proposed method | FSHC | Linear SVM |
- RESULT AND DISCUSSION
This chapter presents the results and discussion of: (1) feature characteristics as dysgraphia knowledge, (2) plateau and supervised function of FSHC, (3) comparison of FSHC with conventional feature selection, (4) comparison of FSHC with machine learning-based feature selection, and (5) limitations and challenges.
- Online Handwriting Features in Graphomotor Slant Line Task as a Dysgraphia Knowledge
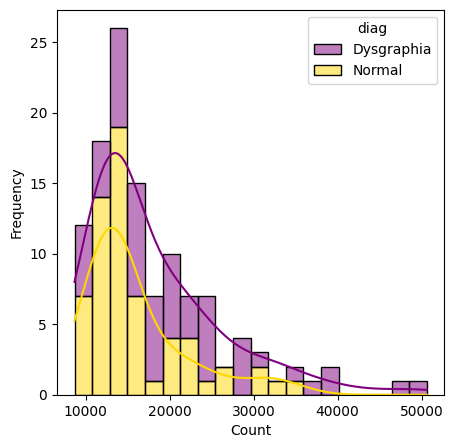
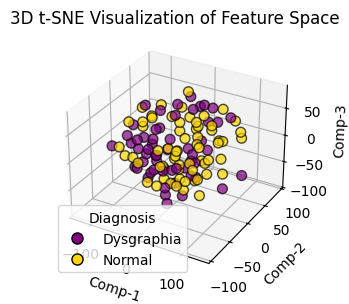
This section presents a comprehensive analysis of the validity of the dysgraphia knowledge. The first test is expected to answer how the online handwriting feature of the graphomotor slant line task can classify dysgraphia. In this context, the conceptual framework is epistemologically assessed to determine whether the features construct the dysgraphia knowledge. This approach aims not only to build an accurate dysgraphia classification model but also to understand the empirical patterns of individual behavior during writing. From an epistemological perspective, the features extracted from the writing process reflect empirical representations of an individual’s cognitive and neuromotor activities. In other words, each kinematic (such as speed or acceleration), dynamic (pressure or change in movement), spatial (direction, angle, or distribution of positions), and temporal (time per movement or sequence of actions) features have a digital trace of the physical processes that occur during writing. Through a systematic analysis of these features, this study identifies distinctive patterns that consistently distinguish individuals with dysgraphia from neurotypical individuals. Therefore, histogram analysis of the raw data and t-SNE (t-distributed stochastic neighbor embedding) as a visualization of feature reduction, as shown in Figure 4(a) and Figure 4(b). Both visualizations are used to understand characteristic patterns of dysgraphia. Figure 4 presents the statistics recorded during a single BHK test for each participant.
According to Figure 4(a), typically developing children typically show peaks at lower raw data values (around 10,000-30,000) and at higher frequencies. In comparison, the dysgraphia shows a broader distribution, peaking at higher values (around 10000-50000). The overlapping ranges in Figure 4(b) suggest that raw data does not distinguish between the two classes. The smoothed kernel density curve further highlights this difference, indicating that individuals with dysgraphia tend to have higher and more variable raw data values, suggesting the need for more detailed feature extraction and analysis to improve classification accuracy.
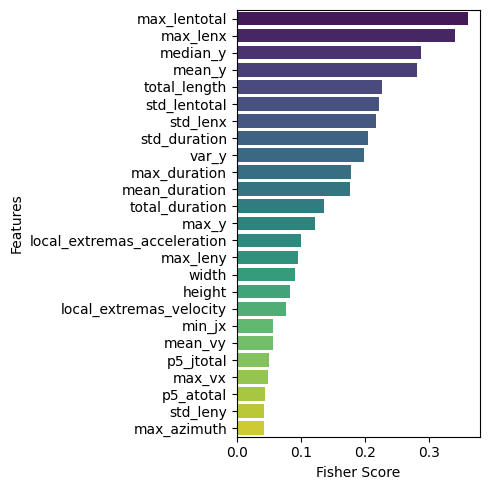
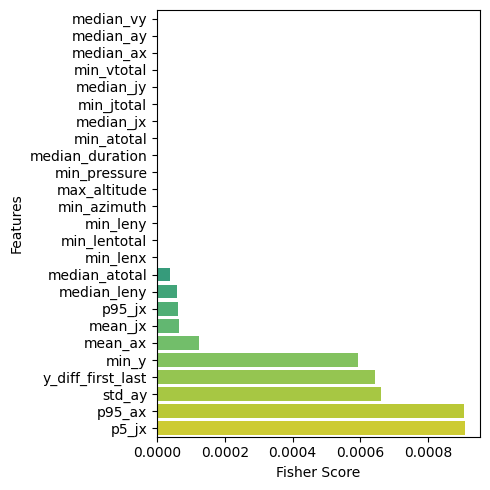
Figure 5 visualizes the 25 highest and lowest Fisher Score features. The Fisher Score is a measure used to assess how effective a feature is at distinguishing between target classes in a dataset. Features with higher Fisher Score values are considered more relevant in separating those classes. Features with high Fisher Score values can be the primary focus in model development. In contrast, features with lower scores may be less beneficial and can be considered for removal or lower weighting in further analysis. As in Figure 5(a), temporal and spatial features dominate, including the maximum total length (max_lentotal), the maximum length along the axis (max_lenx), and the median position on the  axis (median_y). Meanwhile, Figure 5(b) shows a weak kinematic feature, indicated by an acceleration in velocity along both the and axes. The results indicate that spatial and temporal features are the dominant features in the online graphomotor slant line task for classifying dysgraphia.
| 
|
(a) | (b) |
Figure 4. Sci_Rep Raw Data Histogram (a) Histogram 'Count Raw data' (b) t-SNE
| 
|
(a) | (b) |
Figure 5. Fisher Reach per Feature (a) Top 25 (b) Bottom 25
- Plateau and Kernel of Fisher-Based Supervised Hill-Climbing
The second evaluation was used to understand how the Fisher-based Supervised Hill Climbing (FSHC) method works as an adaptive feature selection approach for detecting dysgraphia from online handwriting. The Hill Climbing method functions as a wrapper stage, performing a local search to identify the optimal feature combination. The Fisher score is used as the objective function in hill climbing to assess a feature’s discriminative ability for the target class. A supervision function is added to the proposed method through machine learning. We also added a plateau to accommodate minor fluctuation across neighboring subsets.
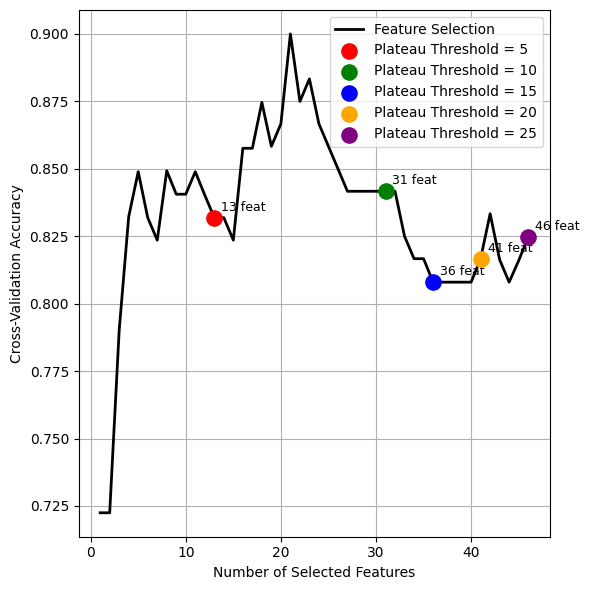
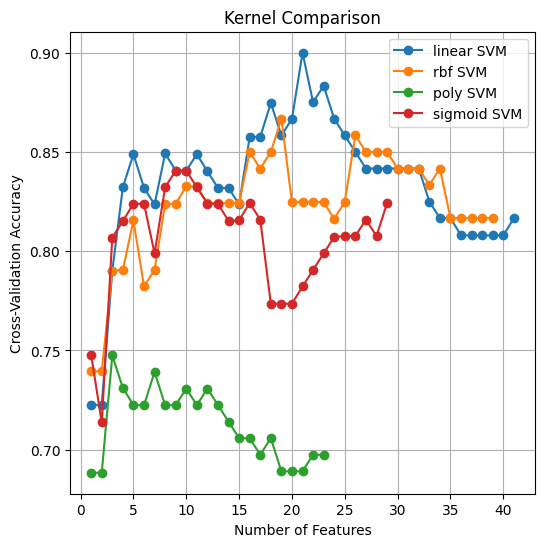
Figure 6 shows the hyperparameter observations, consisting of the plateau and the kernel used. Figure 6(a) shows the accuracy of FSHC, compared with the plateau threshold, when using SVM as the baseline supervision. Figure 6(a) shows that FSHC converges to a local optimum in 13 steps with a plateau threshold of 5. Setting the plateau threshold to 10 yields a global optimal with 31 steps and 21 best features (Figure 6(b)), whereas higher thresholds produce more steps and additional features without improving accuracy (Figure 6(b)). We compare the kernel used in the feature-supervision function with FSHC performance. Four kernels were compared: RBF, Polynomial, Sigmoid, and Linear, as shown in Figure 6(b). These test results indicate that Fisher-based Supervised Hill Climbing (FSHC) is highly dependent on the supervision function. SVM with a linear kernel consistently outperformed SVMs with RBF, polynomial, and sigmoid kernels. The second finding confirms that Fisher-Based Supervised Hill Climbing (FSHC) achieves superior performance in dysgraphia cases, supported by 21 optimal features dominated by spatial and temporal features, and an optimal plateau threshold of 10. It shows great potential for developing offline and online handwriting features, as most selected features correspond to spatial and temporal features. The combination of spatial and temporal features indicates the potential to create online and offline handwriting features in the future.
| 
|
(a) | (b) |
Figure 6. FSHC’s Supervised Function Accuracy (a) Plateau Comparison (b) Kernel Comparison
- Machine Learning as a Supervision Function of Fisher-Based Supervised Hill-Climbing
The third evaluation assesses the accuracy of Fisher-based Supervised Hill Climbing (FSHC) and explains how supervised machine learning avoids local optima. After obtaining an SVM model with a linear kernel as the FSHC supervision function, we compared other machine learning methods. Table 5 compares the evaluation results of machine learning as a supervision function for Fisher-Based Supervised Hill Climbing. Table 5 confirms that the linear SVM performs best among the others. The Gaussian RBF performs the worst among the others. However, other measures need to be explored further to assess overall performance. Other models, such as AdaBoost, Random Forests, KNN, Decision Trees, and Gradient Boosting, showed accuracies between 0.79 and 0.84. Gaussian Process with RBF kernel showed the lowest performance, indicating it is not suitable for application in this scope, because Gaussian predicts based on a covariance function that maximizes the log-marginal likelihood (LML), so that this function is non-convex and easily trapped in local optima on small data, influenced by the initialization of guesses from parameters. This causes the Gaussian Process to become trapped in local optima during feature selection, leading to overfitting. In contrast, the linear kernel's stability suggests it is better suited to this task due to its robustness and interpretability. This third finding confirms that the high accuracy of the FSHC method depends on backtracking in the linear SVM to avoid local optima, unlike the random search used by greedy hill climbing.
Table 5. FSHC’s Evaluation Matrix (Feature Supervised Function Comparison)
Metric | Feature FSHC Supervised Function |
SVM Linear | RF | Ada Boost | KNN | DT | GB | GNB | GRBF |
Iteration / Best Feature | 41/21 | 26/6 | 36/17 | 33/13 | 26/6 | 27/9 | 30/9 | 24/3 |
Max Accuracy | 0.90* | 0.82 | 0.84 | 0.82 | 0.79 | 0.79 | 0.79 | 0.52 |
Precision | Normal | 0.94* | 0.81 | 0.81 | 0.76 | 0.78 | 0.75 | 0.77 | 0.53 |
Dysgraphia | 0.92 | 0.84 | 0.88 | 0.95 | 0.82 | 0.86 | 0.85 | 0.00 |
Recall | Normal | 0.95* | 0.87 | 0.90 | 0.97 | 0.86 | 0.90 | 0.89 | 1.00 |
Dysgraphia | 0.91* | 0.77 | 0.77 | 0.66 | 0.73 | 0.66 | 0.70 | 0.00 |
F1-Score | Normal | 0.94* | 0.84 | 0.86 | 0.85 | 0.82 | 0.82 | 0.82 | 0.69 |
Dysgraphia | 0.93* | 0.80 | 0.82 | 0.78 | 0.77 | 0.75 | 0.76 | 0.0 |
Weighted average | Precision | 0.93* | 0.82 | 0.84 | 0.85 | 0.80 | 0.80 | 0.81 | 0.28 |
Recall | 0.93* | 0.82 | 0.84 | 0.82 | 0.80 | 0.79 | 0.80 | 0.53 |
F1 Score | 0.93* | 0.82 | 0.84 | 0.82 | 0.80 | 0.79 | 0.80 | 0.37 |
* The result is the best performance |
- Comparison of Fisher-Based Supervised Hill-Climbing and Feature Selection Method
The fourth evaluation compares FSHC and conventional feature selection methods. The SVM model with a linear kernel was shown to be consistent with other machine learning models across FSHC supervision levels. In this study, two approaches were used as comparators: one that applied no feature extraction and the other that used conventional Fisher with feature initialization, which is shown in Table 6. Based on Table 6, using many features does not guarantee optimal classification results. Conversely, using Fisher without the best-feature guidance produces more noise, making it harder for the classifier to recognize features. Compared with the use of 175 features in Table 6, which achieves an accuracy of up to 0.80, this demonstrates the potential for better feature selection than using unextracted features. In addition, the classifier plays a significant role. This is shown by comparing this study, which applied SVM with an RBF kernel to the 15 best Fisher features (Table 6), with the same accuracy, namely 0.86. Therefore, the FSHC feature selection method achieved the highest balanced accuracy, precision, and recall, outperforming conventional methods.
Table 6. Comparison of the FSHC Method and Conventional Feature Selection
Model | Feature Selection | Number of Features | Accuracy | Precision | Recall | F1-Score |
J. Kunhoth et al. (2023) [49] | - | 175 | 0.80 | 0.83 | 0.78 | 0.80 |
L. Deschamps et al. (2021) [19] | Fisher | 15 | 0.86 | - | 0.81 | - |
The Proposed Method | FSHC | 21 | 0.93 | 0.93 | 0.93 | 0.93 |
- Comparison of Fisher-Based Supervised Hill-Climbing and Supervised Feature Selection Method
The fifth evaluation compares the results of FSHC and the supervised feature selection method. After obtaining an SVM model with a linear kernel as the FSHC supervision function, we compared other machine learning methods in Table 7. According to Table 7, the proposed method outperforms in terms of the balance between recall and precision. Compared to Weighted KNN and SVM-based feature selection, both yield smaller feature sets. However, the compared method tends to get stuck in local optima, resulting in lower accuracy. Nevertheless, the proposed method produces 21 features from 117, resulting in a significant performance loss that can be compensated for across all metrics. Therefore, the FSHC feature selection outperforms supervised feature selection methods.
Table 7. Comparison of the FSHC Method and Machine Learning-based Feature Selection
Feature Extraction | Number of Features | Accuracy | Precision | Recall | F1-Score |
Weighted KNN [38] | 3 | 0.75 | 0.77 | 0.74 | 0.76 |
SVM-based selection feature [34] | 9 | 0.73 | 0.75 | 0.71 | 0.73 |
FSHC (Proposed Method) | 21 | 0.93 | 0.93 | 0.93 | 0.93 |
- Limitations and Challenges of Dysgraphia Research
The standard Hill Climbing performed poorly primarily due to its random initialization, which often leads the search to converge to suboptimal local optima in a high-dimensional feature space. Thus, FSHC uses a Fisher-based deterministic initialization, providing a more informative starting point. Although reach the high accuracy, this study has several weaknesses. The proposed method reaches higher computational complexity in  , as much as the total number of features (
 ), the total number of folds of cross-validation (
 ), and the supervision cost (). Furthermore, Figure 4 shows an excessive number of iterations after the optimal peak is reached. A large plateau increases the excessive iterations, while a small plateau can trap the proposed method in a local optimum. Thus, the plateau mechanism should be considered using other heuristic models for future work. In addition, small datasets require augmentation techniques to improve dysgraphia perception [58], especially when testing on low-resolution images or multi-background conditions [59].
Table 8 poses a challenge for publicly available datasets, as four of the five datasets were published privately. It also elaborates on the dominance of binary classification for dysgraphia. The improved classification of multi-class dysgraphia is a challenge for further research. In addition, the results show that the 21 best features comprise 15 spatial and 6 temporal features. Most features are dominated by spatial and temporal, indicating that the method can be optimized by using two approaches: online and offline handwriting.
Table 8. Binary Classification Dataset Comparison
Authors | Category | Demography | Participant |
G. Dimauro et al. (2020) [60] | Private | 2–5 Grades | 109 |
Drotár & Dobeš (2020) [38] | Public | 8–15 years | 120 (57 dysgraphia, 63 normal) |
B. Manimekala et al. (2025) [61] | Private | 6 - 8 years | 150 |
F. Masood et al. (2023) [62] | Private | 8–11 years | 200 |
L. Deschamps et al. (2021) [19] | Private | 2–5 Grades | 580 (122 Dysgraphia, 362 Normal) |
- CONCLUSIONS
The study demonstrated a novel method (FSHC) for dysgraphia detection using a publicly available graphomotor dataset. The Fisher-based Supervised Hill Climbing (FSHC) selects features based on the Fisher score. The Hill Climbing method is an adaptive feature selection approach that proposes two strategies to avoid local optima: the plateau mechanism to accommodate minor fluctuations across neighboring subsets, and SVM with a linear kernel, used as a supervised approach on a validation set, as the objective function. A comparison of Linear SVM, RBF SVM, Sigmoid SVM, Polynomial SVM, RF, AdaBoost, KNN, Decision Tree, Gradient Boosting, Gaussian Naïve Bayes, and Gradient RBF showed that Linear SVM achieved the highest performance, performing hill climbing in a supervised setting and achieving a 0.93 weighted average of precision, recall, and F1 score. The comparison of the FSHC method showed that its features were superior to those of two conventional feature selection methods and two machine-learning-based methods. We concluded that the proposed method supervised the selection of the optimal number of Fisher features, achieving a higher weighted average of precision, recall, and F1 score than the state-of-the-art.
Further research is needed to improve FSHC performance. The proposed methods calculate Fisher fast but wrap the classifier in a loop, slowing system performance. Thus, the first further research is the optimization of the FSHC complexity. Future research should also investigate the impact of sample-wise preprocessing [63] and data refinement strategies in a non-ideal environment [64]. Additionally, the current binary approach limits the system’s clinical applicability by ignoring the severity of dysgraphia. Furthermore, the histogram shown in Figure 4 also presents the probability of expanding dysgraphia to a multi-class. The spatial and feature distribution visualizations show that the data cannot be strictly separated into two classes. Figure 4(a) shows the histogram of two skewed data groups, indicating intra-class statistics. The 3D component in Figure 4(b) also reveals the density of diagnostic labels, indicating heterogeneity and supporting the motivation to explore multi-class classification. This encourages multiclass classification research [65], which can potentially lead to imbalanced data in publicly available data [32]. Due to limited research on public access to datasets, as shown in Table 8, it is necessary to develop a diverse dysgraphia dataset with varied assignments and exploration of language use on the BHK test to improve model generalizability and robustness.
DECLARATION
Supplementary Materials
The supporting information can be downloaded at https://github.com/kartikacandrak/dysgraphiaFSHC.
Sustainable Development Goals
The suitable development goals for SDG 4 (Quality Education).
Author Contribution
All authors contributed equally to the main contributor to this paper. All authors read and approved the final paper.
Funding
This research was funded by the Doctoral Scholarship Program for Indonesian Lecturers, the Center for Higher Education Funding and Assessment, and the Ministry of Higher Education, Science and Technology of the Republic Indonesia (Beasiswa PDDI and PPAPT KEMDIKTISAINTEK) (PDDI Number 202508111559).
Acknowledgement
The authors are grateful to Beasiswa PDDI and PPAPT KEMDIKTISAINTEK for financial support of the dissertation and publication. The author also thanks Prof. Aripriharta for guiding the International Publication.
Conflicts of Interest
The authors declare no conflict of interest.
REFERENCES
- S. L. Frierson, “Chapter 25 - Specific learning disabilities,” In Capute and Accardo's Neurodevelopmental Disabilities in Infancy and Childhood, pp. 521-535, 2025, https://doi.org/10.1016/B978-0-12-824060-1.00040-7.
- R. B. Mohemad, N. F. A. Mamat, N. M. M. Noor, A. C. Alhadi, N. M. Mohamad Noor, and A. C. Che Alhadi, “ONT-SLD: A domain ontology for learning disability,” Indian Journal of Computer Science and Engineering, vol. 11, no. 5, pp. 568–581, 2020, https://doi.org/10.21817/indjcse/2020/v11i5/201105187.
- P. Drotár, J. Mekyska, I. Rektorová, L. Masárová, Z. Smékal, and M. Faundez-Zanuy, “Evaluation of handwriting kinematics and pressure for differential diagnosis of Parkinson’s disease,” Artif. Intell. Med., vol. 67, pp. 39–46, 2016, https://doi.org/10.1016/j.artmed.2016.01.004.
- Z. Galaz et al., “Advanced Parametrization of Graphomotor Difficulties in School-Aged Children,” IEEE Access, vol. 8, pp. 112883–112897, 2020, https://doi.org/10.1109/ACCESS.2020.3003214.
- T. B. T, U. Goel, V. U. MS, V. Kulkarni and K. Sooda, "Automated Detection of Dysgraphia Symptoms In Primary and Middle School Children," 2024 International Conference on Emerging Smart Computing and Informatics (ESCI), pp. 1-5, 2024, https://doi.org/10.1109/ESCI59607.2024.10497397.
- S. A. Ramlan, I. S. B. Isa, M. K. Osman, A. P. Ismail, Z. H. C. Che Soh, and Z. H. C. Soh, “Comparing CNN-based Architectures for Dysgraphia Handwriting Classification Performance,” Pertanika J. Sci. Technol., vol. 32, no. 5, pp. 2013–2032, 2024, https://doi.org/10.47836/pjst.32.5.05.
- I. Baixauli-Fortea, B. Roselló, C. Berenguer, and A. Miranda-Casas, “Profiles of reading comprehension and written composition of children with high functioning autism,” Medicina (Buenos Aires), vol. 80, pp. 37–40, 2020, https://pubmed.ncbi.nlm.nih.gov/32150711/.
- Md. A. A. Islam, Md. Z. Z. Hasan Majumder, Md. A. A. Hussein, K. M. Hossain, and Md. S. S. Miah, “A review of machine learning and deep learning algorithms for Parkinson’s disease detection using handwriting and voice datasets,” Heliyon, vol. 10, no. 3, p. e25469, 2024, https://doi.org/https://doi.org/10.1016/j.heliyon.2024.e25469.
- S. D. Mayes, S. L. Calhoun, R. Kallus, R. Baweja, and D. A. Waschbusch, “Cognitive Disengagement Syndrome (Formerly Sluggish Cognitive Tempo) and Comorbid Symptoms in Child Autism, ADHD, and Elementary School Samples,” J. Psychopathol. Behav. Assess., vol. 46, no. 3, pp. 857–865, 2024, https://doi.org/10.1007/s10862-024-10145-0.
- R. Wulanningrum, A. Nur Handayani, H. Wahyu Herwanto, and K. Arai, “Optimized Yolov8 to identify people with disabilities,” International Journal of Advances in Intelligent Informatics, vol. 11, no. 4, pp. 756–767, 2025, https://doi.org/10.26555/ijain.v11i4.1977.
- S. A. Habeb, I. H. Obed, and A. Khaleel, “The infection of child with (Dysgraphia dyspraxia problems related to language, perception and thought, and affect fine motor activities, such as pen-holdingdisease related to language, perception and thought, and affect fine kinetic activities,” Indian J. Public Health Res. Dev., vol. 10, no. 10, pp. 3052–3056, 2019, https://doi.org/10.5958/0976-5506.2019.03344.8.
- E. Crosse and J. Roberts, “Navigating Academic Research as a Neurodivergent Individual: Insights, Challenges, and a Call to Action,” International Journal of Evidence Based Coaching and Mentoring, pp. 30–40, 2025, https://doi.org/10.24384/rbe3-k236.
- T. P. Kalashnikova, M. O. Satyukova, G. V Anisimov, and Y. V Karakulova, “Genetic background of dyslexia and dysgraphy in children,” Zhurnal Nevrologii i Psihiatrii imeni S.S. Korsakova, vol. 123, no. 5, pp. 48–52, 2023, https://doi.org/10.17116/jnevro202312305148.
- S. Rangasrinivasan, M. S. Sumi Suresh, A. Olszewski, S. R. Setlur, B. Jayaraman, and V. Govindaraju, “AI-Enhanced Child Handwriting Analysis: A Framework for the Early Screening of Dyslexia and Dysgraphia,” SN Comput. Sci., vol. 6, no. 5, 2025, https://doi.org/10.1007/s42979-025-03927-0.
- S. Sreekumar, A. Lijiya, and R. K. Ravindren, “Bridging the Gap: Cognitive Science Perspectives and Artificial Intelligence for Prediction and Detection of Specific Learning Disabilities,” IEEE Trans. Cogn. Dev. Syst., vol. 17, no. 4, pp. 711–726, 2025, https://doi.org/10.1109/TCDS.2025.3562665.
- Komarudin, B. B. Wiyono, N. Eva, I. Hitipeuw, and H. S. Tortop, “The Influence of Grit and Social Support on University Students’ Psychological Well-Being: The Mediating Role of Problem-Focused Coping,” Open Education Studies, vol. 8, no. 1, pp. 1–17, 2026, https://doi.org/10.1515/edu-2025-0119.
- L. C. Irani, N. Hidayah, M. Ramli, and N. Eva, “Mothers of children with disabilities: harnessing cognitive flexibility to promote parental mental health,” Journal of Public Health (United Kingdom), vol. 46, no. 1, pp. E157–E158, 2024, https://doi.org/10.1093/pubmed/fdad129.
- B. Agarwal et al., “Early and Automated Diagnosis of Dysgraphia Using Machine Learning Approach,” SN Comput. Sci., vol. 4, no. 5, 2023, https://doi.org/10.1007/s42979-023-01884-0.
- L. Deschamps et al., “Development of a Pre-Diagnosis Tool Based on Machine Learning Algorithms on the BHK Test to Improve the Diagnosis of Dysgraphia,” Advances in Artificial Intelligence and Machine Learning, vol. 1, no. 2, pp. 114–135, 2021, https://doi.org/10.54364/AAIML.2021.1108.
- M. Ikermane and A. El Mouatasim, “Digital handwriting characteristics for dysgraphia detection using artificial neural network,” Bulletin of Electrical Engineering and Informatics, vol. 12, no. 3, pp. 1693–1699, 2023, https://doi.org/10.11591/eei.v12i3.4571.
- K. Zvončáková, J. Mekyska, and V. Zvoncak, “Developmental Dysgraphia: A New Approach to Diagnosis,” International Journal of Assessment and Evaluation, vol. 28, no. 1, pp. 143–160, 2021, https://doi.org/10.18848/2327-7920/CGP/V28I01/143-160.
- N. Rahim, N. M. Mat Diah, and N. M. Diah, “Enhancing Handwriting Proficiency in Dysgraphic Students: Development and Validation of a Technology-Assisted Model,” International Journal of Information and Education Technology, vol. 15, no. 8, pp. 1563–1572, 2025, https://doi.org/10.18178/ijiet.2025.15.8.2358.
- X. Wang et al., “LSTM-CNN: An efficient diagnostic network for Parkinson’s disease utilizing dynamic handwriting analysis,” Comput. Methods Programs Biomed., vol. 247, 2024, https://doi.org/10.1016/j.cmpb.2024.108066.
- H. Singh, R. K. Sharma, V. P. Singh, and M. Kumar, “Recognition of online handwritten Gurmukhi characters using recurrent neural network classifier,” Soft comput., vol. 25, no. 8, pp. 6329–6338, 2021, https://doi.org/10.1007/s00500-021-05620-9.
- M. Bublin et al., “Handwriting Evaluation Using Deep Learning with SensoGrip,” Sensors, vol. 23, no. 11, pp. 1–14, 2023, https://doi.org/10.3390/s23115215.
- P. Odya, A. Czyżewski, A. Grabkowska, and M. Grabkowski, “Smart Pen - new multimodal computer control tool for graphomotorical therapy,” Intelligent Decision Technologies, vol. 4, no. 3, p. 197, 2010, https://doi.org/10.3233/IDT-2010-0080.
- T. Asselborn et al., “Automated human-level diagnosis of dysgraphia using a consumer tablet,” NPJ Digit. Med., vol. 1, no. 1, 2018, https://doi.org/10.1038/s41746-018-0049-x.
- C. Rémi, C. Frèlicot, P. Courtelleḿont, C. Frélicot, and P. Courtellemont, “Automatic analysis of the structuring of children’s drawings and writing,” Pattern Recognit., vol. 35, no. 5, pp. 1059–1069, 2002, https://doi.org/10.1016/S0031-3203(01)00094-2.
- J. Mekyska et al., “Graphomotor and Handwriting Disabilities Rating Scale (GHDRS): towards complex and objective assessment,” Aust. J. Learn. Diffic., vol. 29, no. 1, pp. 1–34, 2024, https://doi.org/10.1080/19404158.2024.2326686.
- S. A. Ramlan, I. S. B. Isa, A. P. Ismail, M. K. Osman, and Z. H. Che Soh, “Development of potential dysgraphia handwriting dataset,” Data Brief, vol. 54, 2024, https://doi.org/10.1016/j.dib.2024.110534.
- B. Manimekala, D. Umamaheswari, J. Rozario, M. Kannan, and P. M. Savitha, “Dysgraphia Disorder Detection and Classification Using Deep Learning Technique,” SN Comput. Sci., vol. 6, no. 3, 2025, https://doi.org/10.1007/s42979-025-03825-5.
- J. Kunhoth et al., “Grading of Developmental Dysgraphia Severity in Children: Multimodal Dataset and Classifier Fusion,” IEEE Trans. Cogn. Dev. Syst., pp. 1–15, 2025, https://doi.org/10.1109/TCDS.2025.3597742.
- R. Lafitte et al., “Writing and drawing tilts after right hemisphere stroke are signs of a wrong verticality representation,” Ann. Phys. Rehabil. Med., vol. 68, no. 4, 2025, https://doi.org/10.1016/j.rehab.2024.101923.
- L. Devillaine et al., “Analysis of graphomotor tests with machine learning algorithms for an early and universal pre-diagnosis of dysgraphia,” Sensors, vol. 21, no. 21, 2021, https://doi.org/10.3390/s21217026.
- R. Bouhamoum, M. Masmoud, Y. Lyousfi, H. Baazaoui, and D. Mehrotra, “Towards an Intelligent Model for Dysgraphia Evolution Tracking,” Procedia Comput. Sci., vol. 246, pp. 3713–3722, 2024, https://doi.org/10.1016/j.procs.2024.09.185.
- J. Kunhoth et al., “CNN feature and classifier fusion on novel transformed image dataset for dysgraphia diagnosis in children,” Expert Syst. Appl., vol. 231, p. 120740, 2023, https://doi.org/10.1016/j.eswa.2023.120740.
- J. Škunda et al., “Method for Dysgraphia Disorder Detection using Convolutional Neural Network,” Computer Science Research Notes, vol. 2022, no. 2022, pp. 152–157, 2022, https://doi.org/10.24132/CSRN.3201.19.
- P. Drotár and M. Dobeš, “Dysgraphia detection through machine learning,” Sci. Rep., vol. 10, no. 1, 2020, https://doi.org/10.1038/s41598-020-78611-9.
- Z. Galaz et al., “Comparison of CNN-Learned vs. Handcrafted Features for Detection of Parkinson’s Disease Dysgraphia in a Multilingual Dataset,” Front. Neuroinform., vol. 16, pp. 1–18, 2022, https://doi.org/10.3389/fninf.2022.877139.
- M. A. Amini et al., “The impact of in-air features on the diagnosis of developmental dysgraphia,” Journal of Intelligent and Fuzzy Systems, vol. 44, no. 1, pp. 1413–1424, 2023, https://doi.org/10.3233/JIFS-221708.
- L. Cornei, E. Croitoru, and H. Luchian, “Unsupervised text feature selection using NSGA II with Hill Climbing local search,” Procedia Comput. Sci., vol. 225, pp. 1201–1210, 2023, https://doi.org/10.1016/j.procs.2023.10.108.
- A. Naskar, R. Pramanik, S. K. S. Hossain, S. Mirjalili, and R. Sarkar, “Late acceptance hill climbing aided chaotic harmony search for feature selection: An empirical analysis on medical data,” Expert Syst. Appl., vol. 221, 2023, https://doi.org/10.1016/j.eswa.2023.119745.
- S. Tari, M. Basseur, and A. Goëffon, “Expansion-based Hill-climbing,” Inf. Sci. (N Y)., vol. 649, p. 119635, 2023, https://doi.org/10.1016/j.ins.2023.119635.
- V. Hénaux, A. Goëffon, and F. Saubion, “Evolution of Deterministic Hill-climbers,” in 2020 IEEE 32nd International Conference on Tools with Artificial Intelligence (ICTAI), pp. 564–571, 2020, https://doi.org/10.1109/ICTAI50040.2020.00093.
- A. Ibtissame, K. Ghizlane, M. Mrabti, I. Aouraghe, G. Khaissidi, and M. Mrabti, “A literature review of online handwriting analysis to detect Parkinson’s disease at an early stage,” Multimed. Tools Appl., vol. 82, no. 8, pp. 11923–11948, 2023, https://doi.org/10.1007/s11042-022-13759-2.
- M. Moetesum, I. Siddiqi, N. Vincent, and F. Cloppet, “Assessing visual attributes of handwriting for prediction of neurological disorders—A case study on Parkinson’s disease,” Pattern Recognit. Lett., vol. 121, pp. 19–27, 2019, https://doi.org/10.1016/j.patrec.2018.04.008.
- K. Sarin et al., “A three-stage fuzzy classifier method for Parkinson’s disease diagnosis using dynamic handwriting analysis,” Decision Analytics Journal, vol. 8, p. 100274, 2023, https://doi.org/https://doi.org/10.1016/j.dajour.2023.100274.
- J. A. Nolazco Flores et al., “Exploiting Spectral and Cepstral Handwriting Features on Diagnosing Parkinson’s Disease,” IEEE Access, vol. 9, pp. 141599–141610, 2021, https://doi.org/10.1109/ACCESS.2021.3119035.
- J. Kunhoth, S. Al Maadeed, M. Saleh, and Y. Akbari, “Exploration and analysis of On-Surface and In-Air handwriting attributes to improve dysgraphia disorder diagnosis in children based on machine learning methods,” Biomed. Signal Process. Control, vol. 83, p. 104715, 2023, https://doi.org/10.1016/j.bspc.2023.104715.
- K. S. Franz, G. Reszetnik, and T. Chau, “On the Need for Accurate Brushstroke Segmentation of Tablet-Acquired Kinematic and Pressure Data: The Case of Unconstrained Tracing,” Algorithms, vol. 17, no. 3, 2024, https://doi.org/10.3390/a17030128.
- A. Takaiwa, S. Tsuneto, H. Abe, S. Terai, and K. Tagawa, “A case of representational dysgraphia and object representational disorder with unilateral spatial neglect,” Brain and Nerve, vol. 67, no. 3, pp. 323–327, 2015, https://doi.org/10.11477/mf.1416200140.
- F. Brescia, B. E. A. Santana, M. Diaz, G. Vessio, M. A. Ferrer, and G. Castellano, “Integrating robotic kinematics and dynamics with online handwriting features for dysgraphia classification,” Biomed. Signal Process. Control, vol. 112, p. 108560, 2026, https://doi.org/10.1016/j.bspc.2025.108560.
- P. Sharma et al., “Vision transformer-based model for early detection of dysgraphia among school students,” Microsystem Technologies, vol. 31, no. 3, pp. 775–785, 2025, https://doi.org/10.1007/s00542-024-05741-9.
- A. M. Al-Shatnawi, F. Al-Saqqar, and A. Souri, “Arabic Handwritten Word Recognition Based on Stationary Wavelet Transform Technique using Machine Learning,” ACM Transactions on Asian and Low-Resource Language Information Processing, vol. 21, no. 3, 2022, https://doi.org/10.1145/3474391.
- S. W. Sihwi, K. Fikri, and A. Aziz, “Dysgraphia Identification from Handwriting with Support Vector Machine Method Dysgraphia Identification from Handwriting with Support Vector Machine Method,” vol. 1201, no. 1, p. 012050, 2019, https://doi.org/10.1088/1742-6596/1201/1/012050.
- S. A. Francis and M. Sangeetha, “A comparison study on optical character recognition models in mathematical equations and in any language,” Results in Control and Optimization, vol. 18, p. 100532, 2025, https://doi.org/10.1016/j.rico.2025.100532.
- M. Gavenciak et al., “Computer-Aided Diagnosis of Graphomotor Difficulties Utilizing Direction-Based Fractional Order Derivatives,” Cognit. Comput., vol. 17, no. 1, 2025, https://doi.org/10.1007/s12559-024-10360-7.
- K. C. Kirana, S. Abdullah, K. Abdulrahmana, and K. Abdulrahman, “Random Multi-Augmentation to Improve TensorFlow-Based Vehicle Plate Detection,” Buletin Ilmiah Sarjana Teknik Elektro, vol. 6, no. 2, pp. 113–125, 2024, https://doi.org/10.12928/biste.v6i2.10542.
- L. N. Hayati, A. N. Handayani, W. S. G. Irianto, R. A. Asmara, D. Indra, and N. S. Damanhuri, “Improving Indonesian Sign Alphabet Recognition for Assistive Learning Robots Using Gamma-Corrected MobileNetV2,” Buletin Ilmiah Sarjana Teknik Elektro, vol. 7, no. 3, pp. 350–361, 2025, https://doi.org/10.12928/biste.v7i3.13300.
- G. Dimauro, V. Bevilacqua, L. Colizzi, and D. Di Pierro, “TestGraphia, a software system for the early diagnosis of dysgraphia,” IEEE Access, vol. 8, pp. 19564–19575, 2020, https://doi.org/10.1109/ACCESS.2020.2968367.
- B. Manimekala, D. Umamaheswari, J. Rozario, M. Kannan, and P. M. Savitha, “Dysgraphia Disorder Detection and Classification Using Deep Learning Technique,” SN Comput. Sci., vol. 6, no. 3, 2025, https://doi.org/10.1007/s42979-025-03825-5.
- F. Masood, W. U. Khan, K. Ullah, A. Khan, F. H. Alghamedy, and H. Aljuaid, “A Hybrid CNN-LSTM Random Forest Model for Dysgraphia Classification from Hand-Written Characters with Uniform/Normal Distribution,” Applied Sciences (Switzerland), vol. 13, no. 7, 2023, https://doi.org/10.3390/app13074275.
- M. A. D. Widyadara, A. N. Handayani, H. W. Herwanto, and T. Yu, “A Generalized Deep Learning Approach for Multi Braille Character (MBC) Recognition,” Buletin Ilmiah Sarjana Teknik Elektro, vol. 7, no. 3, pp. 434–449, 2025, https://doi.org/10.12928/biste.v7i3.13891.
- L. N. Hayati, A. N. Handayani, W. S. G. Irianto, R. A. Asmara, D. Indra, and N. S. Damanhuri, “Optimizing YOLO-Based Algorithms for Real-Time BISINDO Alphabet Detection Under Varied Lighting and Background Conditions in Computer Vision Systems,” International Journal of Engineering, Science and Information Technology, vol. 5, no. 3, pp. 285–294, 2025, https://doi.org/10.52088/ijesty.v5i3.948.
- W. Ma, M. Fan, Y. Shi, and P. Kowalska, “Adapting to Diverse Special Needs: A Scoping Review of Participatory Design Involving Children with Learning Disabilities,” Int. J. Hum. Comput. Interact., vol. 42, no. 5, pp. 3012-3043, 2025, https://doi.org/10.1080/10447318.2025.2531269.
AUTHOR BIOGRAPHY

| Kartika Candra Kirana is a Ph.D. student (Electrical Engineering and Informatics) and a lecturer at Universitas Negeri Malang (UM). She focused on computer vision in learning disorders. She has earned a bachelor’s degree from UM and a master’s degree from ITS. Email: kartika.candra.2505349@students.um.ac.id Scopus ID: 57205442175 Orchid: https://orcid.org/0000-0001-9468-2361 |
|
|

| Anik Nur Handayani is a lecturer at the Universitas Negeri Malang. Her expertise is in assistive technology. She is the primary supervisor of the first author's dissertation. Email: aniknur.ft@um.ac.id Scopus ID: 57193701633 Orchid: https://orcid.org/0009-0003-0767-8471 |
|
|
| Nur Eva is a lecturer at Malang State University. Her research focuses on the psychology of children with special needs. She is the secondary supervisor in the first author's dissertation. Email: nur.eva.fppsi@um.ac.id Scopus ID: 57221393873 Orchid: https://orcid.org/0000-0003-3584-5049 |
|
|

| Aji Prasetya Wibawa is a lecturer at the Universitas Negeri Malang. His expertise is in data science. In this study, he is the lecturer of the International Publication course. Email: aji.prasetya.ft@um.ac.id Scopus ID: 56012410400 Orchid: https://orcid.org/0000-0002-6653-2697 |
|
|

| Wahyu Nur Hidayat is a Ph.D. student at the National Taiwan University of Science and Technology, Taiwan, supported by the Taiwan Scholarship (MOE). His research focuses on technology-enhanced learning, personalized learning systems, gamified learning, and intelligent tutoring systems. Email: D11311807@ms.ntust.edu.tw |
|
|

| Kohei Arai is a scientist and professor emeritus at Saga University, Japan. His research covers various topics such as image recognition, information systems, and non-linear optimization theory. Email: arai@cc.saga-u.ac.jp Scopus ID: 7403965268 |
Kartika Candra Kirana (Adaptive Feature Selection using Fisher-Based Supervised Hill Climbing for Dysgraphia Handwriting Classification)