ISSN: 2685-9572 Buletin Ilmiah Sarjana Teknik Elektro
Vol. 8, No. 2, April 2026, pp. 463-475
Fuzzy Logic-Based Classification of Crescent Moon Images Using Contrast and Thickness
Yudhiakto Pramudya 1, Kartika Firdausy 2, Adi Jufriansah 3, Okimustava 1, Itsnaini Irvina Khoirunnisa 4, Bayu Krisna Murti 4, Rihmah Alifah Hidayah 1, Murinto 5, Muhammad Maulidan 6
1 Department of Physics Education, Universitas Ahmad Dahlan, Yogyakarta, Indonesia
2 Department of Electrical Engineering, Universitas Ahmad Dahlan, Yogyakarta, Indonesia
3 Department of Physics, Universitas Gadjah Mada, Yogyakarta, Indonesia
4 Master Program of Informatics, Universitas Ahmad Dahlan, Yogyakarta, Indonesia
5 Department of Informatics, Universitas Ahmad Dahlan, Yogyakarta, Indonesia
6 Pusat Studi Astronomi, Universitas Ahmad Dahlan, Yogyakarta, Indonesia
ARTICLE INFORMATION |
| ABSTRACT |
Article History: Received 14 October 2025 Revised 07 January 2026 Accepted 20 April 2026 |
| 
Accurate determination of the crescent moon (hilal) is crucial for establishing the start of lunar months in the Islamic calendar; however, observations are frequently hindered by daylight conditions, atmospheric disturbances, and subjective visual interpretation. This research proposes a fuzzy logic-based classification system to evaluate crescent moon images using contrast and arc thickness as input parameters, providing a transparent, rule-based alternative to black-box machine learning models for hilal visibility assessment. Images were collected on four distinct observation dates (May 28, 2025, August 5, 2024, September 16, 2023, and May 9, 2021) under varying atmospheric conditions and crescent appearances. Each image underwent pre-processing to extract quantitative measures of arc contrast and thickness, which were subsequently fuzzified using triangular and trapezoidal membership functions. A fuzzy inference system employing expert-defined rules was then used to compute a visibility score for each observation. The resulting visibility scores of 0.4691, 0.4604, 0.4689, and 0.4154, respectively, placed all four observations within the “partially visible” category. These findings demonstrate the system's capability to manage observational ambiguity in daylight conditions, showing potential for reliable classification while still requiring validation on larger datasets and clear non-visibility cases, and offering a transparent and interpretable framework to support more consistent and standardized hilal classification for calendrical purposes. |
Keywords: Classification; Contrast; Crescent Moon; Fuzzy Logic; Image Processing |
Corresponding Author: Yudhiakto Pramudya Universitas Ahmad Dahlan Yogyakarta, Indonesia Email: yudhiakto.pramudya@pfis.uad.ac.id |
This work is open access under a Creative Commons Attribution-Share Alike 4.0 
|
Document Citation: Y. Pramudya, K. Firdausy, A. Jufriansah, O. Okimustava, I. I. Khoirunnisa, B. K. Murti, R. A. Hidayah, M. Murinto, and M. Maulidan, “Fuzzy Logic-Based Classification of Crescent Moon Images Using Contrast and Thickness,” Buletin Ilmiah Sarjana Teknik Elektro, vol. 8, no. 2, pp. 463-475, 2026, DOI: 10.12928/biste.v8i2.14964. |
- INTRODUCTION
The task of determining the commencement of Ramadan has been consistently challenging, and as a result, not all Muslims begin Ramadan at the same time [1][2]. The primary reason is the reliance on individual observations of the new crescent Moon, which are contingent upon a variety of factors that affect the final results [3][4]. These factors encompass the proficiency of the observers, the location from which the observation is conducted, the cloudiness or clarity of the sky, and the tools used for Moon observation [5]-[7].
In addition, the utilization of astronomical calculation methods or the eye-sighting of the new crescent Moon has been the subject of debate in light of technological advancements [3],[8]. This issue becomes even more significant given the large number of Muslims worldwide who eagerly await the announcement of the first day of Ramadan. During the ninth month of the Hijri calendar, Muslims observe fasting from sunrise to sunset. Additionally, all Muslims worldwide must reach a consensus on that day. Muslims constitute the majority of the population in approximately 50 countries worldwide. As of 2021, Muslims account for about 1.9 billion people worldwide, representing 24.7% of the global population [9][10]. Muslims worldwide make a significant effort and use a variety of instruments, including telescopes, binoculars, astronomy, and the naked eye, to observe the visibility of the new crescent Moon at the end of the eighth month (Sha’ban) every year [11]. This is done to confirm the commencement of the holy month of Ramadan. The majority of the time, it is difficult to predict the beginning of the month in advance, resulting in a division among Muslims who fast on different dates [12].
In the Islamic Hijri calendar, the crescent moon, or hilal, plays a crucial role in determining the start of each month [13]. The observance of Ramadan and Eid al-Fitr is contingent upon the precise and timely observation of the crescent moon [14]-[16]. It is imperative to observe the crescent during daylight hours to enhance the accuracy of determining the Islamic calendar [17], despite the common practice of observing the hilal prior to sunset. Nevertheless, the crescent’s faint visibility in clear daytime skies, combined with atmospheric factors such as air turbulence and light scattering [18][19], presents substantial challenges during daytime observations. The crescent becomes increasingly challenging to observe as the air humidity increases [20].
In the past, the detection of crescents has been contingent upon the manual labour and expertise of astronomers and skilled observers. These manual observations are frequently subject to human error, observer fatigue, and are significantly impacted by environmental conditions. Daylight hilal detection is often subjective, leading to inconsistent results and differing opinions. There is a growing demand for a system that can accurately and automatically detect the crescent moon, thereby minimizing human intervention, to accurately determine the lunar calendar, particularly in regions with diverse weather conditions.
While innovations such as Artificial Intelligence (AI) and image processing have made substantial progress in automating tasks that require pattern recognition and classification [21]-[24]. There is still a deficiency in integrating these technologies for specific astronomical observations, such as the detection of the moon [25]-[27]. Existing systems have not been fully optimized for daytime crescent detection, particularly in environments where the arc is very thin or barely visible, because most approaches assume higher signal-to-noise ratios or depend heavily on image quality and do not explicitly model the ambiguity encountered by human observers in bright-sky conditions [28]-[30]. This presents an opportunity to create a more adaptive and resilient system to overcome these constraints, namely the fuzzy logic approach.
The objective of this research is to propose the creation of a fuzzy logic-based classification system that is targeted at the classification of crescent moon images, especially daytime crescent moon images. The task is well-suited to fuzzy logic, as it is adept at managing imprecise data and uncertainty, such as the subtle differences in crescent visibility under varying atmospheric and lighting conditions, by representing expert descriptions like “thin”, “faint”, or “barely visible” as linguistic variables and IF–THEN rules that mimic human reasoning while remaining fully interpretable. The proposed system will reduce the necessity for subjective human interpretation by providing a reliable classification of crescent moon images based on arc thickness and arc contrast. This research contribution is the development of a fuzzy logic-based system that objectively classifies crescent moon visibility from daytime images using arc thickness and contrast, reducing reliance on subjective human interpretation and offering a transparent alternative to black-box models.
- RELATED WORK
The Gregorian calendar, which was introduced by Pope Gregory XIII in 1582, is a widely used tool for global communication and coordination [31]. Nevertheless, Muslims worldwide depend on the Hijri calendar. This lunar system is approximately eleven days shorter than the Gregorian calendar [12], to commemorate religious observances, such as the month of Ramadan [14],[11]. The sighting of the new crescent Moon marks the commencement of each Hijri month [32]. This tradition has been deeply ingrained in theology and astronomy since ancient Babylonian times [33],[34]. The visibility of this crescent has been a long-standing challenge due to its dependence on the Moon’s position relative to the Sun and Earth, resulting in varying phases of illumination [35].
Our research suggests that a fuzzy logic based classification system could be a solution to this challenge. This system is designed to identify and classify crescent Moon images captured during daylight hours [27], [36]. This task is particularly well-suited to the application of fuzzy logic, which is particularly adept at managing imprecise inputs and uncertainties [37], including the subtle variations in crescent thickness, brightness, and visibility that are frequently influenced by environmental factors. This system endeavours to reduce subjective human interpretation and provide a more consistent and accurate tool for supporting Hijri calendar determination and crescent visibility studies by integrating astronomical parameters into an intelligent fuzzy model.
- RESEARCH MATERIAL AND METHOD
This research employs observational methods for data collection and utilizes the Waterfall method for developing a data classification system. The image data shows the visibility level of the hilal, from a very thin arch to a thick arch (unobservable to easily observable). There is another possibility that there is no arch in the data. This could be due to atmospheric conditions that create excessive noise or improper telescope alignment. In this research, the “no arc” category is defined operationally as images in which no crescent edge is detected above the Canny threshold and the resulting normalized thickness falls below a predefined limit, while the contrast measure remains below the “Low” fuzzy set; such cases are then mapped to the “No Arc” membership function in the thickness input. Images were collected from Observatorium Universitas Ahmad Dahlan (UAD). Data collection included:
- Image Capture: Observatories will take hilal images using telescopes equipped with imaging tools and baffles (cylinders that block the Sun’s rays) [38]. Bias and dark frames are included for data calibration of the image.
- Metadata collection: Each hilal image data includes metadata in the form of date, time, location, atmospheric conditions, Moon altitude, and Moon-Sun elongation. This metadata is valid for the data classification process [39].
The development research used the Waterfall method. This method is sequential, characterized by each phase depending on the completion of the previous phase. The Waterfall method was initially developed by Royce [40][41] and further refined by Sommerville [42]. The Waterfall model was selected because this work develops a standalone classification system with clearly defined stages (requirements, design, implementation, and testing) [43], where changes in requirements during the project are limited and a traceable, document-based development process is preferred over highly iterative Agile-style cycles [44][45]. This approach is well suited to research-oriented system development, where the problem definition, system scope, and evaluation criteria are established at the beginning and remain stable throughout the research [46]. This phase consists of (Figure 1):
- Requirement Analysis and Design: In this phase, the researcher identifies the key features for classification, which are hilal arc thickness, brightness, and visibility. In the subsequent implementation, brightness information is incorporated into the computation of arc contrast, so that the fuzzy inference system finally operates on two input variables, arc thickness and arc contrast, while visibility is represented in the output variable. This clarification resolves the earlier design reference to three features and aligns it with the implemented two-input fuzzy model.
- Researchers conducted Fuzzy settings for Hilal image classification based on the literature.
- System Design: Researchers designed a Fuzzy logic-based classification system that includes fuzzification, inference, and defuzzification stages. Researchers also developed a system to process Hilal images and implemented Fuzzy logic to classify them.
- Implementation: The researcher implemented the system and integrated the Fuzzy logic-based classification algorithm. The researcher also prepared the system to classify the image into thin arc, thick arc, and no arc hilal categories.
- Testing: The researcher validated the system by comparing the classification of images from the literature. Additionally, we tested the system on a group of Hilal images to evaluate its accuracy and consistency.
- Operation: After successful testing, the system was finalized and prepared for use on daytime hilal observations at the Observatorium UAD.
By using the Waterfall method, system development is more practical, and maintenance becomes easier [47]. Data analysis involves fulfilling classification accuracy indicators in three categories: image data with thin arcs, thick arcs, and no arcs. The system was also analysed for its consistency under various atmospheric conditions. This is very important to compare the brightness of the moon and the background sky. More details of data collection and data classification methods can be seen in Figure 2. The pre-processing stage includes converting the image to grayscale, enhancing contrast with CLAHE, applying a Gaussian filter to reduce noise, and using the Canny algorithm for edge detection. Feature extraction then focuses on measuring the contrast and thickness of image curves for classification. A fuzzy logic controller processes these features through fuzzification, application of fuzzy rules, aggregation, and defuzzification, ultimately producing accurate image classification based on contrast and thickness.
Figure 1. Fuzzy logic on hilal image data
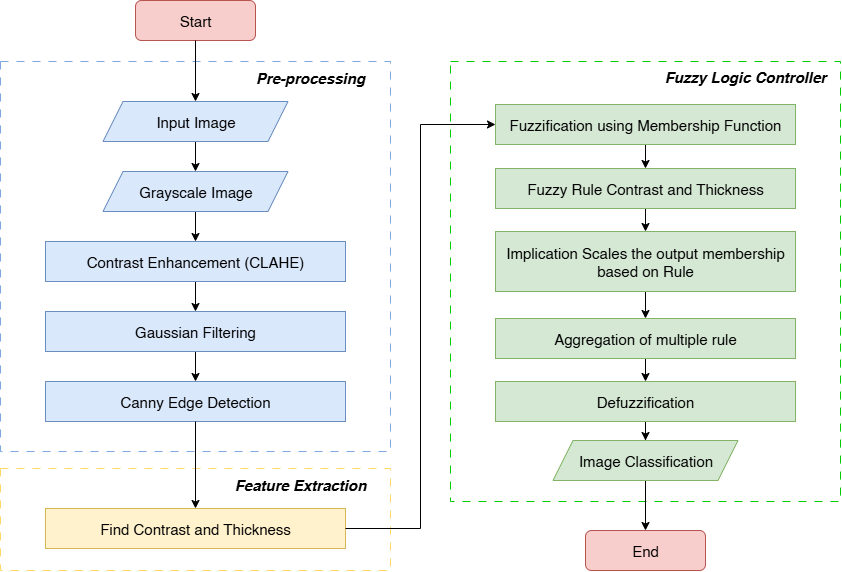
Figure 2. Research flowchart, this flowchart summarizes the overall research methodology, from acquisition and preprocessing of hilal images to fuzzy feature extraction, inference, and visibility classification
- RESULT AND DISCUSSION
The research focuses on data in the form of video and the analysis of daytime hilal image data at the Observatorium UAD. This data includes variations in atmospheric conditions, light intensity, and thickness of the hilal arc. The implementation of the fuzzy inference system begins by determining the membership functions and fuzzy rules.
- Thickness
This process transforms the quantitative (sharp) values of the arc thickness into fuzzy sets, each with a certain degree of membership. The input variable for arc thickness, labelled as Arc Visibility, is normalized from 0 to 1, where a value of 0 indicates an undetectable or minimal arc thickness, and a value of 1 corresponds to the maximum observable thickness, as formulated in Equation (1) to equation (3). The breakpoints at 0.3, 0.4, and 0.6 were selected heuristically based on expert inspection of a larger pool of crescent images from the observatory archive, by mapping ranges that observers consistently described as “thick”, “thin”, or “barely discernible”. In this normalization scheme, smaller values of  indicate thicker, more prominent arcs, while larger values correspond to progressively thinner arcs; therefore, the membership function Thick is set to 1 for
  , and the No Arc membership increases as approaches and exceeds 0.6, reflecting the transition to non-observable crescents.
These parametrizations were tuned iteratively with domain experts to ensure that the fuzzy sets Thick, Thin, and No Arc qualitatively match human judgments over representative examples from different observation conditions.
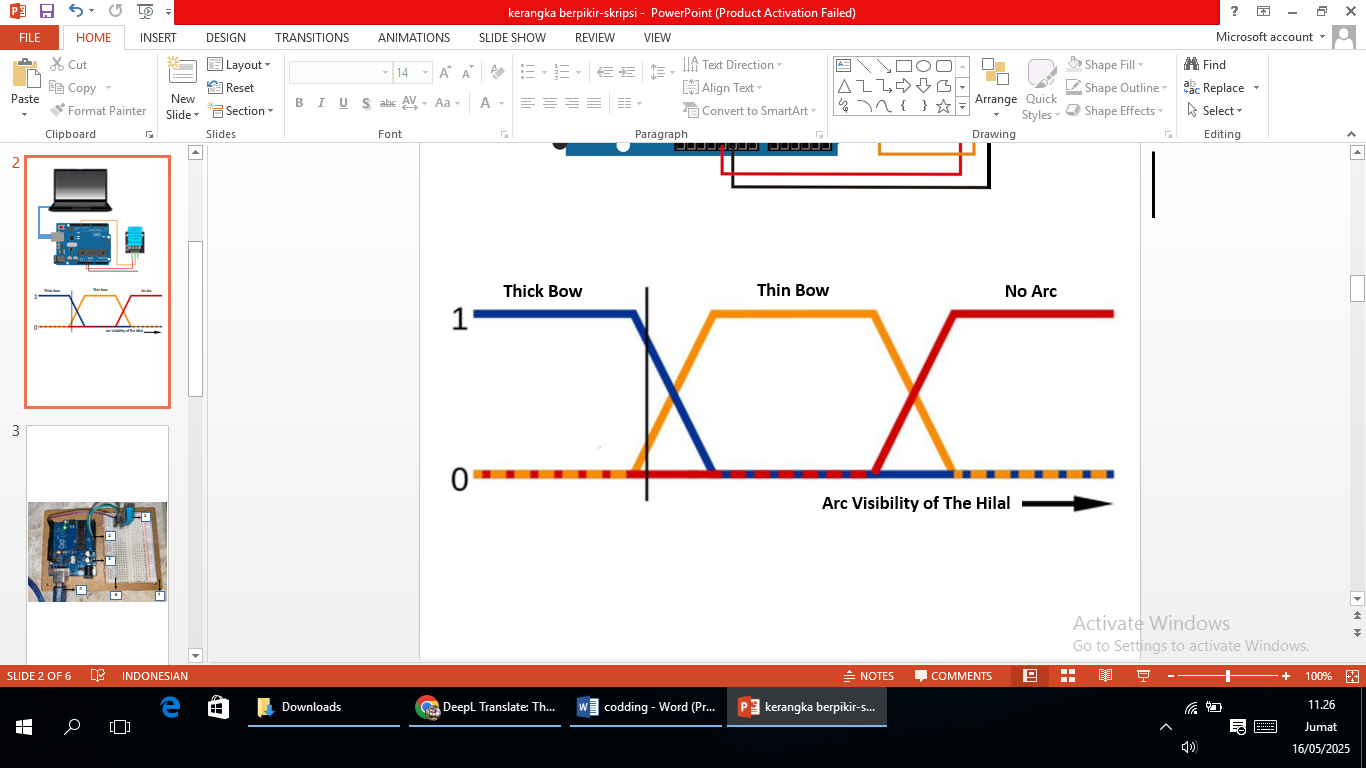
As depicted in Figure 3, this variable is partitioned into three fuzzy sets: Thick Arc, Thin Arc, and No Arc. The Thick Arc set, represented by the blue trapezoidal membership function, attains full membership (1,0) for thickness values between 0 and 0.2, decreasing linearly to 0 as the thickness approaches 0.4; this set effectively categorizes the crescent as clearly visible and thick. The Thin Arc set, represented by the yellow triangular membership function, peaks at a normalized thickness of 0.4, representing a transition state where the arc is visible but thin. Finally, the No Arc set, represented by the red trapezoidal membership function, begins to have a nonzero degree of membership after a thickness of 0.6 and reaches full membership at 0.8, signifying a condition where the arc is too thin to be reliably observed. This membership function design allows the fuzzy logic system to interpret the thickness data with flexibility, reflecting a qualitative assessment method. These fuzzy outputs then serve as important inputs for the fuzzy inference engine, which processes them along with other variables, such as brightness and contrast, according to a defined rule base. The fuzzy membership function can be graphed as shown in Figure 3.
This research positions itself among the various attempts to objectify crescent observations using technology and offers distinct advantages in interpretation and handling ambiguity compared to previous studies. The application of the Canny edge detection method for segmenting crescent images before analysis have been done [18]. Although an important fundamental step, the approach is still part of the pre-processing stage, while this research builds on it by adding an intelligent inference layer using fuzzy logic. The computer vision approach, utilizing Gaussian Blur, Adaptive Thresholding, and Circular Hough Transform [19][20] has demonstrated improved accuracy in detecting the post-conjunction crescent moon through digital imagery. However, this method presents limitations due to its strong dependence on image quality and visual conditions during observation. In contrast, the fuzzy logic-based approach developed in this research offers superior adaptability to atmospheric uncertainty [48]. In the realm of deep learning, applied a modern object detection model, YOLOv5, to directly detect and classify crescents in images [21]. End-to-end methods like this are potent but often operate as a “black box”.
In contrast, the fuzzy model in this research is a “white box” model, where the decision-making process is based on IF-THEN rules that can be understood and validated by experts. A similar approach using deep learning was also demonstrated [49]. Meanwhile, the Backpropagation Artificial Neural Network (ANN) successfully implemented, which also demonstrated good classification performance but faced the same model interpretation challenges as other deep learning approaches [23]. Thus, this research positions itself as a transparent and computationally efficient alternative amidst the dominance of more complex machine learning models, by offering a transparent, robust, and computationally efficient method for crescent image classification.
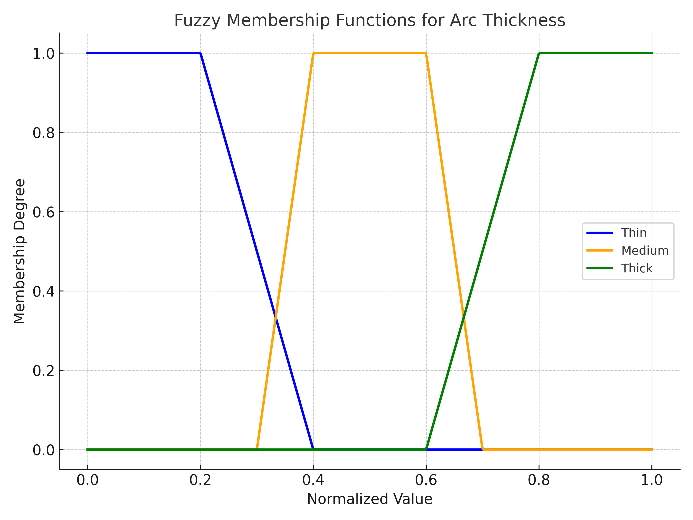
Figure 3. Research flowchart Fuzzy rule graph based on hilal arc thickness
- Contrast
The image processing workflow starts by separating each crescent image into its primary color components such as red, green, and blue. This decomposition is essential to examine how each channel contributes spectrally to the image’s total brightness. Subsequently, the brightness of the image is accurately assessed at predetermined boundary regions that are defined using a reference template. This region-based method ensures uniformity in measurement points across all images, effectively reducing unwanted variations and improving the consistency of the data. The brightness within each chosen region is then computed by averaging the pixel intensity counts, providing a precise measure of light strength. The resulting values for crescent and background brightness are further analyzed to determine the crescent’s contrast levels [50].
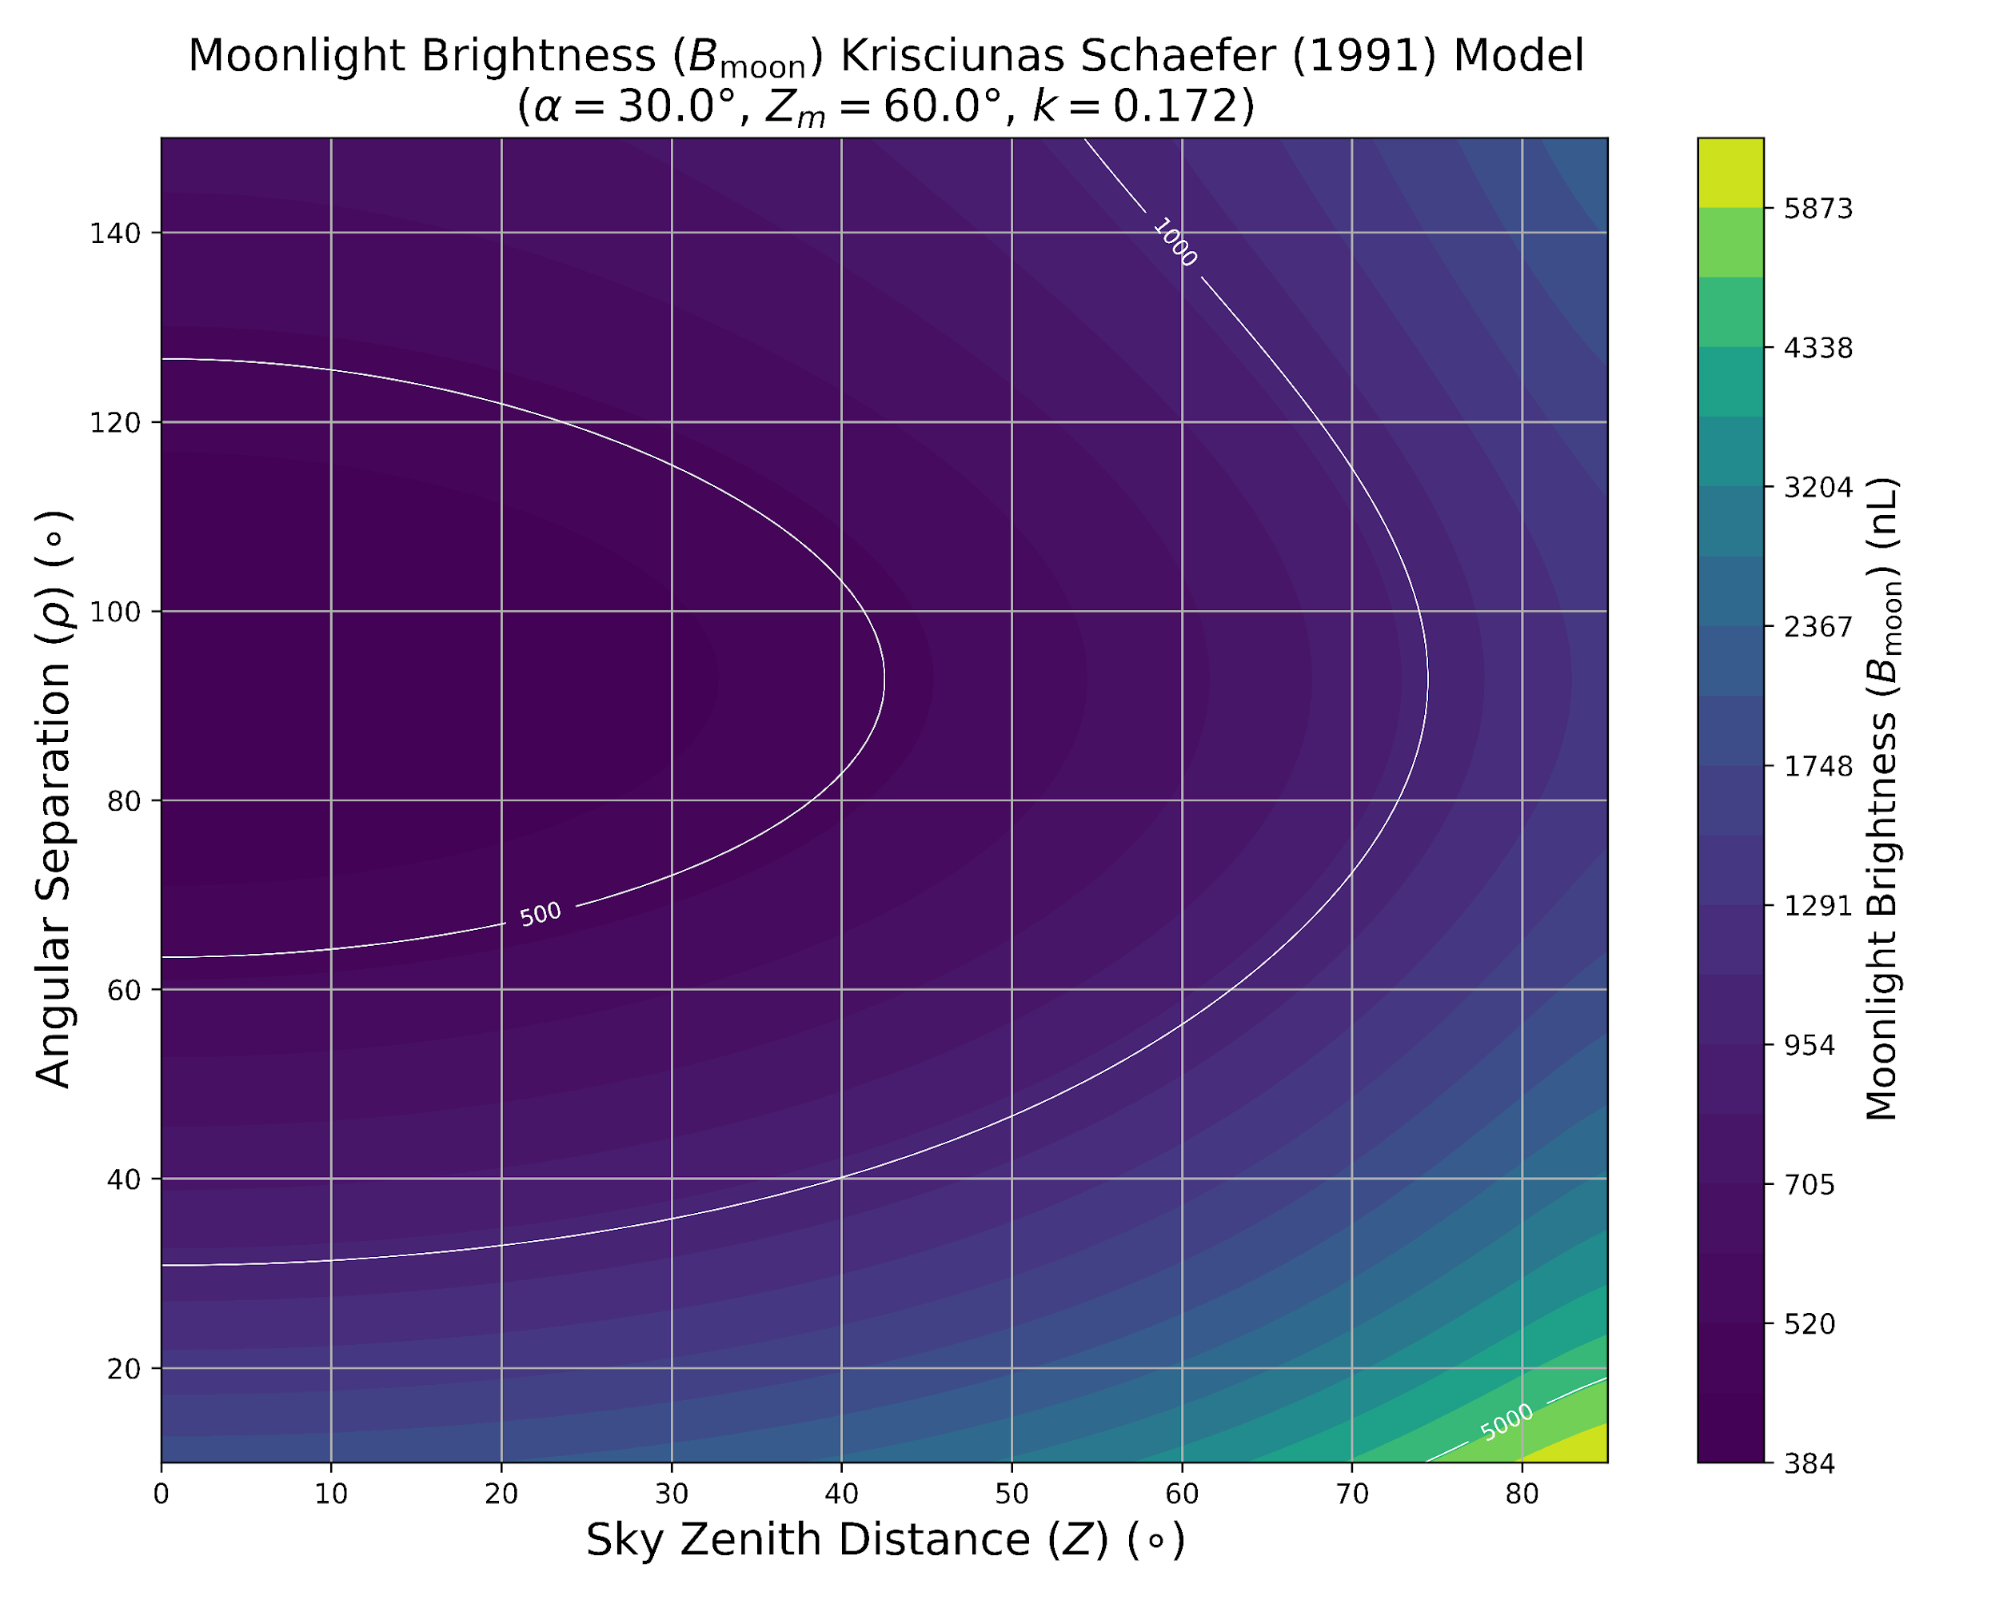
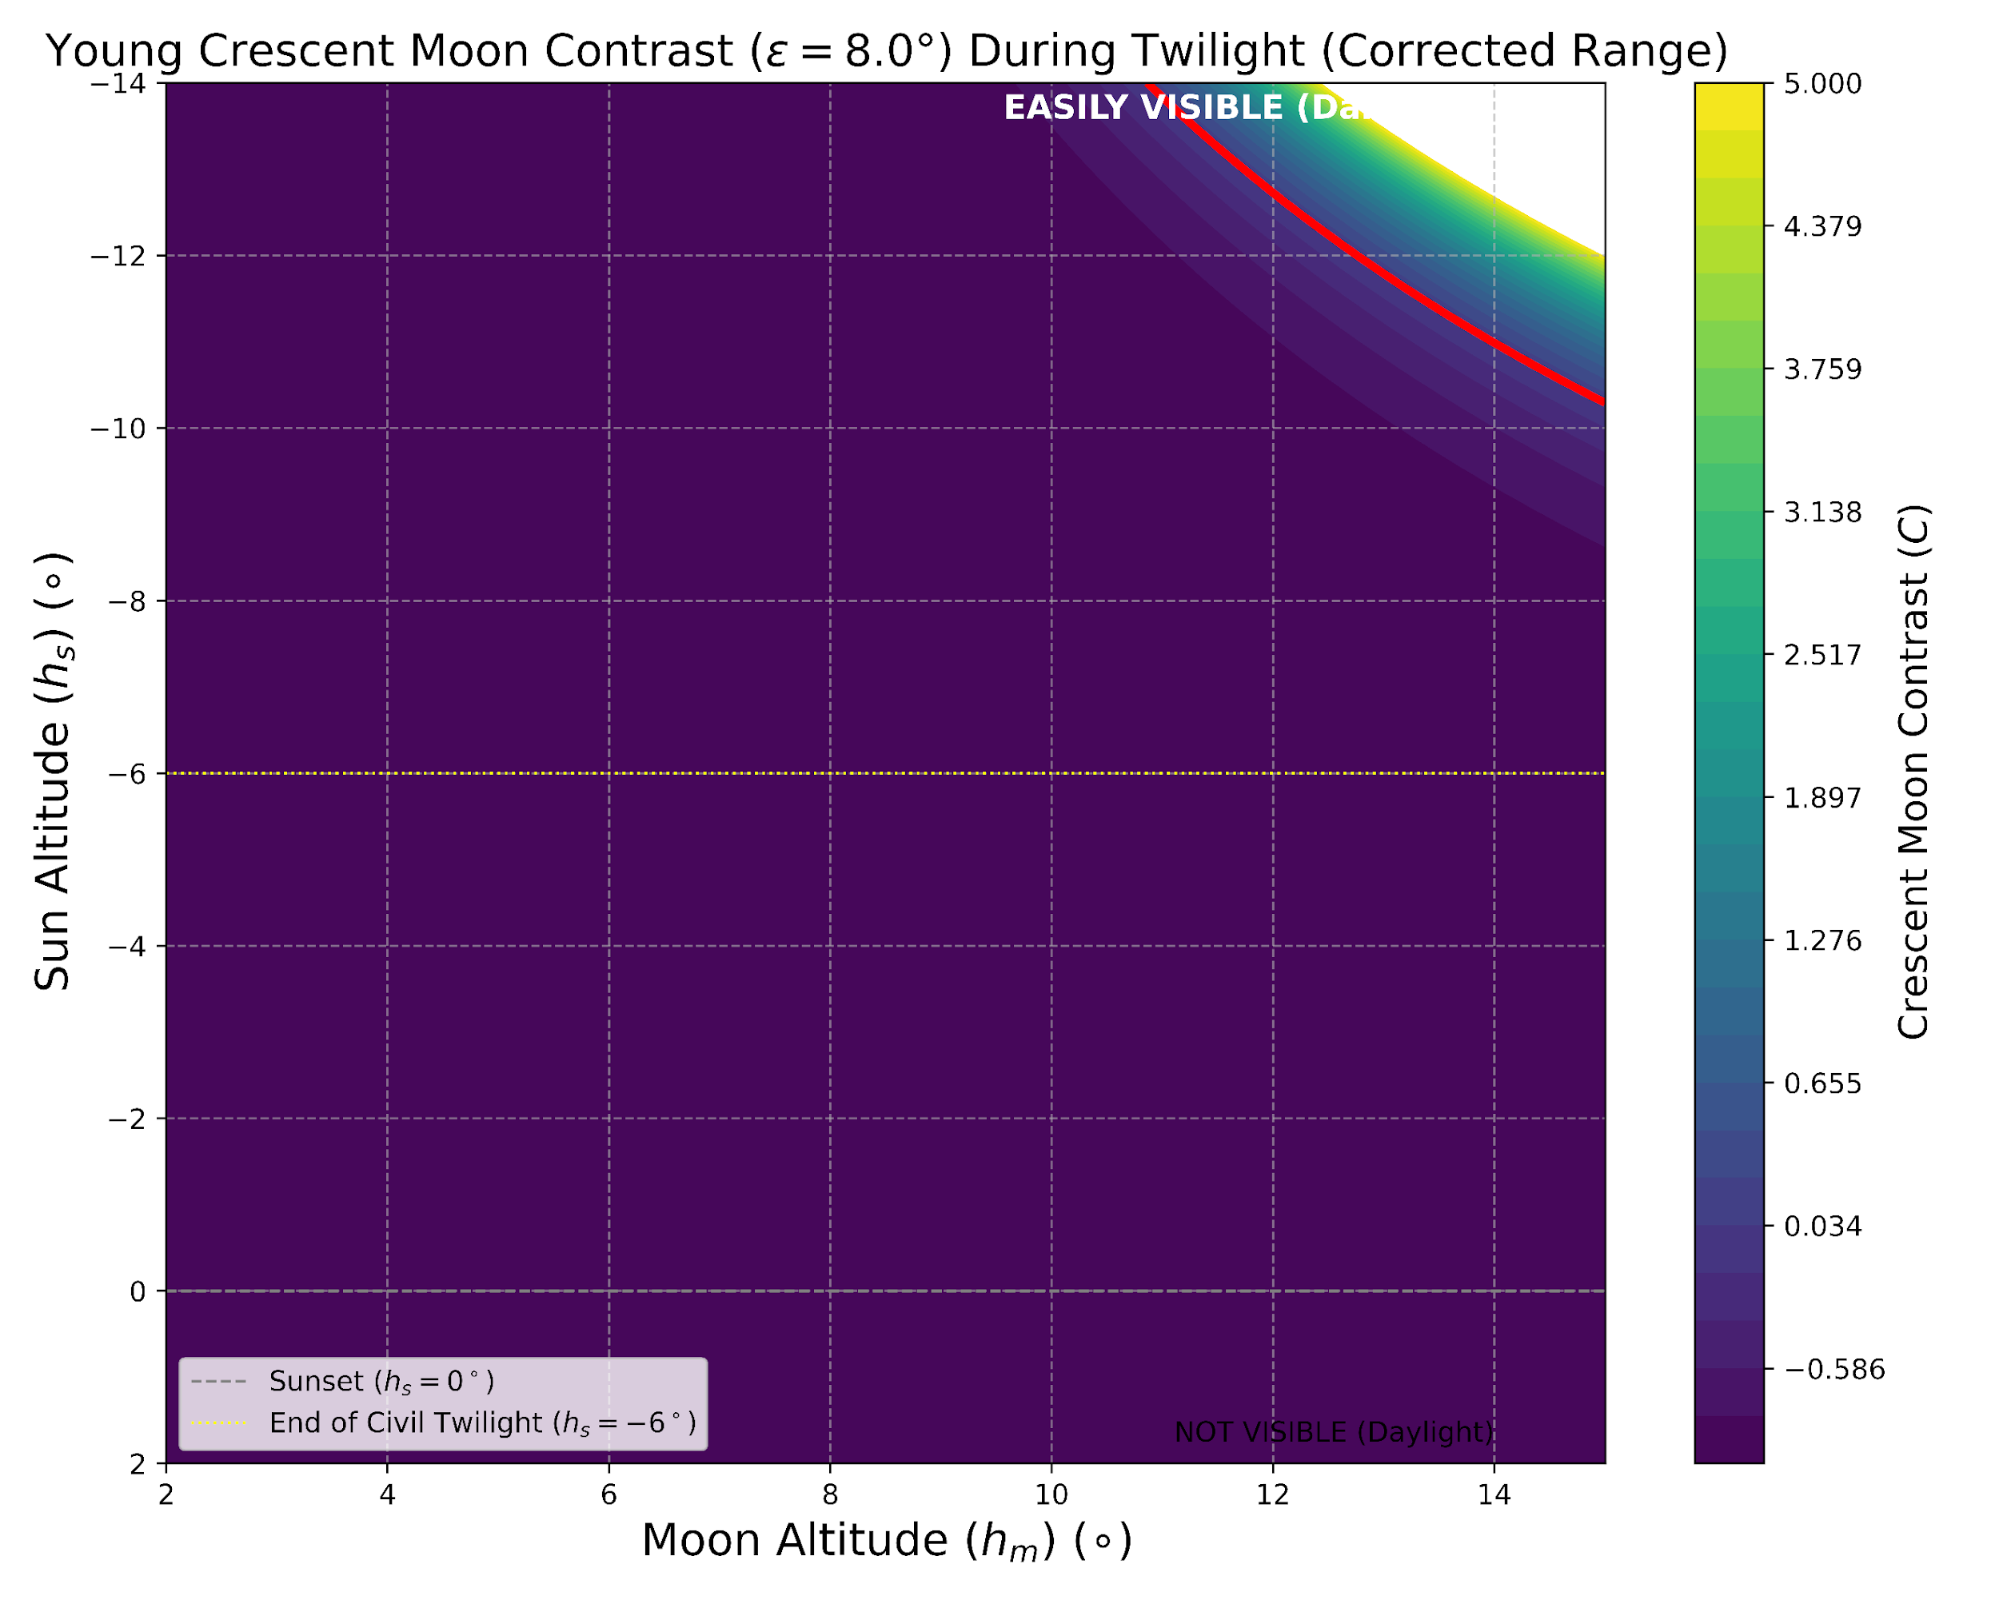
In Figure 4(a), employs the Schaefer model to display the Moonlight Brightness (Bmoon) in nanoLamberts (nL) across the nocturnal sky. It shows that the greatest brightness, reaching up to 5873 nL, occurs at small Angular Separations  from the Moon due to pronounced Mie scattering effects (aerosol aureole) a key phenomenon for assessing the moon’s optical influence. Meanwhile, Figure 4(b) illustrates the relationship between Crescent Contrast
  and the twilight background brightness
  as functions of the Moon’s altitude (hm) and the Sun’s altitude
  for an elongation of 8.0°. The distinct shift from negative contrast (darker regions) to the visibility threshold at
  (indicated by the red line) emphasizes the need for the Sun to descend to approximately
  to
to  before the crescent becomes visible, underscoring the dependence of visibility on the rapid decline of twilight illumination. Notably, the white zone in Plot (b) represents extremely high contrast values (beyond the maximum plotted limit of
  ), occurring when the sky is darkest (Bsky → 0 at low hs) while the Moon remains high (large hm). This identifies the region of Optimal Visibility, where the contrast ratio is at its peak.
Contrast parameters, as one of the fundamental attributes in image analysis, are represented in fuzzy membership functions. This research develops a model for perceiving crescent image contrast, with three criteria: “Low”, “Medium”, and “High”. The membership function for the “Low” criterion shows a well-defined transition. The degree of membership is complete (with a value of 1) when the contrast value is at or below 0.2, clearly identifying very low contrast. Then, as the contrast value increases beyond 0.2 to reach 0.4, the degree of membership decreases linearly from 1 to 0. This decrease reflects an inverse proportionality to the increase in contrast value, where the “low” level gradually fades as the contrast increases. This reflects the cognitive reality where category boundaries are rarely discrete.
The “Medium” criterion shows a sophisticated trapezoidal architecture, indicating stability and controlled transition. The degree of membership is zero when the contrast value is at or below 0.3. Then, it increases linearly from 0 to 1 as the contrast moves from 0.3 to 0.4, indicating a proportional increase in membership. Full membership (with a value of 1) is maintained for contrasts between 0.4 and 0.6. This period of stability is crucial, indicating the contrast range where objects can be seen clearly without exaggeration. Subsequently, the degree of membership decreases linearly from 1 to 0 as the contrast moves from 0.6 to 0.7, depicting a proportional decrease as the upper limit of this category is approached.
|
(a) |
|
(b) |
Figure 4. Crescent contrast value (a) Moonlight Brightness ( ) Schaefer Model, (b) Young Crescent Moon Contrast (
 )
)
Next, the membership function for the “High” category is designed to capture the essence of the prominent contrast. The degree of membership is zero when the contrast value is at or below 0.6, indicating a clear lower limit. Then, it increases linearly from 0 to 1 as the contrast moves from 0.6 to 0.8, indicating a proportional increase in membership. The peak of full membership (with a value of 1) is achieved and maintained for contrasts above 0.8, confirming the absolute dominance of “High” at higher contrast values. The graphical visualization intuitively reinforces this formulation, highlighting the inherent overlapping characteristics of fuzzy sets, which are essential for reasoning under uncertainty. The fuzzy membership function can be graphed as shown in Figure 5.
In the research landscape, the formulation of membership functions is not a single domain, but rather a subject of continuous exploration for optimization. Recent studies have explored variations in the shape of membership functions from triangular to Gaussian and sigmoid to improve the performance of fuzzy systems in diverse applications. The careful parameterization of membership functions can significantly impact the effectiveness of fuzzy inference systems in complex classification tasks [51]. The theoretical foundation laid remains relevant [26], emphasizing that the power of fuzzy logic lies in its ability to model the inherent ambiguity in real-world data. In the realm of image processing, the research have illustrated how fine-tuning of contrast membership functions can lead to significant improvements in feature detection and image segmentation [52]. Furthermore, the contribution of [53] in image enhancement using a fuzzy approach highlights the importance of designing adaptive membership functions to achieve optimal visual results. This comparison collectively emphasizes that contrast membership function design is not just a technical issue but a dynamic research area with broad implications for intelligent system applications.
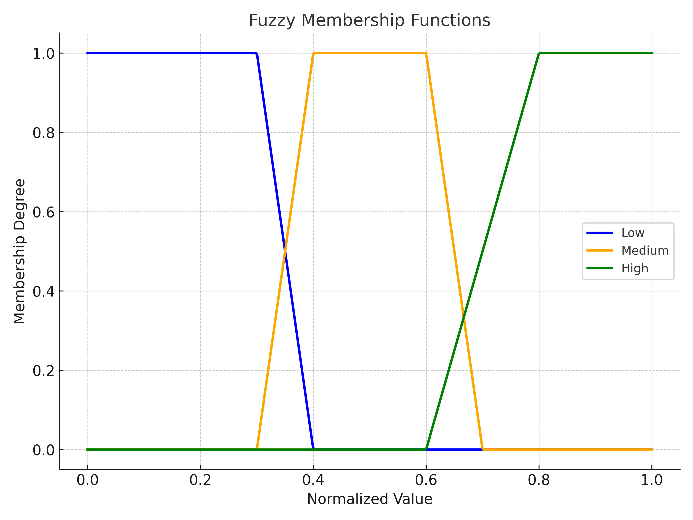
Figure 5. Fuzzy rule graph based on hilal arc contrast
- System Implementation
Figure 6 illustrates the output of the crescent image processing, which consists of three parts: the Original Image, which displays the initial crescent image taken from the observation. This image displays the shape of the crescent in its actual condition; however, it may still contain noise and lighting variations. Then there is the Crescent Mask, an image that focuses on the masking results in the crescent area. This process isolates the crescent from the background, making the relevant parts easier to identify. The area outside the crescent is marked in black, while the crescent itself can be seen more clearly. Finally, Edge Detection displays the results of edge detection on the crescent image. This method is used to highlight the boundaries of the crescent, making its shape and contours more easily recognizable. These results are essential for further analysis, such as measurement or classification.
Based on Table 1, the four data sets corresponding to four different dates of crescent images, the visibility score belongs to criteria of partially visible. In this research, the visibility score is a defuzzified output in the range  , where values below 0.3 correspond to the “No Arc” category, values between 0.3 and 0.7 correspond to “Partially Visible”, and values above 0.7 correspond to “Fully Visible”. All four observations yielded scores between 0.415 and 0.469, placing them in the “Partially Visible” band. In this case, all four observations gave visibility scores that fall into the partially visible range (0.415–0.469), indicating that, for this limited set of ambiguous cases, the fuzzy model produced consistent outputs that agree with expert assessments that the crescents were neither clearly invisible nor fully visible. While this consistency is encouraging, it also suggests that further calibration with a wider range of clear “No Arc” and “Fully Visible” cases is needed to fully exploit the separation between output categories. In the current dataset, none of the four test images were classified as “No Arc”, because each contained at least a faint crescent segment detectable after preprocessing and edge extraction. In future work, the system will be evaluated on datasets that intentionally include frames with no crescent (e.g., mis-pointed telescopes or heavily clouded conditions) to empirically validate and adjust the “No Arc” output region.
The specific scores on each date arise from different combinations of arc thickness and contrast within the fuzzy rule base. For example, the 28/05/2025 dataset exhibits a moderate normalized contrast and medium thickness, which activates rules associated with partially visible crescents, while the 09/05/2021 dataset has much lower thickness but still non-negligible contrast, leading to a slightly lower, yet still “Partially Visible”, score. These rule interactions reflect expert expectations that a thin yet moderately contrasted crescent can remain marginally observable under certain atmospheric conditions. For the 09/05/2021 dataset, the normalized thickness value of 0.009 falls deep within the No Arc membership function in the thickness input, but the corresponding contrast value still activates Medium contrast rules. During inference, the aggregation of rules that combine “No Arc” thickness with non-zero contrast yields a partially clipped output around the border between “No Arc” and “Partially Visible”, and centroid defuzzification shifts the final score into the lower part of the “Partially Visible” range. This behavior is consistent with the expert interpretation that the crescent is extremely thin but not completely absent At this stage, the quantitative evaluation is limited to four expert-annotated images, which is insufficient to construct a meaningful confusion matrix. A larger validation set (20-30 images) that includes clear “Visible” and “Not Visible” cases will be compiled in future work to compute accuracy and confusion matrices, and to compare the fuzzy system against baseline methods such as simple edge-thresholding or standard convolutional classifiers.
This research achieves its objective of developing a fuzzy logic-based classification system designed to reduce subjective human interpretation in assessing crescent moon visibility, particularly for daytime observations. By employing arc thickness and arc contrast as input parameters, the system effectively handled the inherent uncertainty and subtle variability found in crescent images taken under diverse atmospheric and lighting conditions. Tested on four expert-annotated observation dates, the system produced consistent visibility scores in the “Partially Visible” range, which shows potential for reliable and interpretable classification but does not yet demonstrate full discriminative power across all visibility categories due to the small sample size. The limited number of datasets used in this research is the primary limitation and prevents comprehensive statistical validation of the fuzzy rule base. Future research will focus on expanding the dataset with clearly visible and clearly non-visible crescents, validating the system against human expert classifications and baseline image processing methods, and refining the fuzzy rules and membership parameters potentially using expert surveys or optimization techniques to improve separation between “No Arc”, “Partially Visible”, and “Fully Visible” outputs. The results confirm the suitability of fuzzy logic for this task, providing a transparent, rule-based alternative to deep learning and other black-box approaches for crescent visibility assessment, and supporting more consistent and explainable decisions in Hijri calendar determination.
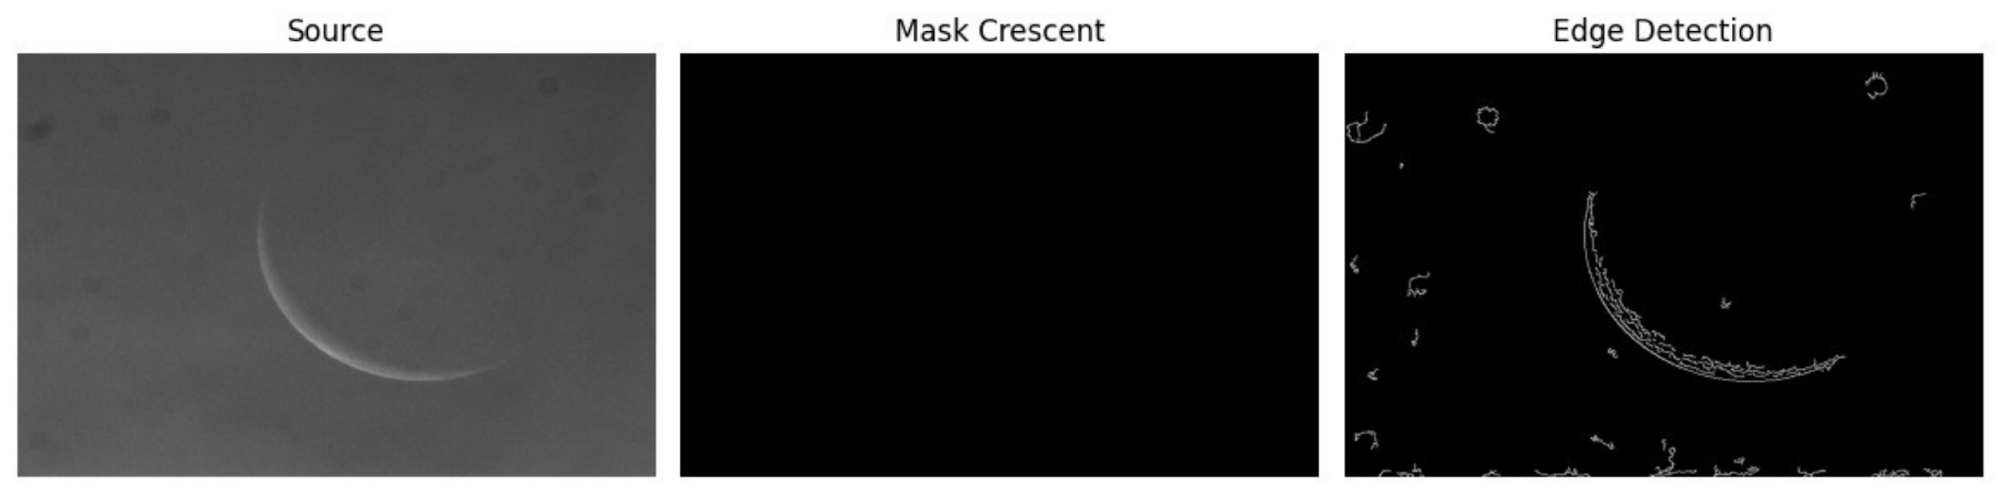
Figure 6. Output images
Table 1. The visibility score for four datasets
Dataset (DD/MM/YYYY) | Arc_contrast | Arc_thickness | Visibility score |
28/05/2025 | 0.000 | 0.373660633 | 0.469125 |
05/08/2024 | 0.387 | 0.33692145 | 0.460436667 |
16/09/2023 | 0.655 | 0.372602517 | 0.46887 |
09/05/2021 | 1.000 | 0.00900145 | 0.4154 |
- CONCLUSIONS
This research achieves its objective of developing a fuzzy logic-based classification system designed to reduce subjective human interpretation in assessing crescent moon visibility, particularly for daytime observations. By employing arc thickness and arc contrast as input parameters, the system effectively handled the inherent uncertainty and subtle variability found in crescent images taken under diverse atmospheric and lighting conditions. Testing on four separate observation dates yielded consistent visibility scores, all categorized as “partially visible”, demonstrating the method’s ability to deliver reliable and interpretable classifications, even where human judgment might otherwise vary. The results confirm the suitability of fuzzy logic for this task, offering an accessible and standardized approach to support crescent moon observation for calendrical purposes. Future research may focus on expanding the dataset, refining fuzzy rule bases, and integrating the approach into automated observation systems to further enhance its practical utility.
Author Contribution
All authors contributed equally to the main contributor to this paper. All authors read and approved the final paper.
Acknowledgement
This research was funded by the Penelitian Internal Universitas Ahmad Dahlan Tahun Akademik 2024/2025 under grant number PD-204/SP3/LPPM-UAD/XI/2024.
REFERENCES
- A. A. Afifi and A. F. Abbas, “Moderate Way Implementing Rukyah and Hisab to Determine A New Moon in Ramadan,” AL-IMAM: Journal on Islamic Studies, Civilization and Learning Societies, vol. 3, pp. 11–18, 2022, https://doi.org/10.58764/j.im.2022.3.12.
- Z. Zufriani, A. Asa’ari, J. Mirdad, A. Arzam, A. Izuddin, and A. M. Radiamoda, “Rukyat as Determination of the Lunar Month Beginning: A Method, Obstacles, and Debate in Indonesia,” JURIS (Jurnal Ilmiah Syariah), vol. 22, no. 1, p. 53, 2023, https://doi.org/10.31958/juris.v22i1.6570.
- M. S. Faid et al., “Confirmation Methodology for A Lunar Crescent Sighting Report,” New Astronomy, vol. 103, p. 102063, 2023, https://doi.org/10.1016/j.newast.2023.102063.
- H. Tartory, “Determining the Beginning of the Lunar Month By Astronomical Calculation,” Hebron University Research Journal (HURJ): B- (Humanities), vol. 17, no. 1, pp. 295–317, 2022, https://doi.org/10.60138/171202211.
- Y. Pramudya, A. R. Dhimas Prayoga Jullyantama, M. Khairul Ardi, C. Ayu Wandira, and Muchlas, “Observational Technique Development and Instruments Status in Observatorium Universitas Ahmad Dahlan,” J Phys Conf Ser, vol. 2773, no. 1, p. 012014, 2024, https://doi.org/10.1088/1742-6596/2773/1/012014.
- S. A. Hassan, “HILAAL-CTM: Algorithm to Determine and Visualize the First Visibility of Lunar Crescent Using Contrast Threshold Model,” Journal of Information Systems Engineering and Management, vol. 10, no. 49s, pp. 714–720, 2025, https://doi.org/10.52783/jisem.v10i49s.9955.
- A. Mulyadi, “Non-Astronomical Aspects of the Success of Rukyatul Hilal in East Java,” Samarah: Jurnal Hukum Keluarga dan Hukum Islam, vol. 8, no. 3, p. 1859, 2024, https://doi.org/10.22373/sjhk.v8i3.25258.
- M. Gharaybeh, “Jurisprudential Reliance on Astronomical Calculations in Determining the Beginnings of the Hijri month,” In Arabic Conference of the Arab Union for Astronomy and Space Sciences and Tools for Decision Support, pp. 160–177, 2025, https://doi.org/10.1007/978-981-96-3276-3_13.
- H. Khalfaoui and H. Guenichi, “Does Islam Promote Growth: Evidence From Arab Muslim Countries and Non-Arab Muslim Countries,” International Journal of Law and Management, vol. 64, no. 2, pp. 206–224, 2022, https://doi.org/10.1108/IJLMA-07-2021-0166.
- M. S. E. Azam and M. A. ABDULLAH, “Global Halal Industry: Realities and Opportunities,” International Journal of Islamic Business Ethics, vol. 5, no. 1, p. 47, 2020, https://doi.org/10.30659/ijibe.5.1.47-59.
- M. Al-Rajab, S. Loucif, and Y. Al Risheh, “Predicting New Crescent Moon Visibility Applying Machine Learning Algorithms,” Sci Rep, vol. 13, no. 1, p. 6674, 2023, https://doi.org/10.1038/s41598-023-32807-x.
- S. Loucif, M. Al-Rajab, R. Abu Zitar, and M. Rezk, “Toward a Globally Lunar Calendar: A Machine Learning-Driven Approach for Crescent Moon Visibility Prediction,” J Big Data, vol. 11, no. 1, p. 114, 2024, https://doi.org/10.1186/s40537-024-00979-6.
- P. D. Omodeo, “Astronomy,” in Encyclopedia of Renaissance Philosophy, pp. 1–5, 2015, https://doi.org/10.1007/978-3-319-02848-4_251-1.
- M. S. A. M. Nawawi, M. S. Faid, M. H. M. Saadon, R. A. Wahab, and N. Ahmad, “Hijri Month Determination in Southeast Asia: An Illustration Between Religion, Science, and Cultural Background,” Heliyon, vol. 10, no. 20, p. e38668, 2024, https://doi.org/10.1016/j.heliyon.2024.e38668.
- Karis Lusdianto, “The Concept of Maslahah in the Dynamics of the Rukyah and Hisab Methods for Determining the Beginning of the Lunar Month,” Istinbath : Jurnal Hukum, vol. 20, no. 01, pp. 102–122, 2024, https://doi.org/10.32332/istinbath.v20i01.9793.
- A. J. Kasim, A. Abbas, N. Adhha, and I. Mutmainnah, “Determination of Hijri Calendar in Islamic History and Its Criteria in Southeast Asia,” Journal of Al-Tamaddun, vol. 19, no. 1, pp. 247–259, 2024, https://doi.org/10.22452/JAT.vol19no1.18.
- M. S. Faid et al., “Assessment and Review of Modern Lunar Crescent Visibility Criterion,” Icarus, vol. 412, p. 115970, 2024, https://doi.org/10.1016/j.icarus.2024.115970.
- R. H. Ali and A. S. M. Khidhir, “Enhancement of Daytime Crescent Image Using Wiener Filter Based De-Blurring Technique,” in 2021 7th International Conference on Contemporary Information Technology and Mathematics (ICCITM), pp. 203–206, 2021, https://doi.org/10.1109/ICCITM53167.2021.9677768.
- A. L. A. M. Nasir et al., “Comparative Analysis of Image Processing Technique in Determining the New Crescent Moon Visibility,” J Phys Conf Ser, vol. 2915, no. 1, p. 012004, 2024, https://doi.org/10.1088/1742-6596/2915/1/012004.
- M. Z. Gazalba, A. B. Sado, and M. S. Sofyan, “Pengaruh Kelembaban Atmosfer Terhadap Visibilitas Hilal di Pantai Loang Baloq,” AL - AFAQ : Jurnal Ilmu Falak dan Astronomi, vol. 5, no. 2, pp. 211–222, 2023, https://doi.org/10.20414/afaq.v5i2.7533.
- A. Holzinger, A. Saranti, A. Angerschmid, B. Finzel, U. Schmid, and H. Mueller, “Toward Human-Level Concept Learning: Pattern Benchmarking for AI Algorithms,” Patterns, vol. 4, no. 8, p. 100788, 2023, https://doi.org/10.1016/j.patter.2023.100788.
- P. R. Brandao, “The Impact of Artificial Intelligence on Modern Society,” AI, vol. 6, no. 8, p. 190, 2025, https://doi.org/10.3390/ai6080190.
- M. Uddin, S. U. Arfeen, F. Alanazi, S. Hussain, T. Mazhar, and Md. Arafatur Rahman, “A Critical Analysis of Generative AI: Challenges, Opportunities, and Future Research Directions,” Archives of Computational Methods in Engineering, 2025, https://doi.org/10.1007/s11831-025-10355-z.
- P. Xu, J. Wang, Y. Jiang, and X. Gong, “Applications of Artificial Intelligence and Machine Learning in Image Processing,” Front Mater, vol. 11, 2024, https://doi.org/10.3389/fmats.2024.1431179.
- G. V. Lakshmi and N. Sharada, “Artificial Intelligence based Pattern Recognition,” International Journal of Engineering and Management Research, vol. 9, no. 2, pp. 29–32, 2019, https://doi.org/10.31033/ijemr.9.2.4.
- R. N. Edi, H. J. Sada, W. Anggraini, and E. N. Safitri, “Study of Literature Determination of the New Moon (Hilal) Based on Astronomy and Religion,” In AIP Conference Proceedings, vol. 3058, no. 1, p. 050008, 2024, https://doi.org/10.1063/5.0200952.
- A. N. Zulkeflee et al., “Detection of A New Crescent Moon Using the Maximally Stable Extremal Regions (MSER) Technique,” Astronomy and Computing, vol. 41, p. 100651, 2022, https://doi.org/10.1016/j.ascom.2022.100651.
- A. N. Zulkeflee et al., “Detection of A New Crescent Moon using the Maximally Stable Extremal Regions (MSER) Technique,” Astronomy and Computing, vol. 41, p. 100651, 2022, https://doi.org/https://doi.org/10.1016/j.ascom.2022.100651.
- I. Helmy, A. Shokry, D. Eid, and W. Choi, “Sky Seeing Estimation Using Nonparametric Fuzzy System of Low-Quality All-Sky Camera Images,” IEEE Trans Instrum Meas, vol. 73, pp. 1–17, 2024, https://doi.org/10.1109/TIM.2024.3425485.
- I.-C. Sang and W. R. Norris, “A Robust Lane Detection Algorithm Adaptable to Challenging Weather Conditions,” IEEE Access, vol. 12, pp. 11185–11195, 2024, https://doi.org/10.1109/ACCESS.2024.3354975.
- E. L. COHEN, “Adoption and Reform of the Gregorian Calendar,” Math Horizons, vol. 7, no. 3, pp. 5–11, 2000, https://doi.org/10.1080/10724117.2000.11975110.
- S. A. Hassan, “HILAAL-CTM: Algorithm to Determine and Visualize the First Visibility of Lunar Crescent Using Contrast Threshold Model,” Journal of Information Systems Engineering and Management, vol. 10, no. 49s, pp. 714–720, 2025, https://doi.org/10.52783/jisem.v10i49s.9955.
- D. M. Varisco, “Islamic Folk Astronomy,” In Astronomy across cultures: The history of non-Western astronomy, pp. 615–650, 2000, https://doi.org/10.1007/978-94-011-4179-6_21.
- N. Ahmad, M. S. A. M. Nawawi, M. Z. Zainuddin, Z. M. Nasir, R. M. Yunus, and I. Mohamed, “A New Crescent Moon Visibility Criteria using Circular Regression Model: A Case Study of Teluk Kemang, Malaysia,” Sains Malays, vol. 49, no. 4, pp. 859–870, 2020, https://doi.org/10.17576/jsm-2020-4904-15.
- C. A. Wandira and Y. Pramudya, “Development of a Python-Based Position Calculation System for the Moon’s Visible Position in Equatorial Coordinates,” EduFisika: Jurnal Pendidikan Fisika, vol. 8, no. 3, pp. 356–362, 2023, https://doi.org/10.59052/edufisika.v8i3.29053.
- Z. T. Allawi, “A Pattern-Recognizer Artificial Neural Network for the Prediction of New Crescent Visibility in Iraq,” Computation, vol. 10, no. 10, p. 186, 2022, https://doi.org/10.3390/computation10100186.
- L. Monferdini, G. Casella, and E. Bottani, “Development of a Fuzzy Logic-Based Tool for Evaluating KPIs in a Lean, Agile, Resilient, and Green (LARG) Supply Chain,” Applied Sciences, vol. 15, no. 14, p. 8010, 2025, https://doi.org/10.3390/app15148010.
- M. Al-Rajab, S. Loucif, and Y. Al Risheh, “Predicting new crescent moon visibility applying machine learning algorithms,” Scientific Reports, vol. 13, no. 1, p. 6674, 2023, https://doi.org/10.1038/s41598-023-32807-x.
- N. Ahmad, N. I. N. Mohamad, R. Abdul Wahab, M. S. A. Mohd Nawawi, M. Z. Zainuddin, and I. Mohamed, “Analysis Data of the 22 Years of Observations on the Young Crescent Moon at Telok Kemang Observatory in Relation to the Imkanur Rukyah Criteria 1995,” Sains Malays, vol. 51, no. 10, pp. 3415–3422, 2022, https://doi.org/10.17576/jsm-2022-5110-24.
- T. Natarajan and S. Pichai, “Transition from Waterfall to Agile Methodology - An Action Research Study,” IEEE Access, vol. 12, pp. 49341–49362, 2024, https://doi.org/10.1109/ACCESS.2024.3384097.
- C. A. Crespo-Santiago and S. de la C. Dávila-Cosme, “Waterfall method: a necessary tool for implementing library projects,” HETS Online Journal, vol. 1, no. 2, pp. 81–92, 2022, https://doi.org/10.55420/2693.9193.v1.n2.91.
- K. Cox, M. Niazi, and J. Verner, “Empirical Study of Sommerville and Sawyer’s Requirements Engineering Practices,” IET Software, vol. 3, no. 5, pp. 339–355, 2009, https://doi.org/10.1049/iet-sen.2008.0076.
- O. E. Olorunshola and F. N. Ogwueleka, “Review of System Development Life Cycle (SDLC) Models for Effective Application Delivery,” in Information and Communication Technology for Competitive Strategies (ICTCS 2020), pp. 281–289, 2022, https://doi.org/10.1007/978-981-16-0739-4_28.
- Q. Yas, A. Alazzawi, and B. Rahmatullah, “A Comprehensive Review of Software Development Life Cycle methodologies: Pros, Cons, and Future Directions,” Iraqi Journal for Computer Science and Mathematics, vol. 4, no. 4, pp. 173–190, 2023, https://doi.org/10.52866/ijcsm.2023.04.04.014.
- S. Pargaonkar, “A Comprehensive Research Analysis of Software Development Life Cycle (SDLC) Agile & Waterfall Model Advantages, Disadvantages, and Application Suitability in Software Quality Engineering,” International Journal of Scientific and Research Publications, vol. 13, no. 8, pp. 120–124, 2023, https://doi.org/10.29322/IJSRP.13.08.2023.p14015.
- B. Wilkerson and L.-K. L. Trellevik, “Sustainability-Oriented Innovation: Improving Problem Definition Through Combined Design Thinking and Systems Mapping Approaches,” Think Skills Creat, vol. 42, p. 100932, 2021, https://doi.org/10.1016/j.tsc.2021.100932.
- M. Y. Taher and F. M. Abdulla, “Evaluating the Development of the Crescent Visibility Criteria,” Iraqi Journal of Science, vol. 65, no. 1, pp. 555–566, 2024, https://doi.org/10.24996/ijs.2024.65.1.43.
- A. Alshibani, B. E. Hafez, M. A. Hassanain, A. Mohammed, M. Al-Osta, and A. Bahraq, “Fuzzy Logic-Based Method for Forecasting Project Final Cost,” Buildings, vol. 14, no. 12, p. 3738, 2024, https://doi.org/10.3390/buildings14123738.
- R. Muztaba, H. L. Malasan, and M. Djamal, “Deep Learning for Crescent Detection and Recognition: Implementation of Mask R-CNN to the Observational Lunar Dataset Collected with the Robotic Lunar Telescope System,” Astronomy and Computing, vol. 45, p. 100757, 2023, https://doi.org/10.1016/j.ascom.2023.100757.
- J. A. Utama et al., “Young Lunar Crescent Detection Based on Video Data with Computer Vision Techniques,” Astronomy and Computing, vol. 44, p. 100731, 2023, https://doi.org/10.1016/j.ascom.2023.100731.
- A. A. Romanov, A. A. Filippov, and N. G. Yarushkina, “An approach to generating fuzzy rules for a fuzzy controller based on the decision tree interpretation,” Axioms, vol. 14, no. 3, p. 196, 2025, https://doi.org/10.3390/axioms14030196.
- I. Hussain, “A Stable Region-Based Image Segmentation Model Integrating Fuzzy Logic and Geometric Principles,” Acadlore Transactions on AI and Machine Learning, vol. 4, no. 2, pp. 124–136, 2025, https://doi.org/10.56578/ataiml040205.
- C. Selvam, R. J. J. Jebadass, D. Sundaram, and L. Shanmugam, “A Novel Intuitionistic Fuzzy Generator for Low-Contrast Color Image Enhancement Technique,” Information Fusion, vol. 108, p. 102365, 2024, https://doi.org/10.1016/j.inffus.2024.102365.
AUTHOR BIOGRAPHY
Yudhiakto Pramudya, is an Assistant Professor at Universitas Ahmad Dahlan, Indonesia. He received his Ph.D. in Physics from Wesleyan University, USA, with research on superfluid dynamics, and previously studied condensed matter physics at the International Centre for Theoretical Physics, Trieste. His current research interests include wave and oscillation phenomena, fluid dynamics, astronomy, and physics education. He actively integrates computational and experimental approaches in teaching and research, fostering students’ understanding of physical concepts through modeling and observation. Dr. Pramudya has published in several international journals and continues to develop innovations in physics education and astronomical instrumentation. Email: yudhiakto.pramudya@pfis.uad.ac.id ORCID: https://orcid.org/0009-0003-3121-5020 |
|
Kartika Firdausy, received her Bachelor, Master, and Doctoral degrees from Universitas Gadjah Mada, Yogyakarta, Indonesia. She is a lecturer and researcher at the Electrical Engineering Department, Universitas Ahmad Dahlan, Yogyakarta, Indonesia. Her research interests include image processing, computer vision, and pattern recognition. Email: kartika.firdausy@te.uad.ac.id ORCID: https://orcid.org/0000-0001-5912-5252 |
|
Adi Jufriansah, researcher exploring advanced technologies including machine learning, deep learning, Blockchain, Virtual Reality (VR), Augmented Reality (AR), and the Internet of Things (IoT) and their applications in physics and real-world scenarios. My work focuses on accelerating physics modeling, enhancing data security, and improving visualization through immersive simulations, with potential impacts in education, industry, and disaster mitigation. Email: adijufriansah@mail.ugm.ac.id ORCID: https://orcid.org/0000-0003-0659-8093 |
|
Okimustava, is a lecturer at the Physics Education Study Program, Faculty of Teacher Training and Education, Universitas Ahmad Dahlan, Yogyakarta, Indonesia. He obtained his Bachelor’s and Master’s degree in Physics Education from Universitas Ahmad Dahlan. Currently, he serves as a lecturer in several courses related to physics and physics education and holds the position of Secretary of the Master’s Program in Physics Education at UAD. His research interests include technology-based physics learning, development of physics learning media and instruments, physics instrumentation, science learning assessment, and professional development of physics teachers. In addition to academic activities, he is also actively involved in various community service programs and research collaborations focusing on improving the quality of physics learning in schools and society. Email: okimustava@pfis.uad.ac.id ORCID: https://orcid.org/0000-0002-4982-7952 |
|
Itsnaini Irvina Khoirunnisa, received the S.Kom. degree from the Faculty of Industrial Technology, Universitas Ahmad Dahlan, Yogyakarta, Indonesia, in 2024. Currently, she is pursuing a Master’s degree in Informatics at UAD, Yogyakarta, Indonesia. Her research interests include machine learning, deep learning, and computer vision. Email: 2407048006@webmail.uad.ac.id ORCID: https://orcid.org/0009-0007-4318-5032 |
|
Bayu Krisna Murti, graduate of Universitas Ahmad Dahlan, Yogyakarta (S.Kom. in Faculty of Industrial Technology, 2024), and is currently pursuing an M.Kom. in Informatics at UAD. His research interests include machine learning, deep learning, computer vision, and software engineering, with a focus on developing AI models for visual data processing and deploying them in real-world applications. Email: 2408048018@webmail.uad.ac.id ORCID: https://orcid.org/0009-0005-6248-2097 |
|
Rihmah Alifah Hidayah, is a passionate and enthusiastic student, currently a graduate of the Physics Education study program at Universitas Ahmad Dahlan, Yogyakarta. In addition to pursuing academic excellence, Rihmah is actively involved in various student organizations, contributing to the dynamic campus community. Her commitment extends beyond the university, as she actively participates in community activities. Email: rihmah2100007012@webmail.uad.ac.id |
|
Murinto, received his M.Kom from Computer Sciences Universitas Gadjah Mada, Yogyakarta in 2004 and Doctor (Dr) from Computer Sciences Universitas Gadjah Mada in 2021. Currently working as Associate Professor in Universitas Ahmad Dahlan in Yogyakarta also. He is senior researcher in the college, his topics research is image processing, computer vision, machine learning, Artificial Intelligence. Email: murintokusno@tif.uad.ac.id ORCID: https://orcid.org/0000-0003-4079-0900 |
|
Muhammad Maulidan, is a researcher at the Pusat Studi Astronomi Universitas Ahmad Dahlan (UAD), Yogyakarta, Indonesia. He obtained his bachelor’s degree in Physics from Universitas Ahmad Dahlan. His research interests include instrumentation, material physics, and observational astronomy. Email: m.maulidan@staff.uad.ac.id |
Yudhiakto Pramudya (Fuzzy Logic-Based Classification of Crescent Moon Images Using Contrast and Thickness)