ISSN: 2685-9572 Buletin Ilmiah Sarjana Teknik Elektro
Vol. 7, No. 3, September 2025, pp. 450-467
Modified Orca Algorithm Based on the Navigation Behavior for Optimal Unit Commitment in Power Systems
Lilis Widayanti 1,2, Arif Nur Afandi 1, Heru Wahyu Herwanto 1
1 Department of Electrical and Informatics Engineering, Universitas Negeri Malang, Malang, Indonesia
2 Department of Computer System, Institut Teknologi dan Bisnis Asia Malang, Malang, Indonesia
ARTICLE INFORMATION |
| ABSTRACT |
Article History: Received 14 May 2025 Revised 30 July 2025 Accepted 03 September 2025 |
| 
This study presents the Novel Navigation Orca Algorithm (NNOA), an innovative optimization algorithm derived from Orca Algorithm (OA). NNOA addresses the unit commitment (UC), a complex issue in power systems that focuses on scheduling generator units to meet power demand while taking into account each generator's limitations, with the goal of lowering operating costs and gas emissions. NNOA exhibits orca hunting behavior through echolocation, utilizing the Doppler effect principle to promote adaptive movement and circumvent local optima, as in contrast to OA's wave-based exploration. The algorithm was evaluated utilizing IEEE 30-bus system data, focused on the Integrated Economic and Emission Dispatch (IEED) objective. The performance was evaluated against OA and Particle Swarm Optimization (PSO) through convergence analysis over 10 and 30 trials, each consisting of 100 iterations. NNOA decreased the IEED value by 1.33% in regard to OA and 1.51% in regard to PSO. NNOA achieved convergence in 10 iterations, whereas OA required 35, indicating 71.4% faster convergence rate. Wilcoxon rank-sum tests demonstrated significant differences between NNOA, OA, and PSO pairings. NNOA's per-iteration computation time exceeds the time needed by PSO, but it remains economical and profitable. Significantly, NNOA contributes minimizing the fuel consumption and emissions cost, which has a positive environmental impact. It effectively adheres to the required constraints, which include the hourly power demand and generator output limits. Future research is encouraged to apply NNOA to larger-scale power systems and explore its hybridization with PSO to enhance computational efficiency, result consistency, and robustness in practical grid operations. |
Keywords: Metaheuristic Optimization; Unit Commitment; Orca Algorithm; Power System; Economic Dispatch |
Corresponding Author: Arif Nur Afandi, Department of Electrical and Informatics Engineering, Universitas Negeri Malang, Malang, Indonesia. Email: an.afandi@um.ac.id |
This work is open access under a Creative Commons Attribution-Share Alike 4.0 
|
Document Citation: L. Widayanti, A. N. Afandi and H. W. Herwanto, “Modified Orca Algorithm Based on the Navigation Behavior for Optimal Unit Commitment in Power Systems,” Buletin Ilmiah Sarjana Teknik Elektro, vol. 7, no. 3, pp. 450-467, 2025, DOI: 10.12928/biste.v7i3.13645. |
INTRODUCTION
Annually, power plants consume large amounts of energy to generate a reliable supply of electricity to meet the needs of society and industry [1][2]. This high level of consumption emphasizes the importance of efficiency and sustainability in the electricity generation process [3][4]. The application of more efficient and environmentally friendly technologies to reduce negative impacts on natural resources and the environment is an important need [5][6]. The power system's energy supply is achieved by the integration of diverse generating units. This combination needs to take into account both economic and environmental factors, as the increasing awareness of people to protect the environment demands the provision of electricity at low cost and with minimal emission levels [7][8]. Various methodologies and research continue to be developed to achieve more economical energy management and reduce negative impacts in power plant operations, one of which is through a comprehensive analysis of the Unit Commitment (UC) problem [9].
The UC problem is a scheduling issue in power generation focused on fulfilling electricity demand, comprising two primary assignments, establishing the on/off schedule of generating units and allocating the load among generators while adhering to operational restrictions [10][11]. The principal constraints in the unit commitment problem related to adhering to the minimum and maximum generation capacity of power units, alongside ensuring stability between total power production and load demand. Supplementary constraints encompass technical operating limitations, including minimum operational durations for units and reserve power constraints. Optimizing UC is often associated with the objective of minimizing operational costs and emissions [12]. Optimization efforts in the UC problem can be combined with Economic Load Dispatch (ELD) and Emission Dispatch (ED), forming the Integrated Economic and Emission Dispatch (IEED) problem [13]. However, solving the UC problem does not always involve environmental factors, as it often focuses solely on optimizing ELD. The UC problem with IEED is an example of a nonlinear optimization problem in the power system sector, which can be solved using various approaches [14][15]. Investigation of the UC problem has become a complex one [16][17]. To address the UC problem, it's very hard to combine conventional methodologies because it's hard to compute multi-objective functions with various constraints to obtain good results [18]. These complex systems, which combine binary generator schedule decisions (on/off) with power distribution, often require advanced methodologies, such as metaheuristic algorithms, to find the optimal operational cost solutions [19]. One of the key advantages of metaheuristic algorithms is their ability to efficiently explore large and complex solution spaces, enabling the discovery of near-optimal solutions with relatively low computational cost [20][21].
Metaheuristic algorithms are sophisticated optimization techniques employed to address complex problems that conventional approaches struggle to resolve. They examine natural phenomena, such as genetics and swarm behaviour, to identify optimal solutions in extensive research domains [22][23]. Metaheuristic algorithms can be classified into various groups, including evolutionary [24], swarm-based [25], physics-based [26], and human-based algorithms [27], each possessing distinct properties and uses [28]. Although effective in exploring extensive search spaces, these algorithms typically do not assure a globally optimal solution, but rather a near-optimal one within a tolerable computational timeframe [29][30]. This aspect fundamentally corresponds with the concepts of the No Free Lunch (NFL) theorem, which asserts that no singular approach can proficiently address all optimization challenges [31]. Prior studies predominantly addressed the unit commitment problem through a singular objective of minimizing operational costs, however research focusing on dual objectives, namely minimizing both costs and emissions remains scarce, indicating numerous avenues for exploration [32].
The newly invented metaheuristic method by Afandi [33], known as the orca algorithm (OA), has been utilized in several instances of both continuous and binary issues. OA is an artificial intelligence modelled on the hunting strategies of orca whales, specifically related to prey selection and pursuit. OA is defined by the parameters of orca count, wave factor, prey quantity, and prey search cycle [33]. Afandi's research [33] on OA illustrates its ability for swift and effective convergence in resolving power system scheduling challenges associated with load flexibility from electric vehicles. The process of this algorithm is presented in selecting phase, speeding phase, and ambushing phase [33]. OA has not been rigorously compared with competing methods and has not been assessed for robustness in multi-area systems or dynamic conditions. So, it wasn't clear how well it worked or how well it could be scaled up, especially in more complicated optimization situations like IEED. Also, early versions of OA didn't use scientifically inspired features like echolocation, which real orcas use to find prey and navigate in an upright position. These limitations offer the potential for improvement by incorporating more realistic behavioural traits into the algorithm.
Based on this background, we developed a new approach by modifying the OA based on prey-hunting navigation behavior, referred to as the Novel Navigation Orca Algorithm (NNOA). NNOA exhibits orca hunting behavior through echolocation, utilizing the Doppler effect principle to promote adaptive movement and circumvent local optima, as in contrast to OA's wave-based exploration. The integration of position shift, considering the Doppler effect into the OA creates a navigation mechanism that assists orca whales in hunting prey. The orca whale recognizes the movement and size of prey through the reflection of sound waves [34][35]. The Doppler effect is a physical phenomenon that happens when the frequency or wavelength of sound waves that an observer (orca) hears changes because the source (prey) and the observer are moving relative to one other. This impact is mathematically changed in the algorithm to make the orca's movement in the solution search as fast and accurate as possible, with a concentration on speed and direction calculations. With the Doppler effect, each orca can adjust its speed and direction according to its movement relative to the prey [36]. This dynamic adaptation provides variation in the resulting solutions, avoiding an early solution that is too fast and thus improving the algorithm’s ability to find the optimal point in a complex search space with many possible solutions. This dynamic adaptation facilitates movement diversification during the exploratory phase when the orca is distant from the prey, and enhances intensification or exploitation when the orca nears the target solution. This conduct corresponds with the concepts of exploration and exploitation in metaheuristic algorithms [37]. Exploration seeks to extensively investigate the solution space to circumvent local optima, whereas exploitation concentrates on deepening the search around the most promising solutions identified too far. The integration of the Doppler effect in NNOA functions as an adaptive controller that sustains equilibrium between exploration and exploitation, essential for identifying the global optimal solution within a complex and multimodal search space.
The modified version of OA will be subjected to a comparative performance assessment against metaheuristics that are extensively used, such as particle swarm optimization (PSO) [30] and OA [33], in order to verify its effectiveness and robustness. In this study, OA serves as the primary benchmark, as NNOA is a modified variation of OA. This selection enables us to accurately evaluate the performance enhancement brought about by the new navigation algorithm on NNOA. Concurrently, PSO is a reputed powerful metaheuristic algorithm. PSO is frequently employed as a standard in optimization research due to its strong performance across diverse tasks [38][39].
This research contributes to adjust OA to more closely align with the natural behavior of orca whales, which is anticipated to enhance the IEED value in the UC problem. The new algorithm named the Novel Navigation Orca Algorithm (NNOA). By integrating orcas' advanced hunting behavior, including doppler effect, NNOA has the ability to discover optimal solutions. The capacity of NNOA in optimizing the unit generator scheduling in power systems directly impacts energy reduction in the electrical grid, supports decision-makers in formulating energy efficiency and cost policies, and can lower electricity costs paid by consumers. This indirectly contributes to the sustainability of the power system in the future. To make reading this article easier, the researcher has arranged the paper as follows: Section 2 describes the methodology utilized in this study, Section 3 offers the experimental results, and Section 4 concludes the findings.
METHODS
Research Data
IEEE 30-buses system is a problem to assess the algorithm's robustness in solving the unit commitment problem in this research. The system includes 30 buses, 41 lines, and 15 load buses [40][41]. The system consists of six generators. The unit commitment optimization problem generates a combination of generator power and schedule within a certain time frame, taking cost and emission coefficients into account, to meet the system's demand. The IEEE 30-bus system is a benchmark test system frequently utilized in power systems research. It denotes a medium-scale power grid that is intricate, yet feasible for the simulation and evaluation of optimization techniques [25]. Table 1 represents the generator cost and emission coefficient in IEEE 30 bus System. Table 2 shows the demand that use in this research.
Table 1. Generator Cost and Emission Coefficient in IEEE 30-Buses System
Generator | 
| 
| 
| 
| 
| 
|  (MW) (MW)
|  (MW) (MW)
|
Gen 1 | 0.00375 | 2.00 | 0 | 0.0126 | -1.1000 | 22.983 | 50 | 200 |
Gen 2 | 0.01750 | 1.75 | 0 | 0.0200 | -0.1000 | 25.313 | 20 | 80 |
Gen 3 | 0.06250 | 1.00 | 0 | 0.0270 | -0.0100 | 25.505 | 15 | 50 |
Gen 4 | 0.00834 | 3.25 | 0 | 0.0291 | -0.0050 | 24.900 | 10 | 35 |
Gen 5 | 0.02500 | 3.00 | 0 | 0.0290 | -0.0040 | 24.700 | 10 | 30 |
Gen 6 | 0.02500 | 3.00 | 0 | 0.0271 | -0.0055 | 25.300 | 12 | 40 |
Table 2. Power Demand in Every Hour (MW)
Hour | Demand (MW) | Hour | Demand (MW) |
1 | 130 | 13 | 420 |
2 | 140 | 14 | 410 |
3 | 150 | 15 | 390 |
4 | 160 | 16 | 370 |
5 | 180 | 17 | 340 |
6 | 200 | 18 | 310 |
7 | 220 | 19 | 280 |
8 | 250 | 20 | 250 |
9 | 300 | 21 | 220 |
10 | 330 | 22 | 180 |
11 | 360 | 23 | 150 |
12 | 400 | 24 | 130 |
Problem Formulation
Objective Function
The mathematical formulations for Economic Load Dispatch (ELD) [42], Emission Dispatch (ED) [43], and Integrated Economic Emission Dispatch (IEED) are articulated as Eq. (1), Eq. (2), and Eq. (3) respectively.
 signifies the fuel cost expressed in dollars per hour ($/hour), whereas
  indicates the exhaust emissions generated by the power system, measured in kilograms per hour (kg/hour). The input comprises the electrical power for each generator, represented as
  , where g signifies the total count of generators. The fuel cost coefficients for the IEEE 30-bus system are denoted as
  . The parameter values for gas emissions are represented as
  in IEEE 30-bus system.
  represents the IEED value, integrating w as a compromise factor that indicates the system's priority. The value of
  used is between 0 to 1 (
 . In this research,
  was determined 0.6.
Constraints
In an IEED situation,  has to meet the hourly power demand and be able to deal with power shortages or surpluses. Eq. (4) shows how much power is needed in an IEED instance.
  is the total power demand and
  is the power loss.
| 
| (4) |
The power to be distributed has size limits that follow IEEE 30-bus system data. The value of power as denoted . The term  represents the minimum power value. represents the maximum power. The constraints on power output are defined in Eq. (5). This approach is constrained by the presumption that power loss is negligible because its value is close to zero. The power generated by the generator is assumed to be equivalent to the power used by the end user.
| 
| (5) |
A proficient generrating unit scheduling system is essential to optimize power generation and adequately satisfy load demand. A proficient scheduling strategy utilizing artificial intelligence programming methods is implemented for various producing units. Figure 1 illustrates an optimal scheduling system for six generating units utilize a standard IEEE 30-Bus System dataset [44]. The system has power load demand constraints and an objective function in the form of an IEEE function, which results in generator scheduling optimization and optimal power distribution.
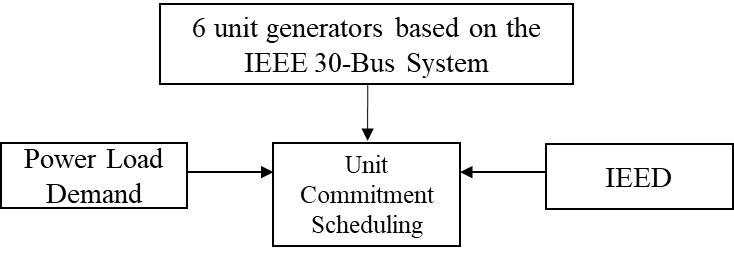
Figure 1. The system Model
The Proposed Algorithm for Unit Commitment
This research introduces an innovative algorithm. The NNOA algorithm is a modification of OA. NNOA brings the actual situation, that is use the echolocation appliances for orca’s prey hunting. Echolocation is a sensory system that helps hunters locate the location of prey [45]. The echolocation mechanism detects and distinguishes prey by emitting sound waves [46]. When approaching its prey, the increased echolocation click frequency due to the doppler effect conveys crucial information about the prey's distance and speed [34]. The obvious difference among OA and NNOA is in the prey selection phase, OA uses the wave factor, while in the NNOA algorithm, the wave factor is replaced by the echolocation factor using the doppler effect. During the exploration phase, orca whales locate their prey by adjusting their speed and position through the mathematical model of doppler effect. A visual representation of the Doppler effect's placement within OA can be seen in the following flowchart, where NNOA integrates the Doppler effect during the selecting phase as like Figure 2.
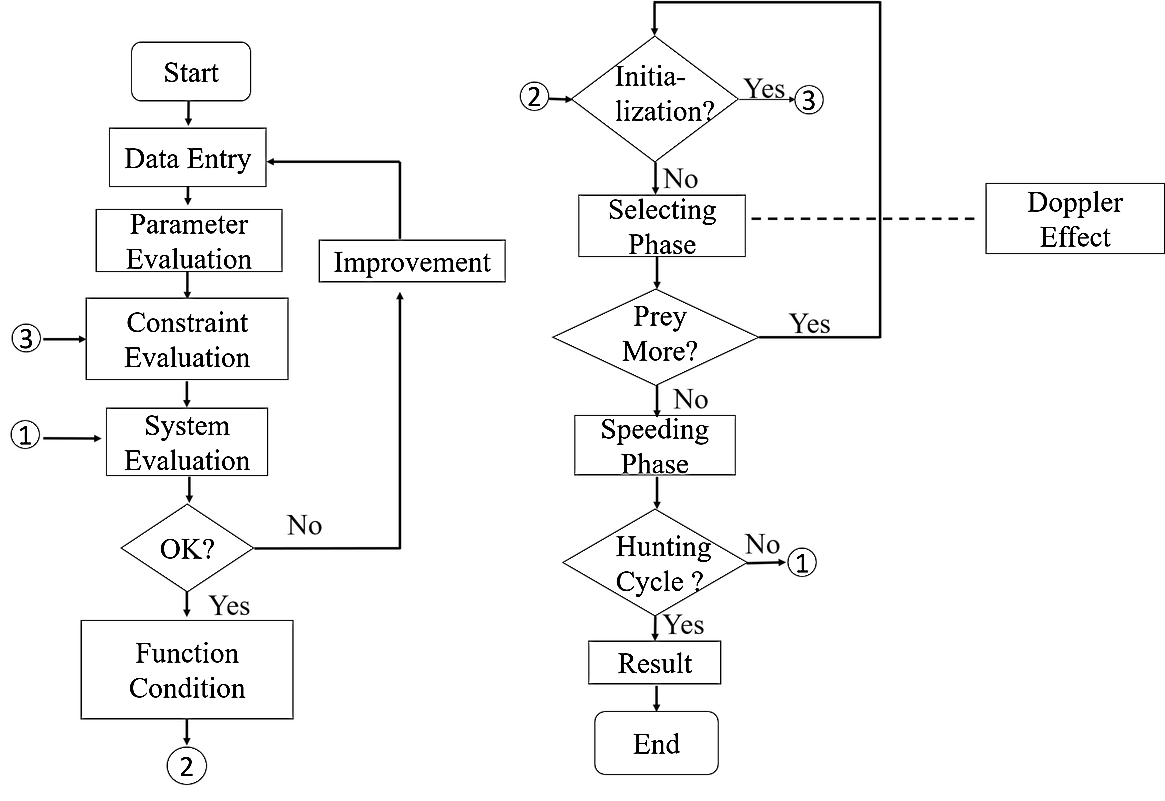
Figure 2. Flowchart of NNOA based modified OA [33]
In particular, Orcas use echolocation to navigate and communicate in the dark and vast maritime habitat. During this process, orcas generate high-frequency clicking sounds into the surrounding environment [47],[34]. Doppler effect is a periodic change in frequency when an observer moves relative to the source. With Doppler effect, the perceived frequency of sound can change due to the relative motion between the observer and the source [48]. Compared to the frequency of the sound itself, the received frequency is higher during approach, identical during passing, and lower during movement. Here is the origin formula of Doppler effect shown by Eq. (6) [36]:
| 
| (6) |
Let  denote the frequency of sound perceived by the listener,
 represent the velocity of sound transmission in water,
  signifies the relative velocity of the listener with respect to the sound source (positive when approaching and negative when receding),
  indicate the relative velocity of the sound source concerning the listener (positive when moving away and negative when approaching), and
  denote the frequency emitted by the sound source. Table 3 displays the pseudocode, providing a systematic depiction of the revised NNOA algorithm. Whereas, Figure 3 provides a comprehensive flowchart to elucidate the entire implementation and operation of the NNOA algorithm. This graphic depicts the execution sequence of each phase, from initialization to termination, and demonstrates the interaction of the main components during the optimization process.
Table 3. Pseudocode of NNOA
NNOA Pseudocode |
01: Initialization of NNOA parameters 02: Initializing the population (the velocity and generator unit ON/OFF status combinations as the orca’s position, ON/OFF status is represented by 0 or 1 which is generated randomly) 03: Assign starting power outputs randomly that satisfies the system constraints provided (4) and (5). 04: Calculate the objective function of IEED. Save the best IEED value and orca's position. 05: Selecting Phase. For each iteration, the orca’s position and velocity update using the Doppler effect that is determined by Eq. (7) and Eq. (8). Eq. (9) and Eq. (10) are the formula of updating orca’s position and velocity.  symbolizes the hunting cycle which indicates the number of iterations. symbolizes the hunting cycle which indicates the number of iterations.  represents of the number of orca. represents of the number of orca.  represents the velocity of the orca that is randomly generated in the step 02, represents the velocity of the orca that is randomly generated in the step 02,  represents the velocity of prey that is randomly generated. Conceptually, Eq. (7) is a form of Euclidean distance D in the velocity domain, Where F represents the sound frequency of orca. Eq. (8) delineates the intensity of the Doppler effect ( represents the velocity of prey that is randomly generated. Conceptually, Eq. (7) is a form of Euclidean distance D in the velocity domain, Where F represents the sound frequency of orca. Eq. (8) delineates the intensity of the Doppler effect ( ) as an exponential function of the velocity differential between the orca and its prey, multiplied by the orca's sound frequency. An increased value of 𝐷 correlates with a diminished , illustrating the biological response mechanism of orca whales to variations in sound frequency induced by movement. ) as an exponential function of the velocity differential between the orca and its prey, multiplied by the orca's sound frequency. An increased value of 𝐷 correlates with a diminished , illustrating the biological response mechanism of orca whales to variations in sound frequency induced by movement.  is the best orca position at each iteration, is the best orca position at each iteration,  represents the average orca position from one iteration to the next, while represents the average orca position from one iteration to the next, while  is the current orca position. is the current orca position.
06: Update the orca group position with Eq. (11) and Eq. (12)
| 
| (11) |
| (12) |
With  is the average position of orca. is the average position of orca.  represents the number of orca, represents the number of orca,  = [-1,1], = [-1,1],  , A is the ambushing rate with value 0.5. , A is the ambushing rate with value 0.5. 07: Update the best position based on  08: Compute velocity acceleration: acceleration update based on the swarm's average velocity with Eq. (13)
| 
| (13) |
Update the velocity acceleration  . The orca's position is then updated based on its velocity. The velocity is utilized to update the position of the orca . The orca's position is then updated based on its velocity. The velocity is utilized to update the position of the orca  . . 09: Speeding Phase. Calculate the speeding position with Eq. (14)
| 
| (14) |
To convert the value of  use the condition as like Eq. (15) and Eq. (16): use the condition as like Eq. (15) and Eq. (16):
| 
| (15) |
| (16) |
10: Adjust the power and total power based on the ON-OFF status indicated by 1 and 0 11: Ascertain the expenses and emissions by employing the established power distribution. 12: Save the best position. Revise the optimal solution. If the current IEED value is less than the preceding one, then designate it as the optimal IEED value. The orca locations indicating ON/OFF state and power output are revised according to the optimal IEED value. 13: Ascertain if the number of iterations has reached the maximum threshold. If confirmed, the process is suspended. 14: End |

Figure 3. Flowchart for implementation of NNOA
Maintaining a balance between power generation and demand is crucial for achieving the goals of an effective and efficient power system. Compiling the hourly change of generated electricity necessitates meticulous calculations. The steps in generating power from generator units are listed below.
- Generates a combination of ON or OFF status of each generator in each hour for 24 hours on each generated particle.
- Randomly set the power that meets the constraints of each generator that has an ON status. For generators that have OFF status, it is set to have power with a minimum limit value.
- Calculate the total power output for each particle per hour.
- If the total hourly power of each particle exceeds the power demand, it is necessary to reduce the power. Power reduction is applied to units that produce power above their minimum limit. As long as the difference between total power and demand is greater than an epsilon (a tiny number close to 0), it will be adjusted iteratively.
- Increase power if total power is less than demand. We will only try to increase the unit's power if it is generating power below its maximum limit. As long as the difference between demand and total power is still greater than epsilon (a tiny number close to 0), it will be adjusted iteratively.
- Ensure that the power for each unit does not exceed its minimum or maximum power limit. 7. Power demand adjustment is complete.
Evaluation and Comparison Design
To test the effectiveness, efficiency, and stability of the NNOA algorithm, the outcomes of solving the UC issue using OA and PSO were compared. The evaluation is done using descriptive statistics and display of convergence values in 30 trials for 100 iterations on each algorithm [49]. Then the mean convergence value in 30 trials is compared and shown. For each experiment, the statistical findings recorded include the best solution, average, and standard deviation. From 30 independent trials, boxplots were produced to evaluate the efficacy of all three techniques based on overall operational costs as an objective function [50]. In addition, to statistically confirm the performance differences among the algorithms, a non-parametric test named Wilcoxon rank-sum tests was performed on the objective function values derived from 30 independent trials, with a significance threshold of  0.05.
0.05.
In this study, OA is the direct benchmark since NNOA is a modified variant of OA. This selection allows us to precisely assess the performance improvement introduced by the new navigation method on NNOA. Meanwhile, PSO is a popular and well-known efficient metaheuristic algorithm. PSO is often used as a benchmark in optimization research thanks to its robust performance in various challenges [38][39],[9],[51]. In the test scenario, exposing the parameters of each algorithm is important to know the test conditions. Parameter selection is crucial to achieve the efficiency of a metaheuristic algorithm, as its performance is greatly influenced by the parameters used [52][53]. Table 4 summarizes the parameter settings used for the comparative analysis of NNOA, OA, and PSO. The population size N for NNOA, OA, and PSO is established at 5, with the number of iterations (it) fixed at 100, to guarantee uniform search effort among the algorithms. Our preliminary investigations revealed that expanding the population size beyond 5 resulted in negligible performance gains while dramatically increasing calculation time. Based on the experiments for NNOA and OA, there is a distinction in that OA has a parameter T which is the wave height whereas NNOA does not. The shift is because in OA to update the speed and position of the orca is inspired by the seawater wave component, but in NNOA the seawater wave factor is replaced by the doppler effect which depicts echolocation behavior.
Table 4. Parameter Setting of NNOA, OA, and PSO
Algorithm | Parameters |
NNOA | N = 5, it = 100, F = 2, B = [0,1], S = random (0, N), Bp = [0,1], A = 0.5, = [-1,1] |
OA | N = 5, it = 100, B = [0,1], F = 2, S = random (0, N), T = (0,1), Bp = [0,1], A = 0.5, = [-1,1] |
PSO | 
|
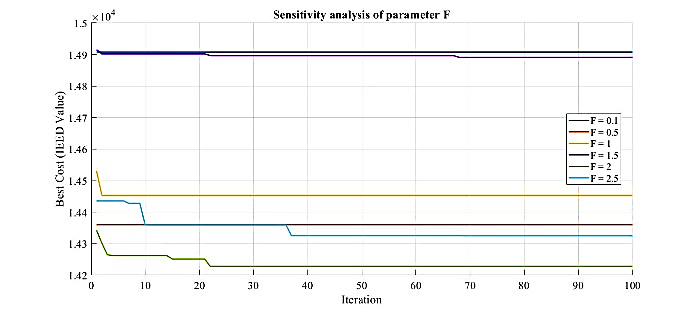
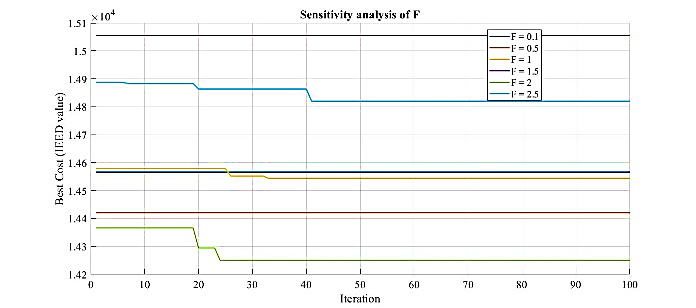
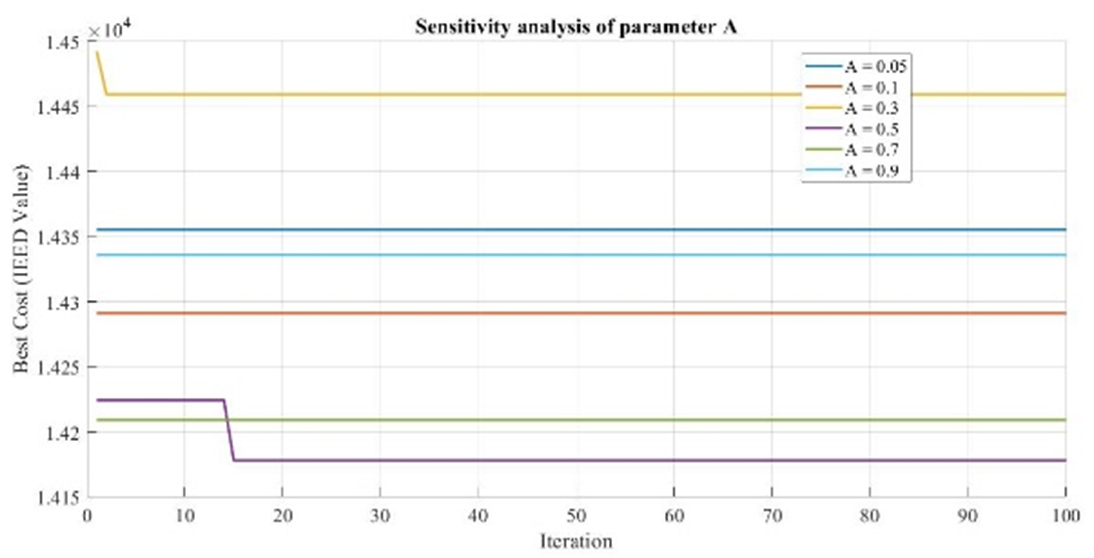
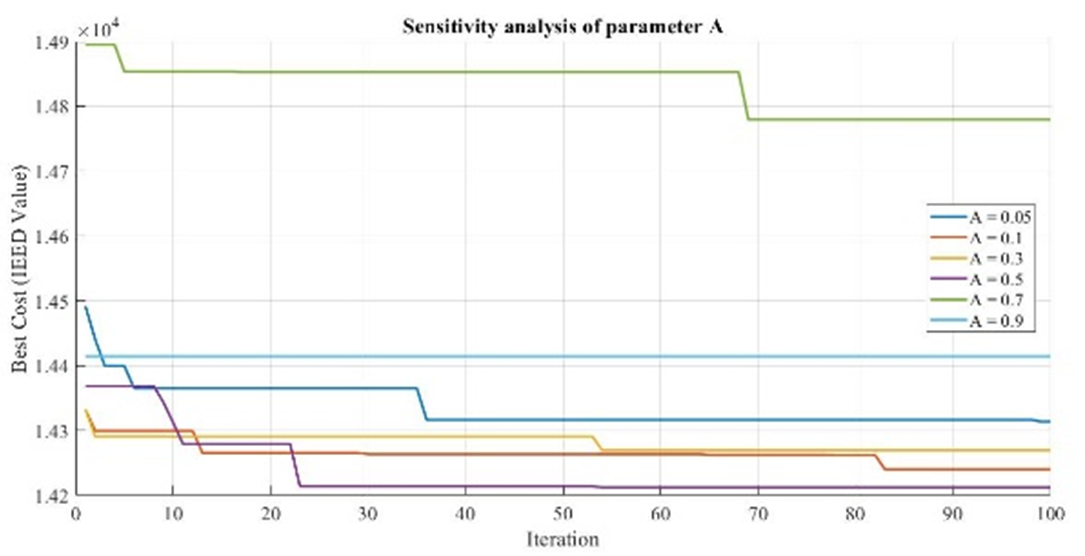
Through extensive experiments, the value of F was set to 2, and A was assigned a value of 0.5. This can be observed from the parameter sensitivity graphs shown in Figure 4(a) and Figure 4(b) and Figure 5(a)5b. The parameter values for OA refer to the NNOA parameters obtained through many experiments. This approach was taken because NNOA is a modification of OA. The PSO parameter values consisting of  , used for the comparison algorithm in this study were inspired by several previous studies [54][55].
|
(a) |
|
(b) |
Figure 4. Sensitivity analysis of F value
|
(a) |
|
(b) |
Figure 5. Sensitivity analysis of A value
- RESULT AND DISCUSSION
Result
In this scenario, NNOA is employed to tackle the UC problem of identifying the ON or OFF status of each producing unit. Generating units with OFF state are configured to produce electricity at minimum, according to the system policy, whereas units with ON status are operated with power output between the minimum and highest authorized limits. Table 5 presents the outcomes of the power allocation to satisfy the hourly energy requirements. The results provided show that Generator 1 operates non-stop for 24 hours. This confirms the role of generator 1 as the main generator that ensures system stability. Meanwhile, Generators 2, 3, 4, 5, and 6 were activated gradually. Generator 2 operates for 18 hours, generator 3 for 15 hours, generator 4 for 14 hours, generator 5 for 14 hours, and generator 6 for 17 hours. This startup technique makes the least material cost value, but the emission gas produced is still higher than other algorithms. In this study, there is no limit on operating hours, so there are generators that can be operated for 24 hours non-stop on.
Furthermore, to support the validity of the power generation scheduling results shown in Table 5, Figure 6 presents the convergence graph of the NNOA algorithm. NNOA achieves the best IEED value diminishes significantly in the beginning 10 iterations, from about 14,340.00 to close to 14,190.12. In determining the ON or OFF status of each generating unit, OFF generators is set to have a minimum power, while units with ON status are operated with power output between the minimum and maximum allowed limits. In addition to the stability of the solution value, the NNOA is also analyzed in computation time efficiency per iteration, as shown in Figure 7. Figure 7 depicts the computing time for each iteration. The graph shows the time consumption per iteration of NNOA in seconds for 100 iterations. The initial phase shows high computation time fluctuations, with a peak close to 0.0053 seconds, indicating a larger processing load at the beginning, possibly due to the intensive solution space exploration process. After the 30th iteration, however, the computation time per iteration is seen to decrease and is more consistent, ranging from 0.0025 to 0.0035 seconds. Around the 85th iteration, there is an increase which is likely due to the increasingly complicated individual evaluation process. The relatively small average calculation time per iteration illustrates the time efficiency of NNOA to find convergent solutions quickly and reliably.
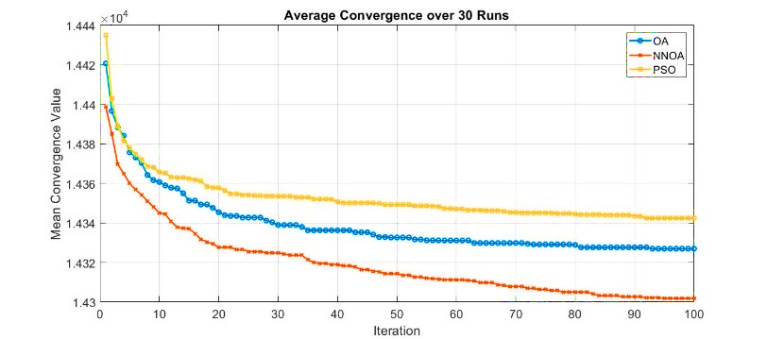
To comprehensively assess the effectiveness of the algorithm, Figure 8 presents a comparison of the convergence rates of NNOA and the benchmark algorithms OA and PSO over 100 iterations. Figure 8 provides a visualization of the difference in results from OA, NNOA, and PSO. The three curves plot the convergence value, the best IEED value of each iteration, at 100 iterations for each algorithm. The PSO algorithm stagnates starting in the 15th iteration at a value of 14,404.89. This graph shows that PSO experiences strong bias exploitation and falls to local optima. In contrast, OA stagnates at the 45th iteration with the IEED value 14,373.33, demonstrating a balance between exploration and exploitation. NNOA was able to reach the optimum value at less than 10 iterations and quickly stagnated at an optimum value that exceeded the optimum value in OA and PSO, which was 14,190.12. The visual study in Figure 8 served to assist us understand why convergence behavior isn't always the same.
Table 5. Power Generation Schedule for Each Unit Over 24 Hours
Hour | Demand | Power Generation (MW) | Operational Cost ($/hr) | Emission Cost(kg/hr) |
1 | 2 | 3 | 4 | 5 | 6 |
1 | 130 | 63.01 | 20.00 | 15.00 | 10.00 | 10.00 | 12.00 | 317.55 | 150.90 |
2 | 140 | 73.01 | 20.00 | 15.00 | 10.00 | 10.00 | 12.00 | 342.65 | 157.03 |
3 | 150 | 83.01 | 20.00 | 15.00 | 10.00 | 10.00 | 12.00 | 368.50 | 165.69 |
4 | 160 | 60.82 | 20.00 | 26.07 | 19.30 | 10.00 | 23.82 | 430.17 | 181.35 |
5 | 180 | 98.33 | 34.68 | 15.00 | 10.00 | 10.00 | 12.00 | 449.29 | 198.43 |
6 | 200 | 133.01 | 20.00 | 15.00 | 10.00 | 10.00 | 12.00 | 509.00 | 246.78 |
7 | 220 | 81.65 | 52.81 | 15.00 | 26.56 | 24.03 | 19.96 | 607.29 | 247.04 |
8 | 250 | 158.02 | 27.73 | 15.00 | 19.19 | 10.00 | 20.07 | 669.08 | 332.31 |
9 | 300 | 156.04 | 58.99 | 21.47 | 19.19 | 21.57 | 22.73 | 840.85 | 397.67 |
10 | 330 | 137.74 | 66.79 | 31.79 | 35.00 | 30.00 | 28.68 | 979.70 | 429.31 |
11 | 360 | 194.38 | 37.96 | 46.63 | 27.68 | 26.46 | 26.90 | 1096.73 | 556.00 |
12 | 400 | 177.60 | 80.00 | 44.72 | 34.93 | 22.73 | 40.00 | 1260.20 | 617.70 |
13 | 420 | 200.00 | 69.34 | 48.98 | 35.00 | 30.00 | 36.68 | 1334.65 | 683.91 |
14 | 410 | 177.12 | 80.00 | 50.00 | 35.00 | 30.00 | 37.87 | 1316.22 | 636.26 |
15 | 390 | 154.99 | 80.00 | 50.00 | 35.00 | 30.00 | 40.00 | 1254.93 | 572.48 |
16 | 370 | 166.07 | 80.00 | 33.79 | 35.00 | 30.00 | 25.14 | 1120.52 | 542.44 |
17 | 340 | 166.47 | 73.89 | 23.68 | 30.74 | 17.31 | 27.90 | 990.96 | 488.39 |
18 | 310 | 174.54 | 40.23 | 27.64 | 26.56 | 26.29 | 14.75 | 875.62 | 435.40 |
19 | 280 | 96.76 | 79.41 | 28.86 | 33.01 | 18.59 | 23.35 | 823.51 | 356.76 |
20 | 250 | 118.21 | 38.93 | 26.65 | 21.62 | 13.42 | 31.18 | 691.41 | 284.89 |
21 | 220 | 127.59 | 20.00 | 25.18 | 11.77 | 10.00 | 25.47 | 587.71 | 260.61 |
22 | 180 | 108.06 | 24.95 | 15.00 | 10.00 | 10.00 | 12.00 | 449.11 | 202.40 |
23 | 150 | 77.37 | 20.00 | 18.00 | 10.00 | 12.64 | 12.00 | 372.43 | 164.86 |
24 | 130 | 53.61 | 29.40 | 15.00 | 10.00 | 10.00 | 12.00 | 319.21 | 155.77 |
Total | 18,007.28 | 8,464.39 |
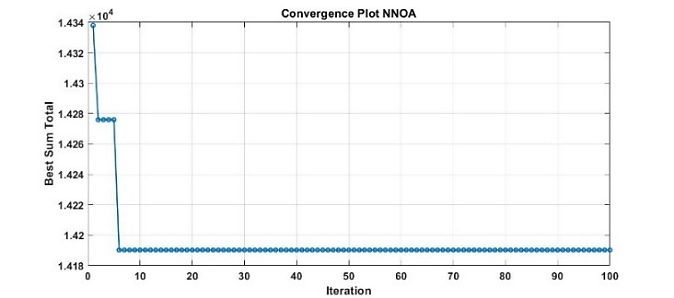
Figure 6. NNOA Convergence Plot
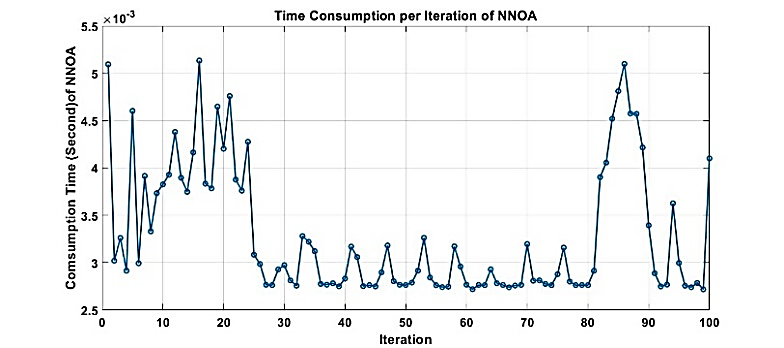
Figure 7. Time consumption of NNOA
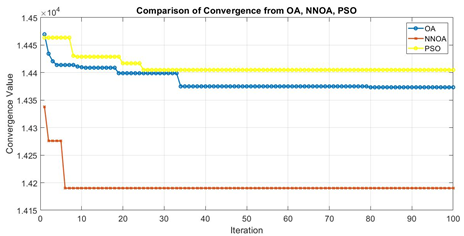
Figure 8. Comparison of OA, NNOA, and PSO convergence plot in 100 iterations
To get a better idea of how well the algorithms compare, a number of important metrics were chosen to be investigated in more detail. The optimum value, mean value, standard deviation, and computation time were chosen as indicators to evaluate the algorithm's performance. In the context of IEED issue solving, the minimum value indicates that the algorithm solutions are of superior quality. Similarly, a lower mean value represents a more thorough examination of a more robust algorithm, and a lower standard deviation indicates greater algorithmic stability. An algorithm that meets all three characteristics is a fantastic choice. However, obtaining such ideal standards is too difficult because each algorithm has different performance priorities [27],[56]. Additionally, to offer a more explicit visual illustration of these performance measures. Figure 9 shows a visual representation of the results for the IEED value optimization metrics from the UC cases solved with OA, NNOA, and PSO. The boxplot complements the visualization of the metrics given in Table 6. Although Table 6 shows that NNOA has the highest numerical standard deviation (22.2062), the boxplot above displays a relatively narrow Inter Quartile Range (IQR) box. This boxplot illustrates that the first and third quartiles of the NNOA optimization results are concentrated near its optimal median. This indicates strong exploitation or intensification capability. It suggests that NNOA is consistently able to focus its solutions around the optimal value. The presence of outliers that lie far from the central values explains the relatively high standard deviation of NNOA. In several executions, NNOA produced results that deviated significantly from the mean.
To assess the validity of the algorithms for solving UC, a test of the converged values from three distinct techniques was performed based on the outcomes of a single run. To ensure the optimization results by the three algorithms, 10 times and 30 runs were conducted, and then the average results were calculated. Figure 10 and Figure 11 show the results of the average convergence value of the OA, NNOA, and PSO algorithms for 100 iterations. From these graphs, it is evident that the NNOA algorithm continues to exhibit superior performance with the lowest average convergence value, followed by OA and PSO. This result reinforces the finding that NNOA is more reliable and consistent in finding optimal solutions than OA and PSO algorithms, even after being tested in a multi-running scenario. As an additional confirmation of the performance differences among NNOA, OA, and PSO, the Wilcoxon rank-sum test was conducted using a significance level of 0.05 [57][58]. Two parameters,  and h, serve as indicators of the test results. Two algorithms are considered significantly different if
  or h = 1 is accepted, and not significantly different if
  or h = 0 is accepted. Table 7 shows the results of The Wilcoxon rank-sum test among OA, NNOA, and PSO based on data obtained from 30 independent runs.
Table 6. Comparative Result of Algorithms
Algorithm | Total Operational Cost ($/hr) | Total Emission (kg/hr) | Best IEED | Mean Best IEED | Standard Deviation | Total Computation Time (second) |
OA | 18,353 | 8,403.80 | 14,373.33 | 14,385.59 | 17.7560 | 0.39822 |
NNOA | 18,007 | 8,464.40 | 14,190.12 | 14,195.03 | 22.2062 | 0.32819 |
PSO | 18,554 | 8,480.60 | 14,404.89 | 14,412.49 | 16.1986 | 0.18602 |
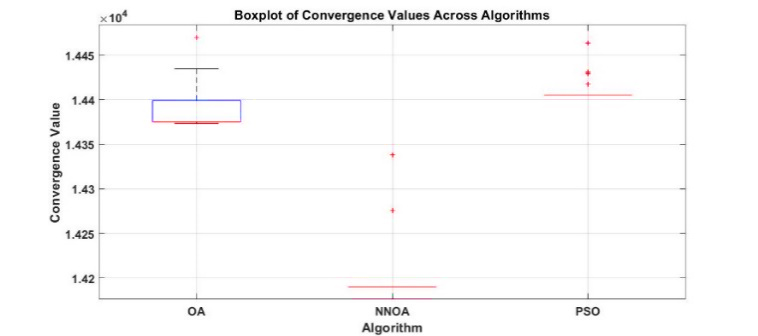
Figure 9. Boxplot of IEED Value Across Algorithms
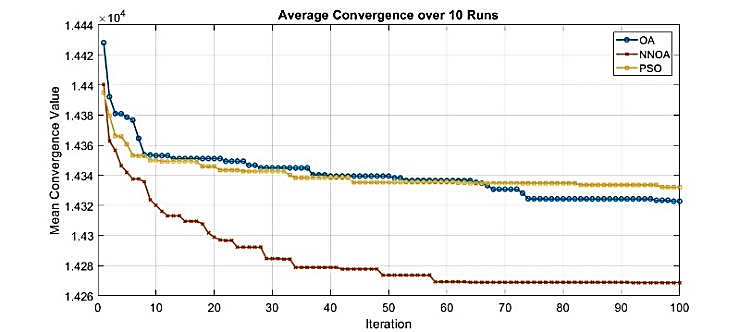
Figure 10. Average Convergence Performance of OA, NNOA, and PSO Algorithms over 10 Independent Runs
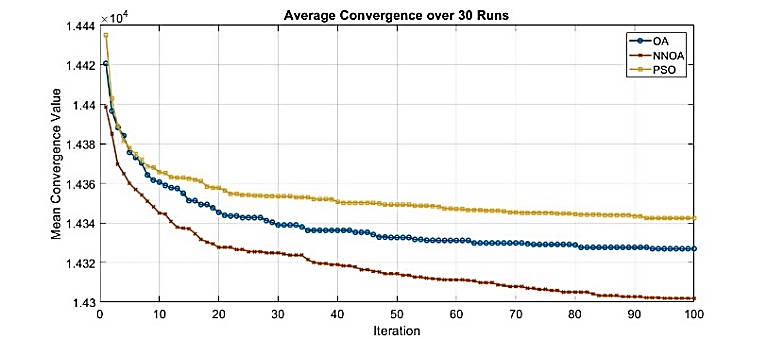
Figure 11. Average Convergence Performance of OA, NNOA, and PSO Algorithms over 30 Independent Runs
Table 7. Outcomes of Wilcoxon’s rank sum test
Algorithm | 
| h | Conclusion |
OA vs NNOA | 0.0053 | 1 | Significantly difference |
OA vs PSO | 0.0015 | 1 | Significantly difference |
NNOA vs PSO | 0.7655 | 0 | Not significantly different |
DISCUSSION
The main advantage of NNOA is that it is able to achieve the most optimal IEED value compared to OA and PSO. A significant reduction in total cost is achieved by the early 10th iteration as shown the Figure 6. This shows the ability of efficient and effective initial exploration in identifying the optimal solution faster than OA and PSO based on the amount of iteration. In addition to solution quality, it is essential to assess the time efficiency of NNOA. The optimal IEED value attained by NNOA is  , while the highest average value recorded is 14,195.03 across 100 iterations. The results presented are markedly lower than those achieved by OA, which yielded a maximum IEED of 14,373.33 and an average of 14,385.59, as well as PSO, which recorded a maximum IEED of 14,404.89, and an average of 14,412.49. This result indicates that NNOA is more effective in identifying optimal solutions that achieve the best balance between fuel costs and emissions. NNOA demonstrated a substantial reduction in the IEED value relative to the OA and PSO algorithms, with an average decrease of 1.33% compared to OA and 1.51% compared to PSO. NNOA also found its convergence point in 10 iterations, while OA took 35 iterations. It means that NNOA successfully accelerated convergence by 71.4% to OA.
However, a drawback of the NNOA is its total computation time of 0.32819 seconds, which is longer than the PSO's time of 0.18602 seconds. This difference occurs because NNOA has a larger computational load than the PSO algorithm. This is especially apparent when comparing the rapidity of PSO, frequently ascribed to its gradient-like updates, with the more profound metaheuristic investigation of NNOA. The relatively straightforward updating rules of PSO provide expedited computation per iteration, resulting in reduced total execution time. Nonetheless, this enhanced solution quality entails specific performance compromises, especially regarding computational speed and solution consistency, which are typical in metaheuristic optimization.
Although NNOA shows superiority in solution quality, there is an observation regarding standard deviation, which is an indicator of performance consistency. Compared to OA (17.7560) and PSO (16.1986), NNOA has the highest standard deviation of 22.2062. In general, a lower standard deviation may indicate that the results obtained are more consistent across executions [55]. In this case, the larger variance in NNOA may indicate that PSO and OA show more consistent performance from one execution to the next. The higher variability in NNOA can be attributed to the more aggressive exploration phase. The velocity update model, which is inspired by the Doppler effect and integrates a non-linear exponential function, could potentially be one of the factors contributing to the more dynamic character of the exploration.
Upon closer examination, the notably low mean IEED score of 14,195.03 is accompanied by a standard deviation of 22.2062, which remains respectable and competitive. The observed fluctuation is insignificant relative to the magnitude of the mean value itself. Thus, NNOA's greater standard deviation seems justified, considering its enhanced capacity to attain a higher overall IEED solution quality.
The architectural design of NNOA plays a crucial role in achieving these improved outcomes. The integration of the Doppler Effect mechanism is responsible for NNOA's better performance. This feature allows search agents to dynamically detect the distance and movement of optimal regions in the solution space. As a result, NNOA improves its exploration capability, allowing it to avoid local optimums and retain solution variety throughout the optimization process. These enhancements are very useful in addressing difficult problems such as IEED, which have several constraints and nonlinear features.
The Wilcoxon rank-sum test outcomes indicate that OA and NNOA produce a value of 0.0053. This value is less than 0.05 as a significance threshold. This finding indicates that there is a significant difference between the performance of OA and NNOA, the modification algorithm. Practically, the evidence supports that modifying the behavior of orcas through the Doppler navigation system in NNOA results in better IEED performance than conventional OA. In contrast, the test result between NNOA and PSO shows a -value of 0.7655, which is greater than 0.05, so there is no statistically significant difference between the two. The result indicates that although NNOA has an advantage in terms of less IEED value than PSO, the overall performance of PSO and NNOA is still in a tie, especially in the case of small-medium-scale UC
The proposed NNOA was evaluated against established and often utilized metaheuristic optimization techniques, including PSO. In a study conducted by Alsowaidi et al. [9], PSO successfully optimized the scheduling of 10 generating units, considering variations in spinning reserves. Conversely, NNOA was executed inside a standardized framework, specifically including six generator units in the IEEE 30-bus system, with the dual aims of optimizing economic efficiency of generator units and reducing gas emissions. The fundamental difference between these two techniques resides in their optimization goals and intricacy. Alsowaidi's research on PSO highlights economic efficiency through the application of spinning reserve limitations, although it overlooks environmental factors. NNOA tackles a multi-objective challenge by simultaneously reducing operational costs and exhaust pollutants. NNOA provides advantages in solution quality; yet, it is hindered by a comparatively extended computation time comparing to PSO. This results from the heightened complexity in the computations and Doppler effect-based calculations within NNOA. Therefore, subsequent development must concentrate on optimizing the algorithmic framework to proficiently tackle multi-objective challenges with improved computing efficiency.
Generally, no singular algorithm can simultaneously attain optimal convergence and time efficiency across all optimization contexts. This is due to the natural exploration and exploitation process to obtain the global optimal solution [59][60]. Guven et al. (2024) [61] also demonstrated that no single technique is unequivocally superior in all dimensions, instead, each possesses a relative advantage contingent upon the prioritized optimization aim. This confirms the findings of the study, indicating that NNOA excels in cost efficiency, OA maintains a balance between low emissions and stability, whilst PSO offers benefits in speed and result consistency. Consequently, algorithm selection must be customized according to the prioritization of optimization targets.
- CONCLUSIONS
This research contributes to modify OA so that it more accurately represents the navigation behavior of orca whales, which is expected to improve the IEED value in the UC problem, called NNOA. The result shows that the NNOA method has significant advantages in solving the UC problem with the IEED objective function. Adapting OA by incorporating the concept of orca navigation behavior while hunting prey through the Doppler effect, NNOA shows convergence around 10 initial iterations with the least IEED value. This shows the orca's competitive initial exploration capacity compared to other algorithms (OA and PSO) and strong exploitation stage. NNOA achieved the ideal IEED value of 14,190.12, surpassing OA (14,373.33) and PSO (14,404.89), meaning that NNOA managed to reduce the IEED value by 1.33% relative to OA and 1.51% compared to PSO. NNOA demonstrated remarkable consistency, achieving optimal IEED values at both 10 and 30 trials. NNOA contributes to grid sustainability by minimizing IEED values, which reduce operational costs and harmful emissions and so support decarbonization efforts. This position is becoming increasingly important as power systems include more renewable energy sources, and intelligent scheduling algorithms such as NNOA help preserve grid dependability while permitting carbon reduction targets. However, NNOA continues to encounter numerous issues that require resolution. This study identified limitations due to NNOA's prolonged computation time and greater standard deviation compared to OA and PSO. This could be because the Doppler effect calculation metaphor formula is complex and uses a non-linear formula in the form of an exponential function, which makes the calculations harder. Nevertheless, while exhibiting a greater standard deviation than OA and PSO, it stays competitive due to the most favorable IEED results. Given the benefits of PSO in computational efficiency and the least standard deviation of OA and NNOA, it is recommended to integrate NNOA with PSO in the future to develop a hybrid algorithm that optimizes solution quality, convergence rate, and standard deviation reduction. Based on the findings in this study, future research is recommended to test NNOA on larger datasets, such as IEEE 118-bus systems or actual power systems such as multi-area grids. Testing on systems integrated with renewable energy sources such as wind and solar is also quite interesting to further identify the benefits of NNOA. Considering that the hourly power demand is still static, it is also worth testing NNOA on dynamic power demand cases with various generation limitation scenarios to assess the robustness of the algorithm. NNOA facilitates the shift to a fuel-efficient electricity system.
DECLARATION
Author Contribution
All authors contributed equally to the main contributor to this paper. All authors read and approved the final paper.
Funding
This project did not obtain any financial assistance from external funding entities or sponsors.
Acknowledgement
Write a thank you to those who have helped in this research who are not listed in the author's list.
Conflicts of Interest
The authors declare no conflict of interest.
REFERENCES
- W. Strielkowski, L. Civín, E. Tarkhanova, M. Tvaronavičienė, and Y. Petrenko, “Renewable Energy in the Sustainable Development of Electrical Power Sector: A Review,” Energies, vol. 14, no. 24, p. 8240, 2021, https://doi.org/10.3390/en14248240.
- F. Al Mubarak, R. Rezaee, and D. A. Wood, “Economic, Societal, and Environmental Impacts of Available Energy Sources: A Review,” Eng, vol. 5, no. 3, pp. 1232–1265, 2024, https://doi.org/10.3390/eng5030067.
- M. Mudakir, A. Aripriharta, and A. P. Wibawa, “Analysis of battery energy storage system (BESS) performance in reducing the impact of variable renewable energy generation intermittency on the electricity system,” J. Mechatronics, Electr. Power, Veh. Technol., vol. 15, no. 2, pp. 158–176, 2024, https://doi.org/10.55981/j.mev.2024.1032.
- S. Khan, M. Murshed, I. Ozturk, and K. Khudoykulov, “The roles of energy efficiency improvement, renewable electricity production, and financial inclusion in stimulating environmental sustainability in the Next Eleven countries,” Renew. Energy, vol. 193, pp. 1164–1176, 2022, https://doi.org/10.1016/j.renene.2022.05.065.
- C. O’Malley, P. de Mars, L. Badesa, and G. Strbac, “Reinforcement learning and mixed-integer programming for power plant scheduling in low carbon systems: Comparison and hybridisation,” Appl. Energy, vol. 349, p. 121659, 2023, https://doi.org/10.1016/j.apenergy.2023.121659.
- F. Shaheen et al., “Cleaner Technology and Natural Resource Management: An Environmental Sustainability Perspective from China,” Clean Technol., vol. 4, no. 3, pp. 584–606, 2022, https://doi.org/10.3390/cleantechnol4030036.
- N. Yan, G. Ma, X. Li, and J. M. Guerrero, “Low-Carbon Economic Dispatch Method for Integrated Energy System Considering Seasonal Carbon Flow Dynamic Balance,” IEEE Trans. Sustain. Energy, vol. 14, no. 1, pp. 576–586, 2023, https://doi.org/10.1109/TSTE.2022.3220797.
- S. Padhi, B. P. Panigrahi, and D. Dash, “Solving Dynamic Economic Emission Dispatch Problem with Uncertainty of Wind and Load Using Whale Optimization Algorithm,” J. Inst. Eng. Ser. B, vol. 101, no. 1, pp. 65–78, 2020, https://doi.org/10.1007/s40031-020-00435-y.
- A. S. Alsowaidi and S. M. Modaresi, “Solving the Unit Commitment Problem of 10-Generators Set by PSO with Different Spinning-Reserve Values Obtained From Hour-Hour Load Demand Increasing,” ITEGAM- J. Eng. Technol. Ind. Appl. (ITEGAM-JETIA), vol. 10, no. 49, 2024, https://doi.org/10.5935/jetia.v10i49.1260.
- C. Venkatesh Kumar and M. Ramesh Babu, “An Exhaustive Solution of Power System Unit Commitment Problem Using Enhanced Binary Salp Swarm Optimization Algorithm,” J. Electr. Eng. Technol., vol. 17, no. 1, pp. 395–413, 2022, https://doi.org/10.1007/s42835-021-00889-0.
- R. H. Wuijts, M. van den Akker, and M. van den Broek, “Effect of modelling choices in the unit commitment problem,” Energy Syst., vol. 15, no. 1, pp. 1–63, 2024, https://doi.org/10.1007/s12667-023-00564-5.
- R. Ragunathan and B. Ramadoss, “An improved golden jackal optimization algorithm for combined economic emission dispatch problems,” Int. J. Adv. Appl. Sci., vol. 13, no. 2, p. 249, 2024, https://doi.org/10.11591/ijaas.v13.i2.pp249-259.
- A. Akbari-Dibavar, B. Mohammadi-Ivatloo, K. Zare, T. Khalili, and A. Bidram, “Economic-Emission Dispatch Problem in Power Systems With Carbon Capture Power Plants,” IEEE Trans. Ind. Appl., vol. 57, no. 4, pp. 3341–3351, 2021, https://doi.org/10.1109/TIA.2021.3079329.
- N. Yang et al., “A Comprehensive Review of Security-constrained Unit Commitment,” J. Mod. Power Syst. Clean Energy, vol. 10, no. 3, pp. 562–576, 2022, https://doi.org/10.35833/MPCE.2021.000255.
- A. O. Olasoji, D. T. O. Oyedokun, S. O. Omogoye, and C. Thron, “Review of frequency response strategies in renewable-dominated power system grids: Market adaptations and unit commitment formulation,” Sci. African, vol. 26, p. e02357, 2024, https://doi.org/10.1016/j.sciaf.2024.e02357.
- A. Aharwar, R. Naresh, V. Sharma, and V. Kumar, “Unit commitment problem for transmission system, models and approaches: A review,” Electr. Power Syst. Res., vol. 223, p. 109671, 2023, https://doi.org/10.1016/j.epsr.2023.109671.
- V. Kumar, R. Naresh, and A. Singh, “Investigation of solution techniques of unit commitment problems: A review,” Wind Eng., vol. 45, no. 6, pp. 1689–1713, 2021, https://doi.org/10.1177/0309524X21992446.
- N. Muralikrishnan, L. Jebaraj, and C. C. A. Rajan, “A Comprehensive Review on Evolutionary Optimization Techniques Applied for Unit Commitment Problem,” IEEE Access, vol. 8, pp. 132980–133014, 2020, https://doi.org/10.1109/ACCESS.2020.3010275.
- S. Syama, J. Ramprabhakar, R. Anand, and J. M. Guerrero, “An integrated binary metaheuristic approach in dynamic unit commitment and economic emission dispatch for hybrid energy systems,” Sci. Rep., vol. 14, no. 1, p. 23964, 2024, https://doi.org/10.1038/s41598-024-75743-0.
- A. Aripriharta et al., “Analysis of System Operation Optimization In Steam Power Plants with the Lagrange Method,” J. Ecotipe (Electronic, Control. Telecommun. Information, Power Eng.), vol. 11, no. 1, pp. 29–37, 2024, https://doi.org/10.33019/jurnalecotipe.v11i1.4479.
- K. Rajwar, K. Deep, and S. Das, “An exhaustive review of the metaheuristic algorithms for search and optimization: taxonomy, applications, and open challenges,” Artif. Intell. Rev., vol. 56, no. 11, pp. 13187–13257, 2023, https://doi.org/10.1007/s10462-023-10470-y.
- L. Widayanti, A. N. Afandi, H. W. Herwanto, and V. A. Fitria, “Metaheuristic Optimization in Dynamic Unit Commitment of Power Systems: Current Trends and Future Prospects,” JOIV Int. J. Informatics Vis., vol. 8, no. 4, p. 2261, 2024, https://doi.org/10.62527/joiv.8.4.2423.
- R. Vatambeti and P. K. Dhal, “Synergistic Optimization of Unit Commitment Using PSO and Random Search,” Contemp. Math., pp. 698-710, 2024, https://doi.org/10.37256/cm.5120243638.
- Y. Xue, H. Zhu, J. Liang, and A. Słowik, “Adaptive crossover operator based multi-objective binary genetic algorithm for feature selection in classification,” Knowledge-Based Syst., vol. 227, p. 107218, 2021, https://doi.org/10.1016/j.knosys.2021.107218.
- S. A. Mohamed, N. Anwer, and M. M. Mahmoud, “Solving optimal power flow problem for IEEE-30 bus system using a developed particle swarm optimization method: towards fuel cost minimization,” Int. J. Model. Simul., vol. 45, no. 1, pp. 307–320, 2025, https://doi.org/10.1080/02286203.2023.2201043.
- Y. Liu et al., “Simulated annealing-based dynamic step shuffled frog leaping algorithm: Optimal performance design and feature selection,” Neurocomputing, vol. 503, pp. 325–362, 2022, https://doi.org/10.1016/j.neucom.2022.06.075.
- Y. Zhang, Z. Jin, and Y. Chen, “Hybrid teaching–learning-based optimization and neural network algorithm for engineering design optimization problems,” Knowledge-Based Syst., vol. 187, p. 104836, 2020, https://doi.org/10.1016/j.knosys.2019.07.007.
- M. Abdel-Basset, R. Mohamed, and M. Elhoseny, “Metaheuristic algorithms and medical applications,” in Metaheuristics Algorithms for Medical Applications, pp. 1–26, 2024, https://doi.org/10.1016/B978-0-443-13314-5.00013-8.
- E. H. Houssein, M. K. Saeed, G. Hu, and M. M. Al-Sayed, “Metaheuristics for Solving Global and Engineering Optimization Problems: Review, Applications, Open Issues and Challenges,” Arch. Comput. Methods Eng., vol. 31, no. 8, pp. 4485–4519, 2024, https://doi.org/10.1007/s11831-024-10168-6.
- B. Benaissa, M. Kobayashi, M. Al Ali, T. Khatir, and M. El Amine Elaissaoui Elmeliani, “Metaheuristic optimization algorithms: An overview,” HCMCOU J. Sci. – Adv. Comput. Struct., pp. 33–61, 2024, https://doi.org/10.46223/HCMCOUJS.acs.en.14.1.47.2024.
- Y. Bouteraa and M. Khishe, “Fractal and chaotic map-enhanced grey wolf optimization for robust fire detection in deep convolutional neural networks,” Sci. Rep., vol. 15, no. 1, p. 11495, 2025, https://doi.org/10.1038/s41598-025-95519-4.
- H. J. Apon, A. Ahmed, A. U. R. Adib, and R. Ahshan, “Integrated planning of emission reduction based unit commitment and generation dispatch solution for sustainable power system,” Electr. Power Syst. Res., vol. 244, p. 111535, 2025, https://doi.org/10.1016/j.epsr.2025.111535.
- A. N. Afandi et al., “Trip Pattern Impact of Electric Vehicles in Optimized Power Production using Orca Algorithm,” J. Eng. Technol. Sci., vol. 56, no. 04, pp. 463–473, 2024, https://doi.org/10.5614/j.eng.technol.sci.2024.56.4.3.
- B. M. Wright, V. B. Deecke, G. M. Ellis, A. W. Trites, and J. K. B. Ford, “Behavioral context of echolocation and prey‐handling sounds produced by killer whales (Orcinus orca) during pursuit and capture of Pacific salmon (Oncorhynchus spp.),” Mar. Mammal Sci., vol. 37, no. 4, pp. 1428–1453, 2021, https://doi.org/10.1111/mms.12836.
- A. A. Leu, J. A. Hildebrand, A. Rice, S. Baumann-Pickering, and K. E. Frasier, “Echolocation click discrimination for three killer whale ecotypes in the Northeastern Pacific,” J. Acoust. Soc. Am., vol. 151, no. 5, pp. 3197–3206, 2022, https://doi.org/10.1121/10.0010450.
- A. Kaveh, S. M. Hosseini, and A. Zaerreza, “A Physics-based Metaheuristic Algorithm Based on Doppler Effect Phenomenon and Mean Euclidian Distance Threshold,” Period. Polytech. Civ. Eng., vol. 66, no. 3, pp. 820-842, 2022, https://doi.org/10.3311/PPci.20133.
- R. P. Badoni et al., “An Exploration and Exploitation-Based Metaheuristic Approach for University Course Timetabling Problems,” Axioms, vol. 12, no. 8, p. 720, 2023, https://doi.org/10.3390/axioms12080720.
- H. Shokouhandeh, M. Ahmadi Kamarposhti, I. Colak, and K. Eguchi, “Unit Commitment for Power Generation Systems Based on Prices in Smart Grid Environment Considering Uncertainty,” Sustainability, vol. 13, no. 18, p. 10219, 2021, https://doi.org/10.3390/su131810219.
- M. U. Bashir, W. U. H. Paul, M. Ahmad, D. Ali, and M. S. Ali, “An Efficient Hybrid TLBO-PSO Approach for Congestion Management Employing Real Power Generation Rescheduling,” Smart Grid Renew. Energy, vol. 12, no. 08, pp. 113–135, 2021, https://doi.org/10.4236/sgre.2021.128008.
- D. Salman and M. Kusaf, “Short-Term Unit Commitment by Using Machine Learning to Cover the Uncertainty of Wind Power Forecasting,” Sustainability, vol. 13, no. 24, p. 13609, 2021, https://doi.org/10.3390/su132413609.
- M. Elkamel, A. Ahmadian, A. Diabat, and Q. P. Zheng, “Stochastic optimization for price-based unit commitment in renewable energy-based personal rapid transit systems in sustainable smart cities,” Sustain. Cities Soc., vol. 65, p. 102618, 2021, https://doi.org/10.1016/j.scs.2020.102618.
- V. A. Fitria, A. N. Afandi, and Aripriharta, “Exploring the Orca Predation Algorithm for Economic Dispatch Optimization in Power Systems,” BenchCouncil Trans. Benchmarks, Stand. Eval., vol. 4, no. 3, p. 100187, 2024, https://doi.org/10.1016/j.tbench.2024.100187.
- S. Mishra, A. G. Shaik, and O. P. Mahela, “Swarm Intelligent Search and Rescue method for economic emission load dispatch of renewable integrated power system considering uncertainty,” Swarm Evol. Comput., vol. 95, p. 101928, 2025, https://doi.org/10.1016/j.swevo.2025.101928.
- B. Postolov and A. Iliev, “New metaheuristic methodology for solving security constrained hydrothermal unit commitment based on adaptive genetic algorithm,” Int. J. Electr. Power Energy Syst., vol. 134, p. 107163, 2022, https://doi.org/10.1016/j.ijepes.2021.107163.
- F. W. Shabangu, R. Daniels, R. K. Jordaan, P. J. N. de Bruyn, M. A. van den Berg, and T. Lamont, “Killer whale acoustic patterns respond to prey abundance and environmental variability around the Prince Edward Islands, Southern Ocean,” R. Soc. Open Sci., vol. 11, no. 1, 2024, https://doi.org/10.1098/rsos.230903.
- G. Richard et al., “Passive acoustic monitoring reveals feeding attempts at close range from soaking demersal longlines by two killer whale ecotypes,” Mar. Mammal Sci., vol. 38, no. 1, pp. 304–325, 2022, https://doi.org/10.1111/mms.12860.
- [47] H. Drias, L. S. Bendimerad, and Y. Drias, “A Three-Phase Artificial Orcas Algorithm for Continuous and Discrete Problems,” Int. J. Appl. Metaheuristic Comput., vol. 13, no. 1, pp. 1–20, 2022, https://doi.org/10.4018/IJAMC.304073.
- A. Kaveh and S. M. Hosseini, “Improved Bat Algorithm Based on Doppler Effect for Optimal Design of Special Truss Structures,” J. Comput. Civ. Eng., vol. 36, no. 6, 2022, https://doi.org/10.1061/(ASCE)CP.1943-5487.0001042.
- S. Kigsirisin and H. Miyauchi, “Short-Term Operational Scheduling of Unit Commitment Using Binary Alternative Moth-Flame Optimization,” IEEE Access, vol. 9, pp. 12267–12281, 2021, https://doi.org/10.1109/ACCESS.2021.3051175.
- M. K. Elshaarawy, “Metaheuristic-driven CatBoost model for accurate seepage loss prediction in lined canals,” Multiscale Multidiscip. Model. Exp. Des., vol. 8, no. 5, p. 235, 2025, https://doi.org/10.1007/s41939-025-00800-8.
- M. R. A. Putra et al., “Robust SVM optimization using PSO and ACO for accurate lithium-ion battery health monitoring,” Mech. Eng. Soc. Ind., vol. 5, no. 1, pp. 71–80, 2025, https://doi.org/10.31603/mesi.12280.
- S. K. Joshi and J. C. Bansal, “Parameter tuning for meta-heuristics,” Knowledge-Based Syst., vol. 189, p. 105094, 2020, https://doi.org/10.1016/j.knosys.2019.105094.
- A. I. Vlad, A. A. Romanyukha, and T. E. Sannikova, “Parameter Tuning of Agent-Based Models: Metaheuristic Algorithms,” Mathematics, vol. 12, no. 14, p. 2208, 2024, https://doi.org/0.3390/math12142208.
- M. Jain, V. Saihjpal, N. Singh, and S. B. Singh, “An Overview of Variants and Advancements of PSO Algorithm,” Appl. Sci., vol. 12, no. 17, p. 8392, 2022, https://doi.org/10.3390/app12178392.
- J. Wang, X. Wang, X. Li, and J. Yi, “A Hybrid Particle Swarm Optimization Algorithm with Dynamic Adjustment of Inertia Weight Based on a New Feature Selection Method to Optimize SVM Parameters,” Entropy, vol. 25, no. 3, p. 531, 2023, https://doi.org/10.3390/e25030531.
- Y. Jiang, Q. Wu, S. Zhu, and L. Zhang, “Orca predation algorithm: A novel bio-inspired algorithm for global optimization problems,” Expert Syst. Appl., vol. 188, p. 116026, 2022, https://doi.org/10.1016/j.eswa.2021.116026.
- T. Li, A. Rezaeipanah, and E. M. Tag El Din, “An ensemble agglomerative hierarchical clustering algorithm based on clusters clustering technique and the novel similarity measurement,” J. King Saud Univ. - Comput. Inf. Sci., vol. 34, no. 6, pp. 3828–3842, 2022, https://doi.org/10.1016/j.jksuci.2022.04.010.
- Y. Jiang, Q. Wu, S. Zhu, and L. Zhang, “Orca predation algorithm: A novel bio-inspired algorithm for global optimization problems,” Expert Syst. Appl., vol. 188, no. October 2021, 2022, https://doi.org/10.1016/j.eswa.2021.116026.
- D. H. Salunkhe, G. Michel, S. Kumar, M. Sanguineti, and D. Chablat, “An efficient combined local and global search strategy for optimization of parallel kinematic mechanisms with joint limits and collision constraints,” Mech. Mach. Theory, vol. 173, p. 104796, 2022, https://doi.org/10.1016/j.mechmachtheory.2022.104796.
- L. Yiyang, J. Xi, B. Hongfei, W. Zhining, and S. Liangliang, “A General Robot Inverse Kinematics Solution Method Based on Improved PSO Algorithm,” IEEE Access, vol. 9, pp. 32341–32350, 2021, https://doi.org/10.1109/ACCESS.2021.3059714.
- A. F. Güven, N. Yörükeren, and O. Ö. Mengi, “Multi-objective optimizatio n and sustainable design: a performance comparison of metaheuristic algorithms used for on-grid and off-grid hybrid energy systems,” Neural Comput. Appl., vol. 36, no. 13, pp. 7559–7594, 2024, https://doi.org/10.1007/s00521-024-09585-2.
AUTHOR BIOGRAPHY

| Lilis Widayanti is a lecturer in the Computer Systems Study Program at Institut Teknologi dan Bisnis Asia Malang (ITB Asia), Indonesia. She has held the position of lecturer at Institut Teknologi dan Bisnis Asia, Indonesia, since 2015. Currently, her Doctorate (S3) in Electrical Engineering and Informatics is being pursued at Universitas Negeri Malang, Indonesia. She can be contacted at the email address lilis.widayanti.2205349@students.um.ac.id. |
|
|

| Arif Nur Afandi is a Professor at Universitas Negeri Malang, Indonesia, and is presently the Vice Rector IV of the University. He earned his bachelor's degree from Universitas Brawijaya, Indonesia, his master's degree from Universitas Gajah Mada, Indonesia, and his Ph.D. from Kumamoto University, Japan. He has made substantial contributions to electrical engineering research and publications, and is an active member of IEEE organizations. His areas of expertise include renewable energy and power systems. He can be contacted at the email address an.afandi@um.ac.id. |
|
|

| Heru Wahyu Herwanto is a lecturer at the State University of Malang specializing in education, informatics, image processing, and artificial intelligence. He obtained his undergraduate degree from Universitas Negeri Malang, Indonesia, followed by a master's degree in Computer Science from Universitas Brawijaya, Indonesia, and a PhD degree in Computer Science from Universitas Negeri Malang, Indonesia. He engages in research and scholarly publishing, focusing on the advancement of educational technology and the use of artificial intelligence across diverse domains. He can be contacted at the email address heru_wh@um.ac.id. |
Lilis Widayanti (Modified Orca Algorithm Based on the Navigation Behavior for Optimal Unit Commitment in Power Systems)