ISSN: 2685-9572 Buletin Ilmiah Sarjana Teknik Elektro
Vol. 7, No. 3, September 2025, pp. 641-656
Design and Application of a Cyber Physical Based Data Logger System for Charging Stations
Faisal Rahutomo 1, Bagus Putra Nugraha 1, Atinkut Molla Mekonnen 2, Bashiru Olalekan Ariyo 3
1 Department of Electrical Engineering, Faculty of Engineering, Sebelas Maret University, Surakarta, Indonesia
2 Department of Information Technology, College of Engineering and Technology, Injibara University, Ethiopia
3 Department of Electrical & Electronics Engineering, University of Ilorin, Nigeria
ARTICLE INFORMATION |
| ABSTRACT |
Article History: Received 15 May 2025 Revised 07 August 2025 Accepted 13 October 2025 |
| 
The rapid growth of technology, especially in the transportation sector, has drawn increasing public attention to electric vehicles (EVs). Government policies, such as Presidential Regulation No. 55 of 2019, have further encouraged this shift. As more EVs take to the roads, the need for reliable and accessible charging infrastructure becomes more pressing. This study focuses on the design, development, and implementation of a charging system that not only records EV power usage but also displays real-time data on an LCD screen and allows remote monitoring through a web interface. Such a recording system is crucial for tracking actual energy consumption, including billing purposes. Using a research and development (R&D) approach, the system combines a PZEM-004T sensor with an ESP32 microcontroller to gather and transmit data to a central database. Validation tests showed strong performance, with current measurements reaching 98.79% accuracy and 99.24% precision, and voltage measurements achieving 99.59% accuracy and 99.87% precision. The system was installed in the basement of the UPT TIK building at Sebelas Maret University (UNS) and tested on three electric vehicles with different energy consumption patterns. The average energy growth recorded every ten minutes was 0.063 kWh, 0.164 kWh, and 0.139 kWh for the first, second, and third vehicles, respectively. These findings demonstrate the system’s reliability and accuracy in monitoring EV charging. Since no comparable system has yet been widely adopted in Indonesia, this work could provide valuable groundwork and potentially inspire large-scale implementation. |
Keywords: Charging Station; IoT-based Data Logger; Electrical Energy; Electric Vehicles; Remote Monitoring |
Corresponding Author: Faisal Rahutomo, Department of Electrical Engineering, Sebelas Maret University, Surakarta, Indonesia. Email: faisal_r@staff.uns.ac.id |
This work is open access under a Creative Commons Attribution-Share Alike 4.0 
|
Document Citation: F. Rahutomo, B. P. Nugraha, A. M. Mekonnen, and B. O. Ariyo “Design and Application of a Cyber Physical Based Data Logger System for Charging Stations,” Buletin Ilmiah Sarjana Teknik Elektro, vol. 7, no. 3, pp. 641-656, 2025, DOI: 10.12928/biste.v7i3.13266. |
- INTRODUCTION
The advancement of technology has introduced various alternatives to traditional vehicles powered by different energy sources. The depletion of fossil fuel reserves, coupled with rising international prices, has prompted countries to explore and adopt alternative energy sources for vehicle fuel [1]. One increasingly popular energy source is electricity [2]. The development of electric motor technology, which is now widely used across various sectors, has been enhanced by improvements in energy storage technology [3]. As a result, electric vehicles (EVs) are utilized not only in mass transportation, such as electric trains [4], but also for personal use, including electric bicycles [5], electric motorcycles [6], and electric cars [7]. Advanced battery technology has emerged as a viable solution, enabling electric vehicles to travel tens to hundreds of kilometers on a single charge [8].
Since 2019, the Indonesian government has encouraged the adoption of electric vehicles through the issuance of Presidential Regulation No. 55 regarding the Acceleration of the Battery-Based Electric Motor Vehicle Program for Road Transportation. This regulation has been supported by additional regulations. Ministry of Energy and Mineral Resources No. 13 in 2020, which addresses the provision of electric charging infrastructure for battery-based electric motor vehicles. Ministry of Transportation No. 15 in 2022, which focuses on converting motor vehicles with combustion engines into battery-based electric motor vehicles. Ministry of Transportation No. 65 in 2020, which pertains to converting motorcycles with combustion engines into battery-based electric motorcycles. Ministry of Home Affairs No. 8 in 2020, which outlines the calculation of basic tax imposition for motor vehicles and motor vehicle transfer fees. Ministry of Industry No. 6 in 2022, which discusses specifications, a development roadmap, and provisions for calculating domestic component level values for battery-based electric motor vehicles. All of these regulations aim to promote the adoption of electric vehicle technology [9]-[12].
One of the challenges facing the electric vehicle system is the recharging of batteries. In addition to the time it takes to recharge, the availability of charging stations is quite limited [13]-[15]. Current regulations specify that the primary infrastructure for charging should be public electric vehicle charging stations and battery exchange stations. As the number of electric vehicles rises, the demand for more charging stations will also increase. Workplaces need to have charging points available for employees' vehicles while they are parked for extended periods. Similarly, schools should provide charging points in their parking lots. This necessity extends to shops, government offices, entertainment venues, and other public spaces [16].
However, a significant obstacle arises from the Law number 30 of 2009 concerning electricity, which permit only the State Electricity Company (PLN) to sell electricity to the public. Reselling PLN electricity on a retail basis is prohibited by law. Consequently, businesses and institutions that wish to offer charging stations struggle to pass on the costs of their PLN bills to electric vehicle users. Many shops, offices, and entertainment venues are hesitant to install charging points because the substantial electricity consumption by electric vehicles cannot be charged directly to users. The only viable option currently is to install separate PLN meters for each electric vehicle user, but there is no mutually beneficial solution available at this time. Vehicle owners might consider alternatives like spare or dual batteries, but these options are prohibitively expensive. Another potential solution is a battery exchange system; however, the reliability of exchanging one's battery for another of unknown age and quality remains uncertain.
This research addresses the real challenges associated with implementing cyber-physical systems. These systems have been developed and utilized across various fields, including smart cities [17], smart agriculture [18], smart homes and buildings [19], and smart water management [20]. Additionally, this platform has been researched and applied to create smart grids [21], interconnected vehicles [22], and smart factories [23]. Its implementation occurs at both a living laboratory scale [24] and during large-scale events [25], while also supporting sustainable development goals [26].
The approach taken in this study is similar to those of other research efforts but has its own unique characteristics. Like the proposal outlined in this paper, the following studies address the limitations of charging points for electric vehicles. Paper [27] discusses a large infrastructure that uses cloud technology and real-time data to allocate charging points to electric vehicles. Study [28] explores a charging allocation system designed for booking. Study [29] focuses on providing information about battery capacity in relation to the nearest charging points. Study [30] analyzes the solar photovoltaic (PV) requirements for fast charging stations. Paper [31] takes a broader view, addressing the green transportation framework through the implementation of the Internet of Things (IoT) and cloud computing. Each of these studies contributes to understanding the challenges and solutions related to electric vehicle charging infrastructure. While each of these studies contributes valuable insights into the challenges and potential solutions for electric vehicle charging infrastructure, they do not explicitly consider the regulatory framework and contextual conditions specific to Indonesia.
The research contribution is to address the specific issues in Indonesia. This research proposes a collaborative solution, in line with the noble culture of Indonesia, mutual cooperation (gotong royong). A system was developed for recording the usage of charging stations at a particular location. Registered users would agree to an integrity pact to collaborate. Only registered users would be able to use a charging station. The energy usage for battery charging would be recorded in an information system supported by cyber physical system devices [32]-[34]. This usage at a location would be matched with the applicable electricity tariffs. Thus, users of the charging station services could share the burden of the monthly bill according to their usage rates, in collaboration with PLN customers.
- METHODS
When conducting research, it is crucial to use appropriate methods to guide the study's development. The following section outlines the research methods employed in this study [35][36]. This research introduces an innovative data logger system designed to monitor power usage and costs at electric vehicle charging stations. The system aims to help users easily track and manage their electricity consumption expenses from PLN. Figure 1 provides a general overview of this research flow. The research flow begins with the initiation of the study, followed by a thorough literature review to build a solid theoretical foundation and examine prior developments in electric vehicle charging systems and data logging technologies. The next stage is problem identification, where existing challenges in charging infrastructure, monitoring, and billing are analyzed. Furthermore, the process moves to system planning, which outlines the overall concept and design of the proposed solution. From there, hardware planning involves selecting and configuring components such as sensors, microcontrollers, and communication modules. Software planning focuses on developing the supporting architecture, including firmware, data processing, and web-based interfaces. After hardware and software are prepared, testing and data collection are carried out to validate the system’s accuracy and logging capabilities. The evaluation phase then assesses overall performance and highlights areas for refinement. Finally, the research concludes with the completion step, marking the end of the development process.
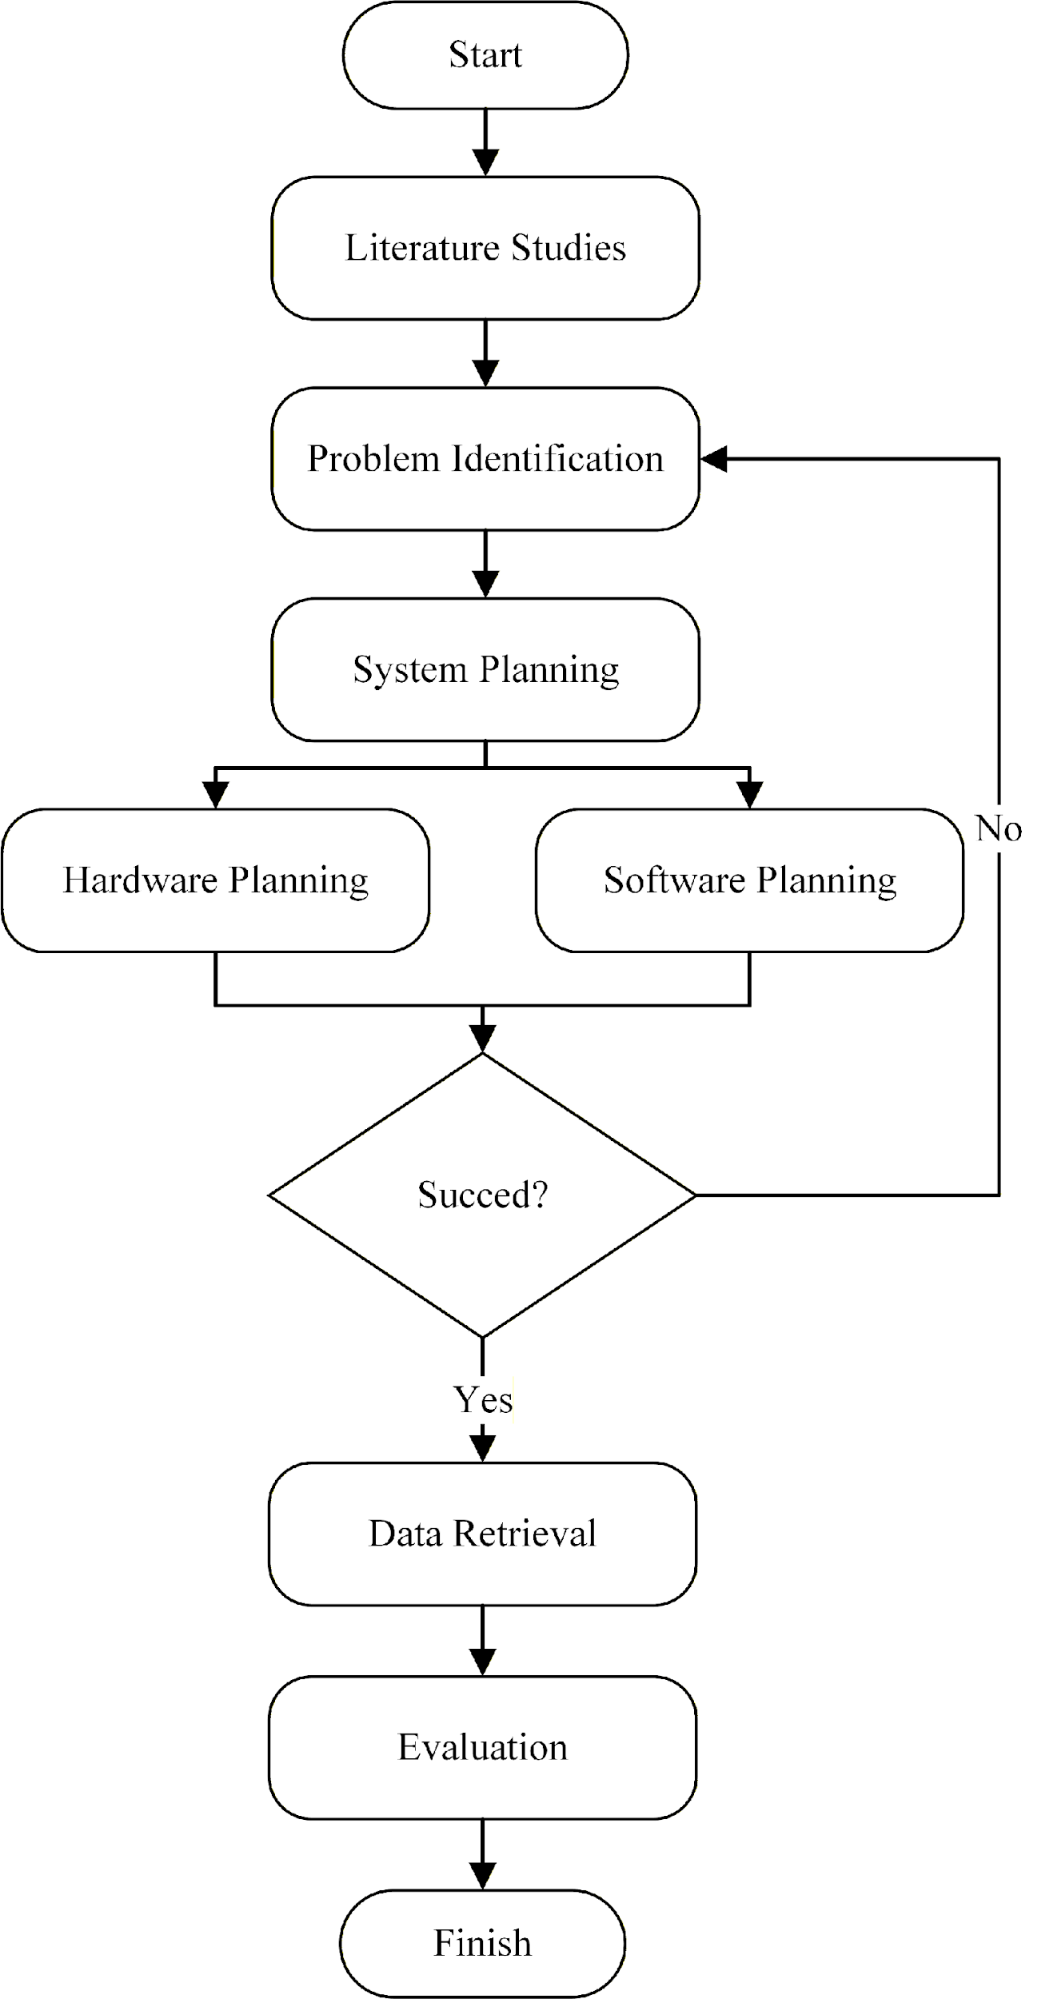
Figure 1. Research method
- Cyber Physical System Design
Figure 2 illustrates the system design flowchart. The design phase of the cyber-physical system involves developing a monitoring system that utilizes cyber-physical system technology. This system monitors several parameters collected from sensors, such as current and voltage, to calculate power consumption. Measurements are performed using the PZEM-004T sensor [37], a multifunctional module capable of measuring power, voltage, current, and energy. This module integrates both voltage and current (CT) sensors. The calculated power data is then transmitted to the ESP32 microcontroller [38], which features an integrated WiFi module that sends the sensor data to a web server. The data is processed and made accessible via a web interface. The ESP32 firmware is developed using the Arduino IDE, incorporating the Arduino library for the PZEM sensor. Web application development is done using native PHP. Figure 3 shows the wiring diagram that illustrates the connections between system components.
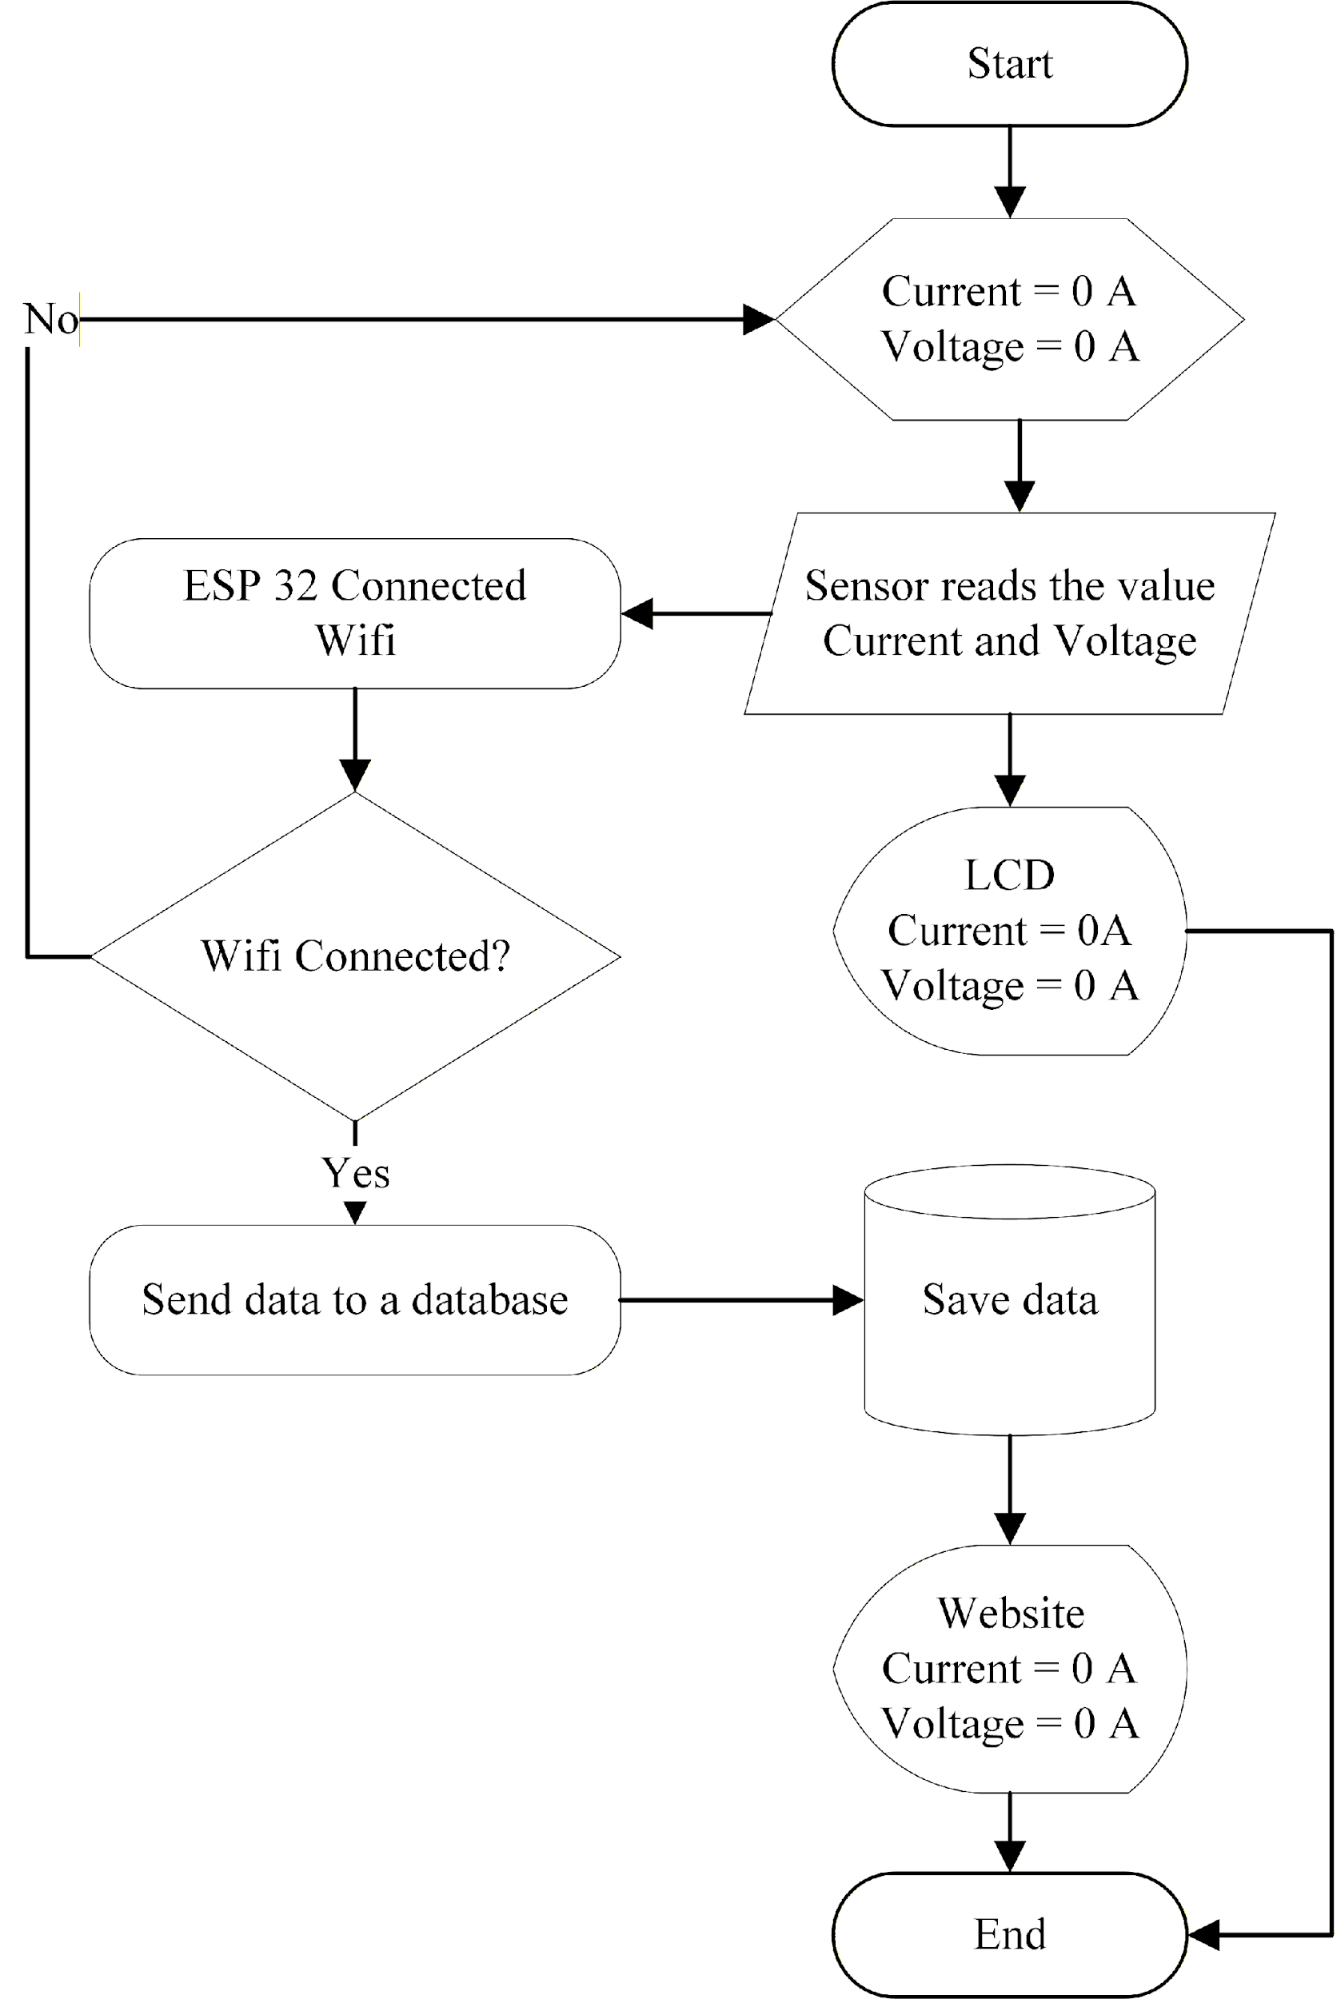
Figure 2. Monitoring system design flowchart
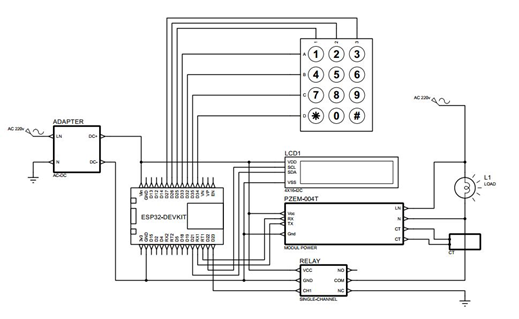
Figure 3. Diagram system Cyber physical
- WebApp System Design
Figure 4 outlines the system implementation stages. The web application represents the software component of the cyber-physical system and is developed using HTML, PHP, CSS, and JavaScript. Measurement data from the ESP32 is transmitted to a MySQL database via the internet, where it is stored and subsequently displayed on the website using JavaScript. The data is updated in real time and can be customized as needed. A database diagram (Figure 5) is used to describe the relationship between the database and the web system [39][40]. The data logger system supports two access levels: administrator and regular user. To access the system, users must log in with registered credentials, which are verified against entries in the database. Once authenticated, users are redirected to the dashboard corresponding to their role. Administrators can manage user accounts and view data from all users, whereas regular users are limited to viewing their own usage statistics. Figure 6 presents the system’s use case diagram, illustrating the functionalities available to different user types. Regular users can access the dashboard to monitor their usage history, view available charging locations, and manage personal information through the "Account" page. They can also log out at any time. Administrators, upon logging in, can access an expanded dashboard with additional features such as "Users Management" and "Location management". These allow them to modify user data and update charging locations, which are reflected in the user interface. Administrators also have the option to log out at any time.
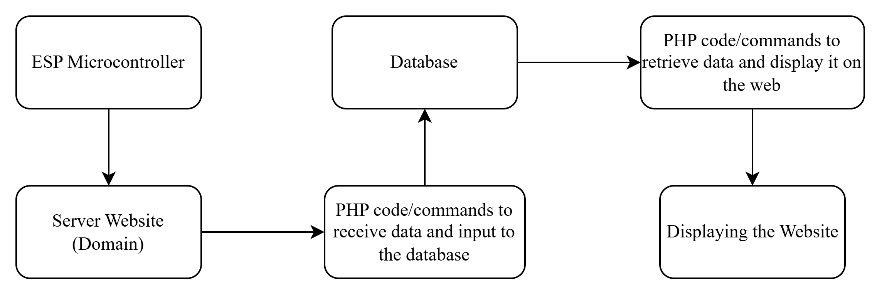
Figure 4. Steps of system implementation
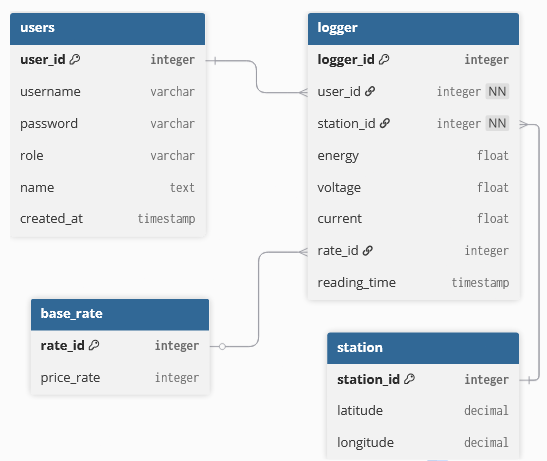
Figure 5. Database diagram
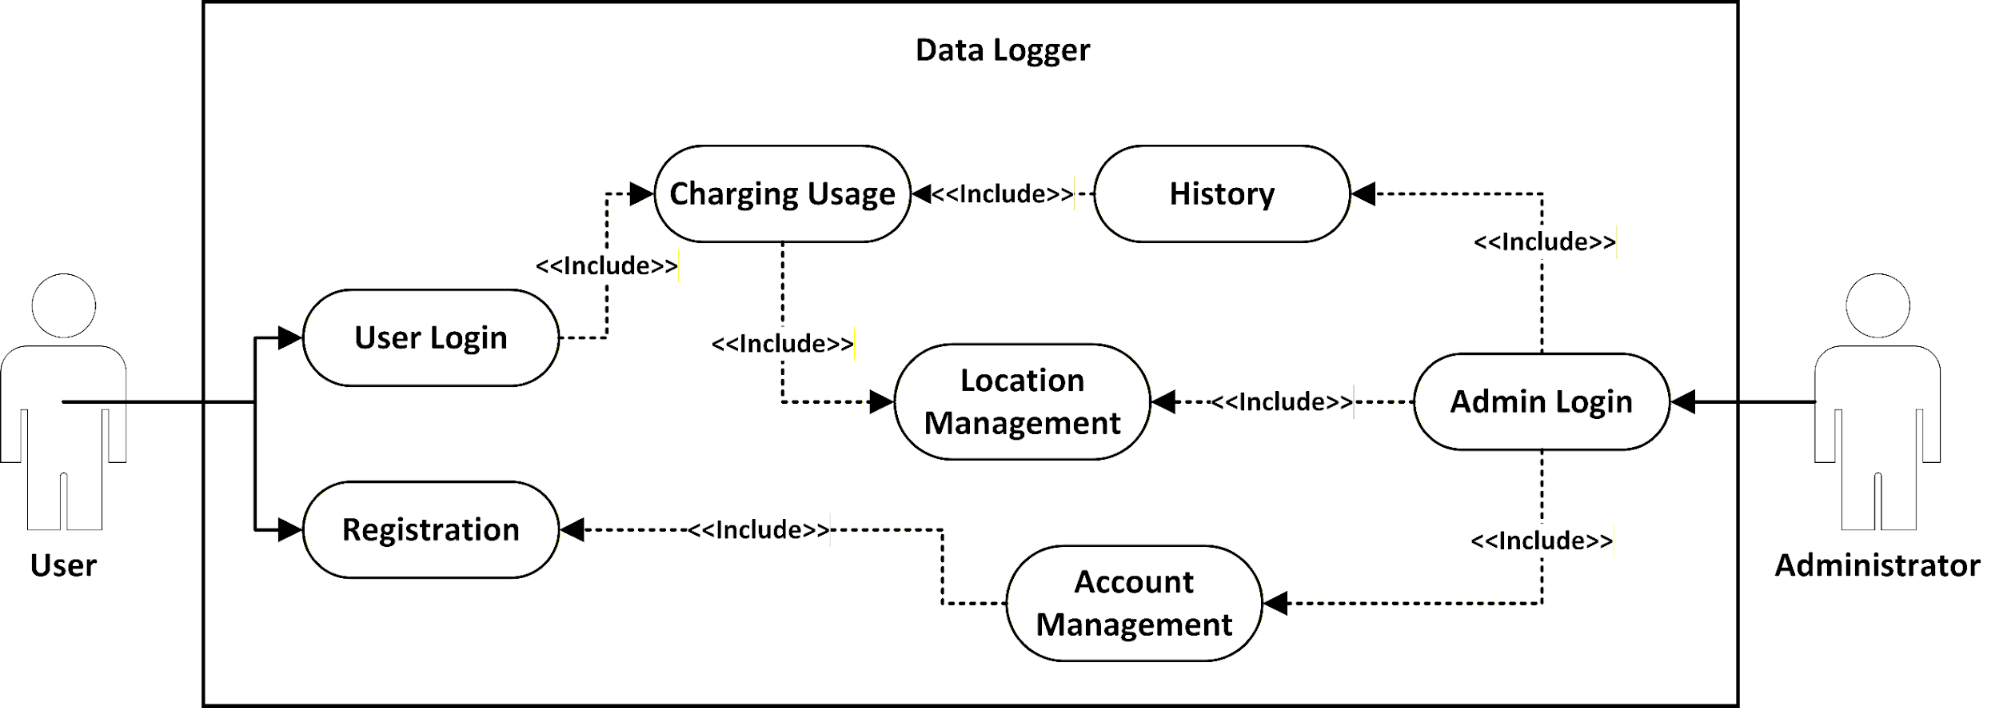
Figure 6. Use case diagram
- Test Plan
- Sensor Accuracy and Precision
This study evaluates the performance of the developed system by analyzing the precision and accuracy of current and voltage sensors. Four different electrical loads were tested, each measured three times to assess consistency. The devices tested included a rice cooker, water dispenser, electric fan, and phone charger. Experiments were conducted in the Computer and Network Laboratory of the Faculty of Engineering, Sebelas Maret University, with the room temperature maintained at 24 °C using air conditioning. Accuracy is defined as the closeness of the sensor’s measured value to the actual or expected reference value. In this context, accuracy refers to how well the current and voltage sensors align with values obtained using a calibrated reference instrument, the Sanwa CD800a digital multimeter. Accuracy was evaluated using the Absolute Percentage Error (APE) and the Mean Absolute Percentage Error (MAPE) metric. Lower APE or MAPE values indicate higher accuracy. Equations (1) and (2) describe the formulas used for these calculations [41].
| 
| (1) |
| 
| (2) |
Precision, on the other hand, indicates the consistency of sensor readings across multiple trials under identical conditions. A highly precise sensor will produce tightly grouped results with minimal variation. Precision was assessed using the Standard Deviation (SD) and Relative Standard Deviation (RSD) methods based on repeated measurements. Lower RSD values reflect higher precision. Four RSD values were obtained—one for each electrical load—and the average of these values was used as the final evaluation metric. Equations (3) and (4) show the formulas for SD and RSD [41]. While,  is the data amount,
  is the data
  ,
,  is the mean.
| 
| (3) |
| 
| (4) |
- Charging Test
Finally, system-level testing was conducted using three different electric motorcycles, due to the limited availability of four-wheeled electric vehicles during the testing period. Each motorcycle had distinct specifications. The system recorded their power usage, and the resulting data was analyzed to assess performance and validate the system's reliability in real-world scenarios.
- RESULT AND DISCUSSION
- Software and Hardware Design Results
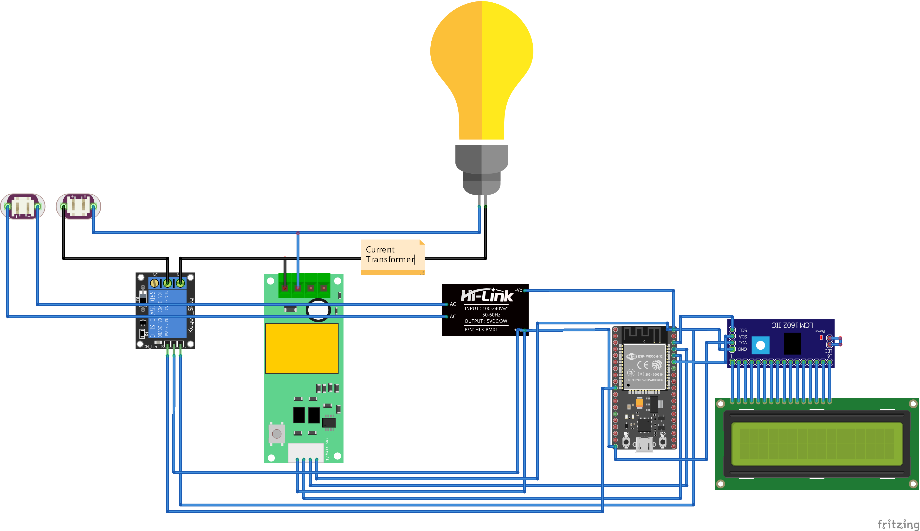
The design process comprises two main components: hardware design and software design. Hardware design involves assembling and integrating the necessary components, while software design focuses on developing the underlying systems, including website programming and program development using the Arduino IDE. As illustrated in Figure 7, the key components are interconnected. The system requires an initial power source to operate several components. A 220V power supply is introduced and divided into multiple branches using a splitter. These branches are organized according to their respective functions. Two primary cable groups—blue and black—are further subdivided. The first blue cable connects to the relay, functioning as the output socket. The relay operates to connect or disconnect voltage based on commands from the ESP32. The second blue cable provides input to the ESP32, while the third blue cable connects to the PZEM-004T sensor for voltage measurement. Similarly, the black cables serve as inputs to the ESP32 and are used for current and voltage measurements via the PZEM-004T sensor. However, unlike the blue cables, they are not connected to the relay but directly to the socket. The incoming voltage is distributed between the socket input (via the relay) and the current transformer for current measurement, which is subsequently routed to the ESP32 for voltage analysis. It is important to note that the ESP32 requires a specific input voltage, necessitating the use of an adapter to step down the voltage to appropriate levels.
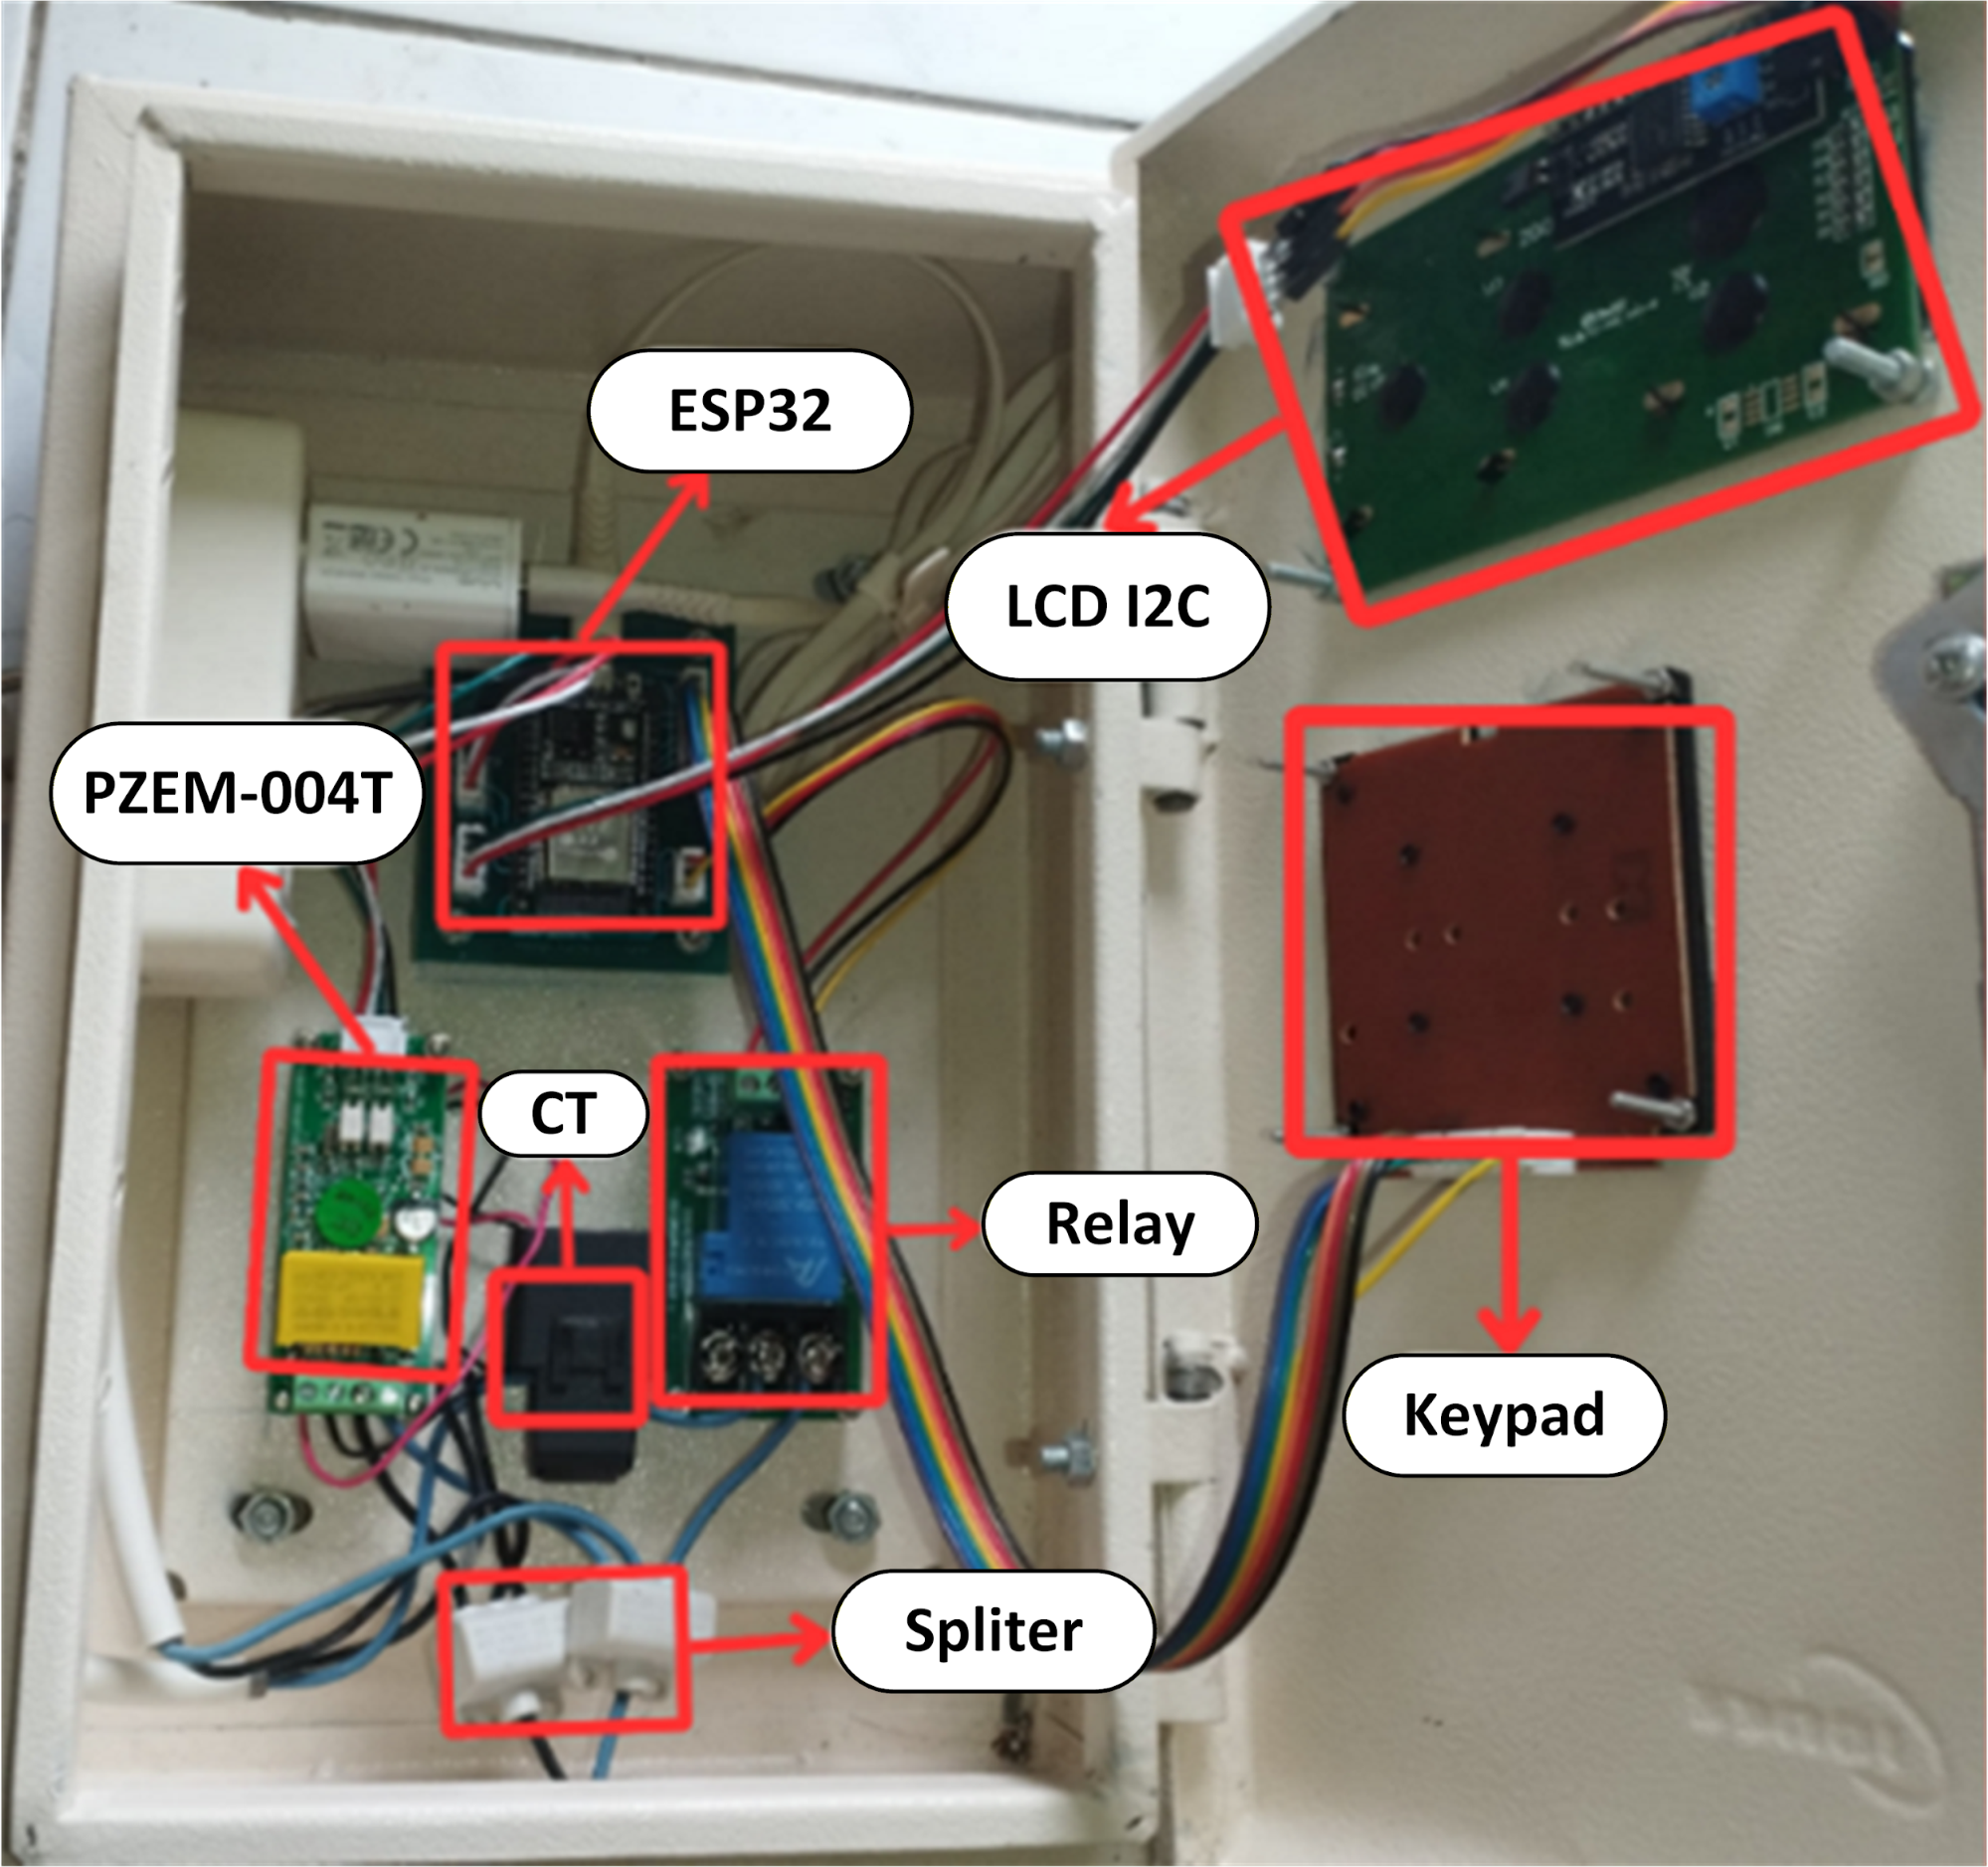
Figure 7. Hardware design results
- Database Software Design Results
In this study, MySQL was chosen as the database platform because it offers straightforward data querying as well as advanced functions such as filtering, sorting, and table joins. These features are essential for retrieving and analyzing records based on specific parameters. Figure 8 presents the MySQL database structure populated with data transmitted from the ESP32 and displayed on the website. The system is organized into four main tables: location (location_tab), measurement (logger), base rate (base_rate), and user (user). The user table stores account information, the base_rate table contains electricity “tariff data”, the location_tab table manages location details, and the logger table records electric vehicle charging transactions.
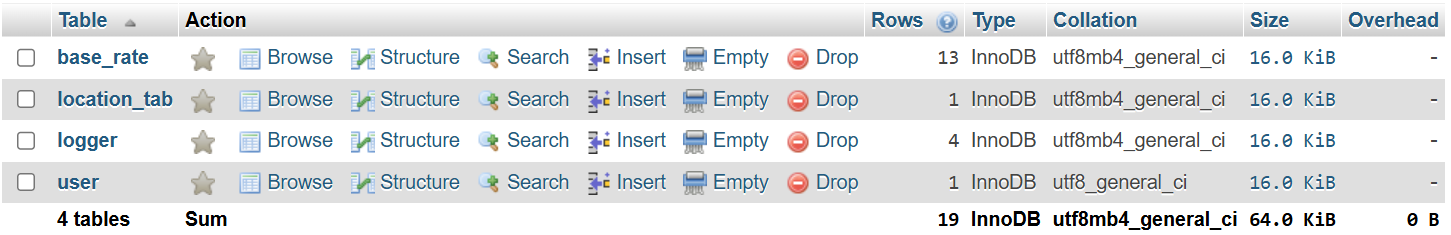
Figure 8. Database software results
- System Testing Results
Table 1 presents the results of AC current sensor testing using the Mean Absolute Percentage Error (MAPE) metric. The sensor achieved an accuracy of 98.79%, showing that its readings were very close to the actual values. The small error margin highlights the sensor’s reliability, while its precision of 99.24% confirms its ability to produce consistent measurements over time—an essential requirement for applications that demand stable monitoring. These findings suggest that the sensor is both accurate and precise, making it well-suited for industrial monitoring as well as research applications. Table 2 shows the performance of the AC voltage sensor (PZEM-004T), also evaluated using the MAPE method. This sensor recorded an accuracy of 99.59% and a precision of 99.87%, demonstrating its capability to provide stable and reliable voltage measurements. The minimal variation observed across repeated readings underscores its robustness and quality, making it a strong candidate for both small- and large-scale implementations. After calibration and installation, real-world data were gathered during the charging of three electric vehicles. The purpose of this stage was to evaluate the system’s performance while also tracking energy consumption and charging efficiency.
Table 1. AC current sensor testing results (PZEM-004T)
No | Load | Current | Error (%) | SD | RSD (%) |
Multimeter | PZEM-004T |
Data |
| Data |
|
1 | Rice Cooker (45W) | 0.195 | 0.195 | 0.195 | 0.000 | 0.344 | 0.000 | 0.000 |
0.194 | 0.195 | 0.515 |
0.194 | 0.195 | 0.515 |
2 | Water Dispenser (385W) | 1.510 | 1.514 | 1.514 | 0.265 | 0.398 | 0.000 | 0.000 |
1.506 | 1.514 | 0.531 |
1.508 | 1.514 | 0.398 |
3 | Electric Fan (36W) | 0.174 | 0.176 | 0.176 | 1.149 | 2.335 | 0.000 | 0.000 |
0.170 | 0.176 | 3.529 |
0.172 | 0.176 | 2.326 |
4 | Phone Charger (33W) | 0.057 | 0.058 | 0.057 | 1.754 | 1.754 | 0.002 | 3.039 |
0.058 | 0.058 | 0.000 |
0.057 | 0.055 | 3.509 |
Accuracy (%) | 98.79 |
Precision (%) | 99.24 |
Table 2. AC voltage sensor testing results (PZEM-004T)
No | Beban | Voltage | Error (%) | SD | RSD (%) |
Multimeter | PZEM-004T |
Data | x̄ | Data | x̄ |
1 | Rice Cooker (45W) | 199.00 | 199.90 | 200.20 | 0.452 | 0.604 | 0.520 | 0.260 |
198.00 | 199.90 | 0.960 |
200.00 | 200.80 | 0.400 |
2 | Water Dispenser (385W) | 189.50 | 189.80 | 189.80 | 0.158 | 0.123 | 0.000 | 0.000 |
189.70 | 189.80 | 0.053 |
189.50 | 189.80 | 0.158 |
3 | Electric Fan (36W) | 200.00 | 199.60 | 199.70 | 0.200 | 0.318 | 0.173 | 0.087 |
199.00 | 199.90 | 0.452 |
199.00 | 199.60 | 0.302 |
4 | Phone Charger (33W) | 202.00 | 201.00 | 201.17 | 0.495 | 0.576 | 0.379 | 0.188 |
202.00 | 201.60 | 0.198 |
203.00 | 200.90 | 1.034 |
Accuracy (%) | 99.59 |
Precision (%) | 99.87 |
- System Implementation Results
The three vehicles tested—Electric Motor 1, Electric Motor 2, and Electric Motor 3—each have different specifications. The data collected over a one-month period offer valuable insights into their energy consumption patterns and potential cost savings, while also highlighting opportunities for further system optimization.
- Electric Motor 1
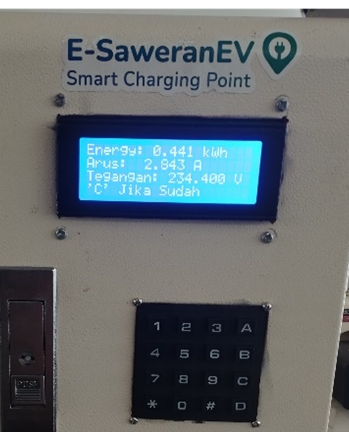
To initiate a charging session, users must input their User Identifier (UID), linked to a registered account. If no UID is available, users must first register on the website. Once logged in, their UID will appear on the main menu. This UID is then entered via the device keypad. Upon successful entry, confirmed by an LCD screen, the electric vehicle begins charging and data collection commences. Figure 9 presents test documentation, and Table 3 displays the collected data. According to Table 3, Electric Motor 1 exhibited a stable current average of 2.875 A and voltage average of 234.638 V. The energy usage increased steadily at an average rate of 0.063 kWh every 10 minutes, as visualized in Figure 10. Assuming a user charges the vehicle for 3 hours daily, 5 days per week, and based on the electricity tariff of Rp 1,114.74 per kWh (as per the Ministry of Energy and Mineral Resources for the B-3/Medium Voltage category), the annual electricity cost is approximately Rp 328,669.
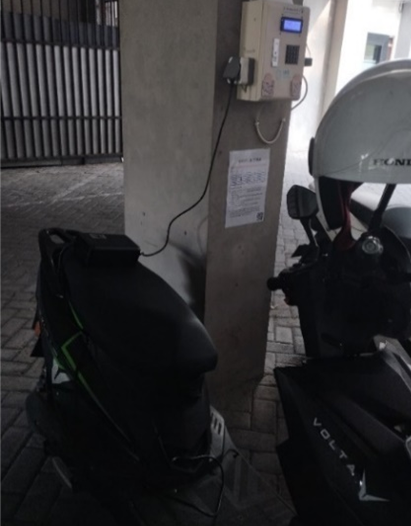
Figure 9. Trial with Electric Motor 1
Table 3. Data collection results for electric motor 1
No | Time (Minute) | Current (A) | Voltage (V) | Energy (kWh) | Growth (kWh) |
1 | 0 | 2.789 | 237.500 | 0.001 | 0 |
2 | 10 | 2.913 | 236.200 | 0.065 | 0.064 |
3 | 20 | 2.932 | 234.700 | 0.130 | 0.065 |
4 | 30 | 2.911 | 232.300 | 0.189 | 0.059 |
5 | 40 | 2.894 | 232.100 | 0.256 | 0.067 |
6 | 50 | 2.858 | 235.300 | 0.315 | 0.059 |
7 | 60 | 2.863 | 234.600 | 0.379 | 0.064 |
8 | 70 | 2.843 | 234.400 | 0.441 | 0.062 |
Average | 2.875 | 234.638 | 0.222 | 0.063 |
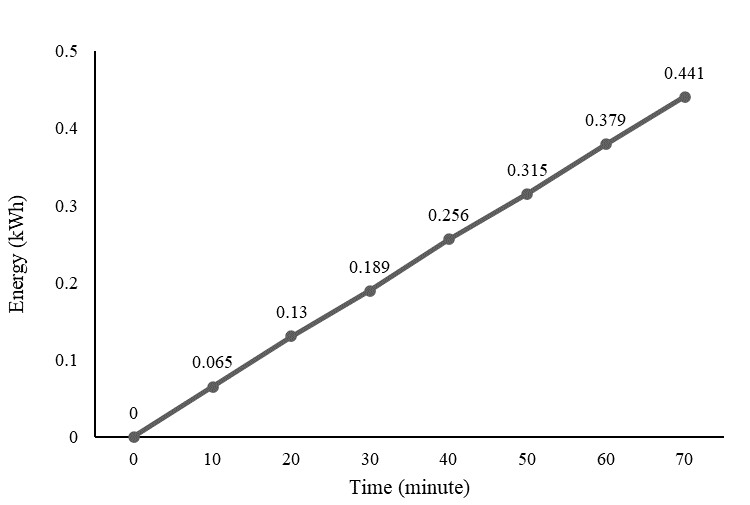
Figure 10. Energy Growth Graph for Electric Motor 1
- Electric Motor 2
The same procedure was followed for Electric Motor 2, which has a higher current rating. Care was taken to ensure measurements remained within the PZEM-004T sensor limit of 100 A and 260 V, and within the 30 A limit of the relay. Figure 11 presents test documentation of the second motor. Table 4 shows an average current of 6.955 A and a voltage of 233.525 V, with energy increasing by 0.164 kWh every 10 minutes. These results are depicted in Figure 12. Based on this rate, the annual charging cost for this vehicle would be Rp 855,017.
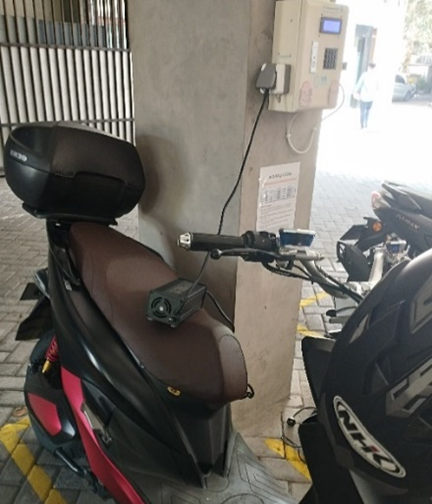
Figure 11. Testing with Electric Motor 2
Table 4. Data collection results for electric motor 2
No | Time (Minute) | Current (A) | Voltage (V) | Energy (kWh) | Growth (kWh) |
1 | 0 | 6.921 | 231.200 | 0.000 | 0 |
2 | 10 | 6.922 | 234.100 | 0.164 | 0.164 |
3 | 20 | 6.952 | 234.000 | 0.163 | 0.163 |
4 | 30 | 6.975 | 233.700 | 0.164 | 0.164 |
5 | 40 | 6.982 | 233.600 | 0.165 | 0.165 |
6 | 50 | 6.971 | 233.500 | 0.165 | 0.165 |
7 | 60 | 6.933 | 234.200 | 0.168 | 0.168 |
8 | 70 | 6.982 | 233.900 | 0.161 | 0.161 |
Average | 6.955 | 233.525 | 0.575 | 0.164 |
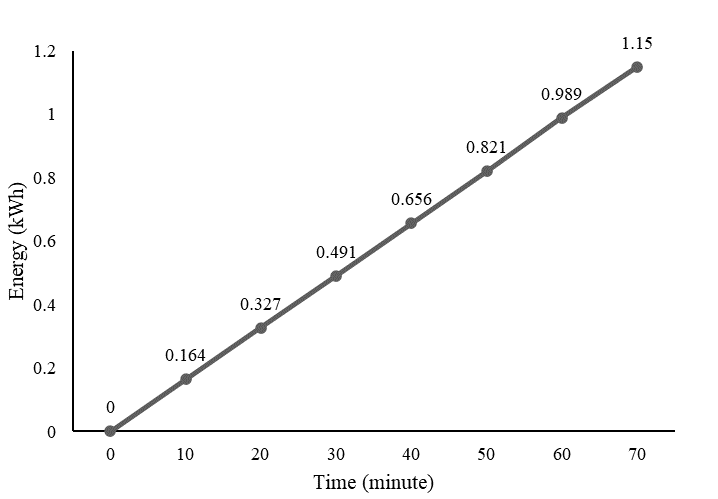
Figure 12. Energy Growth Graph for Electric Motor 2
- Electric Motor 3
The final test was conducted using Electric Motor 3 as shown in Figure 13, which has a mass between that of Electric Motors 1 and 2. The sensor operated within safe limits. Table 5 shows an average current of 5.707 A, voltage of 234.025 V, and energy consumption increasing by 0.139 kWh every 10 minutes, illustrated in Figure 14. The estimated annual cost is Rp 724,679.
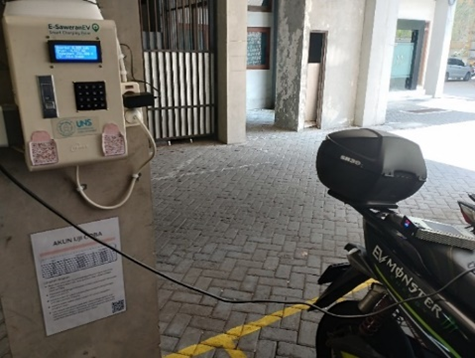
Figure 13. Testing with Electric Motor 3
Table 5. Data collection results for electric motor 3
No | Time (Minute) | Current (A) | Voltage (v) | Energy (kWh) | Growth (kWh) |
1 | 0 | 5.71 | 234.00 | 0.00 | 0 |
2 | 10 | 5.69 | 233.90 | 0.14 | 0.143 |
3 | 20 | 5.68 | 234.10 | 0.28 | 0.137 |
4 | 30 | 5.67 | 233.60 | 0.28 | 0.140 |
5 | 40 | 5.74 | 233.90 | 0.28 | 0.141 |
6 | 50 | 5.71 | 234.20 | 0.28 | 0.138 |
7 | 60 | 5.72 | 234.20 | 0.28 | 0.135 |
8 | 70 | 5.72 | 234.30 | 0.28 | 0.139 |
Average | 5.707 | 234.025 | 0.228 | 0.139 |
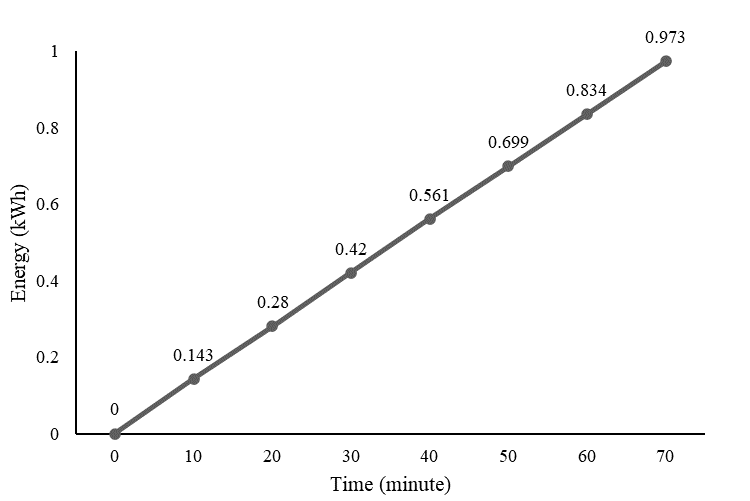
Figure 14. Energy Growth Graph for Electric Motor 3
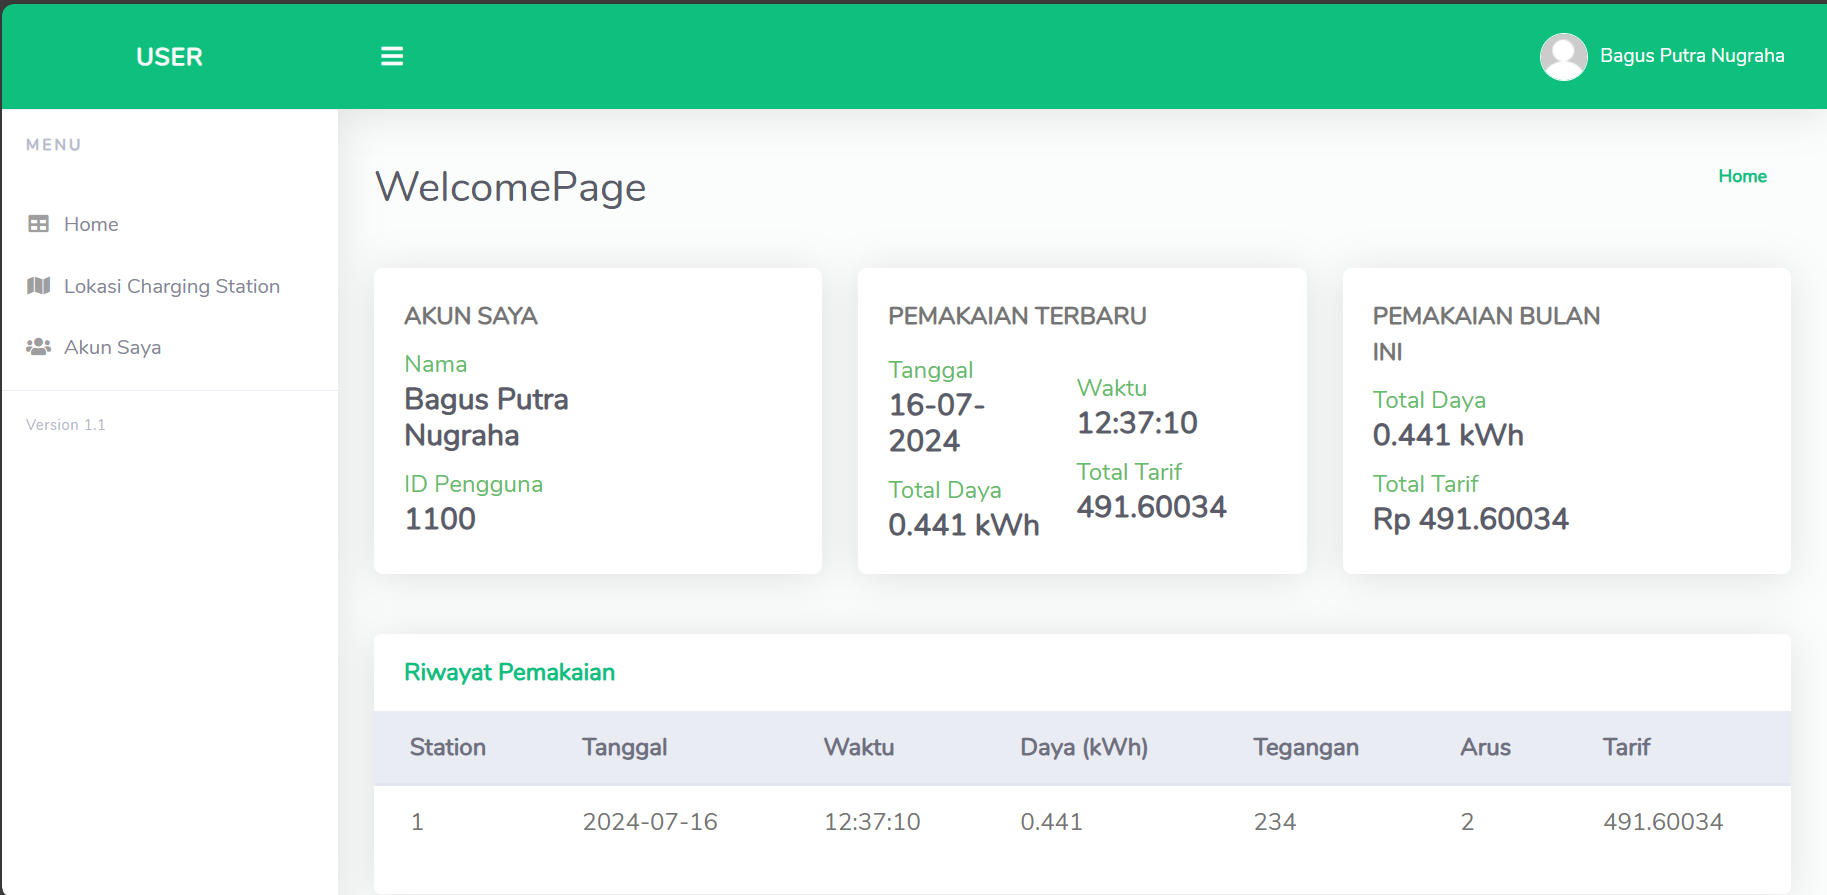
- Sending Data from the Device to the Database and Displaying it on the Website
All results were manually verified and cross-checked with the data displayed on the website to ensure accuracy. Data transmission was initiated by pressing the “C” button on the keypad. The transfer process followed several steps: sensor data were sent via the ESP32 to the database, which logged key parameters including timestamp, power, voltage, current, and station ID. Based on these inputs, the system calculated the corresponding electricity tariff, which was then displayed on the website. Users could subsequently monitor their monthly usage history and total energy cost. The first round of testing confirmed that the values shown on both the LCD screen and the website were consistent and reliable, as illustrated in Figure 15. Following installation, calibration, and testing, the system successfully collected real-world data from three electric vehicles with different specifications. The results provided meaningful insights into charging behavior, energy usage, and associated costs. Among the tested vehicles, Electric Motor 1 showed the highest efficiency with the lowest cost, while Electric Motor 2 recorded the highest energy expenditure. Overall, the smart charging station developed in this study offers a reliable and efficient solution for monitoring and managing electric vehicle charging. It has the potential to improve energy efficiency, reduce operational costs, and support safe and stable operation in both personal and commercial applications.
|
- Appearance on the LCD
|
|
|
- appearance on the website
|
Figure 15. Display appearance on the LCD and website
- CONCLUSIONS
In this study, a data logging application system was developed to monitor power usage at electric vehicle (EV) charging stations, providing users with a practical platform to track and manage charging activities. The system integrates hardware and software components to record essential parameters such as charging duration, energy consumption, and usage history. With the support of sensors and communication modules, the system ensures accurate data collection. Its performance was validated through real-world testing, with accuracy and precision measured using the Mean Absolute Percentage Error (MAPE) and Mean Relative Standard Deviation (MRSD). The system also demonstrated reliability under different charging conditions. Furthermore, functionality testing of the web interface using black-box methods confirmed that all features operated correctly. Installed at the Integrated Service Unit for Information and Communication Technology, Sebelas Maret University (UNS), the system was tested with three electric motorcycles. The results highlight its potential to enhance charging efficiency, improve safety and reliability, and encourage wider EV adoption by addressing current regulatory and operational gaps.
To further strengthen the system, several improvements are recommended. Ongoing development of both hardware and software is essential, particularly through testing under challenging environmental conditions such as temperature fluctuations, voltage instability, and network latency that may affect the ESP32 microcontroller and PZEM-004T sensor. Enhancing user experience through a dedicated application that supports real-time monitoring, scheduling, and charging notifications would also increase usability. In addition, collaboration with key stakeholders—including government agencies, utility providers, and EV manufacturers—will be important to ensure the system aligns with industry standards and integrates seamlessly with broader infrastructure. By adopting these measures, the data logging system can evolve into a more robust, reliable, and user-friendly solution that supports the sustainable growth of the electric vehicle ecosystem.
DECLARATION
Author Contribution
All authors contributed equally to the main contributor to this paper. All authors read and approved the final paper.
Funding
This research was funded by LPPM Sebelas Maret University for the research grant (No. 228/UN27.22/PT.01.03/2023) provided for the fiscal year 2023. This generous support has been instrumental in the successful execution of our project titled " Design and Application of an Integrated Recording System for Charging Stations in Limited Areas".
Acknowledgement
We would like to express our sincere gratitude to LPPM Sebelas Maret University for providing the research grant that made this study possible. The support, resources, and opportunities afforded through this grant have been instrumental in advancing our research activities. We are also deeply thankful to the faculty members and colleagues who offered guidance, feedback, and encouragement throughout the project. Their expertise has been invaluable in refining our work and ensuring its relevance to the field. We remain committed to fulfilling the objectives of this research and hope that our findings will contribute meaningfully to the development of integrated recording systems for charging stations within limited scopes.
REFERENCES
- P. Jain, A. Tandon and R. C. Bansal, “Integration of Renewable Energy Sources (RES) into Electric Vehicle (EV) Charging Infrastructure: State-of-the-Art Review,” in Electric Vehicle Charging Infrastructures and its Challenges, pp. 171–214, 2025, https://doi.org/10.1007/978-981-96-0361-9_9.
- V. G. Madaram, P. K. Biswas, C. Sain, S. B. Thanikanti, and P. K. Balachandran, “Advancement of electric vehicle technologies, classification of charging methodologies, and optimization strategies for sustainable development - A comprehensive review,” Heliyon, vol. 10, no. 20, p. e39299, 2024, https://doi.org/10.1016/j.heliyon.2024.e39299.
- F. Jiang et al., “A comprehensive review of energy storage technology development and application for pure electric vehicles,” J Energy Storage, vol. 86, p. 111159, 2024, https://doi.org/10.1016/j.est.2024.111159.
- M. Davoodi, H. Jafari Kaleybar, M. Brenna, and D. Zaninelli, “Sustainable Electric Railway System Integrated with Distributed Energy Resources: Optimal Operation and Smart Energy Management System,” International Transactions on Electrical Energy Systems, vol. 2025, no. 1, p. 6626245, 2025, https://doi.org/10.1155/etep/6626245.
- L. Arning, C. Silva, and H. Kaths, “Review of Current Practice and Research on E-Bikes in Transport Models,” Transp Res Rec, vol. 2677, no. 12, pp. 436–448, 2023, https://doi.org/10.1177/03611981231168848.
- W. Sutopo, M. Hisjam, and H. Wicaksono, “Estimating the market share of electric motorcycles: A system dynamics approach with the policy mix and sustainable life cycle costs,” Energy Policy, vol. 195, p. 114345, 2024, https://doi.org/10.1016/j.enpol.2024.114345.
- V. M. Macharia, V. K. Garg, and D. Kumar, “A review of electric vehicle technology: Architectures, battery technology and its management system, relevant standards, application of artificial intelligence, cyber security, and interoperability challenges,” IET Electrical Systems in Transportation, vol. 13, no. 2, p. e12083, 2023, https://doi.org/10.1049/els2.12083.
- G. G. Njema, R. B. O. Ouma, and J. K. Kibet, “A Review on the Recent Advances in Battery Development and Energy Storage Technologies,” Journal of Renewable Energy, vol. 2024, no. 1, p. 2329261, 2024, https://doi.org/10.1155/2024/2329261.
- I. Rachmawati and R. A. M. Rahardi, “Analysis of Electric Vehicle Purchase Intentions in Indonesia Using the Extension C-TAM-TPB Model,” International Journal of Current Science Research and Review, vol. 06, no. 12, 2023, https://doi.org/10.47191/ijcsrr/V6-i12-61.
- D. F. Hakam and S. Jumayla, “Electric vehicle adoption in Indonesia: Lesson learned from developed and developing countries,” Sustainable Futures, vol. 8, p. 100348, 2024, https://doi.org/10.1016/j.sftr.2024.100348.
- T. W. Sasongko, U. Ciptomulyono, B. Wirjodirdjo, and A. Prastawa, “Identification of electric vehicle adoption and production factors based on an ecosystem perspective in Indonesia,” Cogent Business & Management, vol. 11, no. 1, p. 2332497, 2024, https://doi.org/10.1080/23311975.2024.2332497.
- I. Pambudi and V. Juwono, “Electric Vehicles in Indonesia: Public Policy, Impact, and Challenges,” Asian Journal of Social and Humanities, vol. 2, no. 2, pp. 1631–1644, 2023, https://doi.org/10.59888/ajosh.v2i2.173.
- A. Pamidimukkala, S. Kermanshachi, J. M. Rosenberger, and G. Hladik, “Barriers and motivators to the adoption of electric vehicles: A global review,” Green Energy and Intelligent Transportation, vol. 3, no. 2, p. 100153, 2024, https://doi.org/10.1016/j.geits.2024.100153.
- A. Mohammed, O. Saif, M. Abo-Adma, A. Fahmy, and R. Elazab, “Strategies and sustainability in fast charging station deployment for electric vehicles,” Sci Rep, vol. 14, no. 1, p. 283, 2024, https://doi.org/10.1038/s41598-023-50825-7.
- I. Mahmud, M. B. Medha, and M. Hasanuzzaman, “Global challenges of electric vehicle charging systems and its future prospects: A review,” Research in Transportation Business & Management, vol. 49, p. 101011, 2023, https://doi.org/10.1016/j.rtbm.2023.101011.
- A. Lazuardy et al., “Technological, Environmental, Economic, and Regulation Barriers to Electric Vehicle Adoption: Evidence from Indonesia,” World Electric Vehicle Journal, vol. 15, no. 9, 2024, https://doi.org/10.3390/wevj15090422.
- H. and S. L. and Z. S. and M. S.-M. Gemein Olaf-Gerd and Niemi-Hugaerts, “Smart Cities,” in Springer Handbook of Internet of Things, pp. 523–554, 2024, https://doi.org/10.1007/978-3-031-39650-2_23.
- Y. and S. H. Sagarna Juan and Barabanova, “Smart Agriculture,” in Springer Handbook of Internet of Things, pp. 555–587, 2024, https://doi.org/10.1007/978-3-031-39650-2_24.
- A. and G. P. Fotopoulou Eleni and Zafeiropoulos, “Smart Homes and Buildings,” in Springer Handbook of Internet of Things, pp. 675–689, 2024, https://doi.org/10.1007/978-3-031-39650-2_28.
- L. and M. J. M. F. and B. A. and A. N. and L. G. F. and L. A. F. and S. H. and K. E. E. Caradot Nicolas and Alfonso, “Smart Water Management,” in Springer Handbook of Internet of Things, pp. 805–824, 2024, https://doi.org/10.1007/978-3-031-39650-2_33.
- I. Khalid Saifullah and Ahmad, “Optimizing Operations in IoT-Enabled Smart Grid,” in Springer Handbook of Internet of Things, pp. 611–637, 2024, https://doi.org/10.1007/978-3-031-39650-2_26.
- M. Karagiannis Georgios and Djurica, “Connected Vehicles,” in Springer Handbook of Internet of Things, pp. 691–725, 2024, https://doi.org/10.1007/978-3-031-39650-2_29.
- A. Lentini, “IoT Roadmap for Smart Factories and Supply Chain Organizations,” in Springer Handbook of Internet of Things, pp. 909–961, 2024, https://doi.org/10.1007/978-3-031-39650-2_38.
- M. and C. D. and B. Z. Ståhlbröst Anna and Runardotter, “Living Labs,” in Springer Handbook of Internet of Things, pp. 865–881, 2024, https://doi.org/10.1007/978-3-031-39650-2_36.
- S. Devasya et al., “IoT in Large-Scale Events,” in Springer Handbook of Internet of Things, 639–674, 2023, https://doi.org/10.1007/978-3-031-39650-2_27.
- C. and B. A. and G. C. and Z. S. Martinez Cristina and Bueti, “IoT for SDGs,” in Springer Handbook of Internet of Things, pp. 763–786, 2024, https://doi.org/10.1007/978-3-031-39650-2_31.
- S. Mejjaouli and S. Alnourani, “Electric vehicles charging infrastructure framework using internet of things,” J Clean Prod, vol. 480, p. 144056, 2024, https://doi.org/10.1016/j.jclepro.2024.144056.
- L. Govik, “Digital platforms for sharing and booking electrical vehicle charging infrastructure,” Int J Sustain Transp, vol. 18, no. 9, pp. 777–790, 2024, https://doi.org/10.1080/15568318.2024.2407139.
- G. Saravanan, R. Tripathy, R. U. Rao, and M. S. Seshasai, “Cloud-IoT framework for EV charge station allocation and scheduling: A spotted hyena jellyfish search optimization approach,” Sustainable Computing: Informatics and Systems, vol. 46, p. 101118, 2025, https://doi.org/10.1016/j.suscom.2025.101118.
- M. and O. M. and B. Z. El Himer Sarah and Ouaissa, “IoT System for Smart Electric Car Charging Station Using Micro-CPV Unit,” in Emerging Disruptive Technologies for Society 5.0 in Developing Countries: Challenges and Applications, pp. 223–235, 2025, https://doi.org/10.1007/978-3-031-63701-8_19.
- Y. A. A. S. Aldeen, M. M. Jaber, M. H. Ali, S. K. Abd, A. Alkhayyat, and R. Q. Malik, “Electric charging station management using IoT and cloud computing framework for sustainable green transportation,” Multimed Tools Appl, vol. 83, no. 10, pp. 28705–28728, 2024, https://doi.org/10.1007/s11042-023-16630-0.
- W. Duo, M. Zhou and A. Abusorrah, "A Survey of Cyber Attacks on Cyber Physical Systems: Recent Advances and Challenges," in IEEE/CAA Journal of Automatica Sinica, vol. 9, no. 5, pp. 784-800, 2022, https://doi.org/10.1109/JAS.2022.105548.
- A. Kaur and J. M. Chatterjee, “Applications of Cyber-Physical Systems,” in Cyber‐Physical Systems, pp. 289–310, 2022, https://doi.org/10.1002/9781119836636.ch13.
- D. B. Rawat, J. J. P. C. Rodrigues, and I. Stojmenovic, Cyber-Physical Systems: From Theory to Practice. USA: CRC Press, Inc., 2015, https://doi.org/10.1201/b19290.
- M. J. Hornos and M. Quinde, “Development methodologies for IoT-based systems: challenges and research directions,” J Reliab Intell Environ, vol. 10, no. 3, pp. 215–244, 2024, https://doi.org/10.1007/s40860-024-00229-9.
- K. Y. Sevak and B. George, “The evolution of Internet of Things (IoT) research in business management: a systematic review of the literature,” Journal of Internet and Digital Economics, vol. 4, no. 3, pp. 242–265, 2024, https://doi.org/10.1108/JIDE-12-2023-0026.
- M. F. Pekşen, U. Yurtsever, and Y. Uyaroğlu, “Enhancing electrical panel anomaly detection for predictive maintenance with machine learning and IoT,” Alexandria Engineering Journal, vol. 96, pp. 112–123, 2024, https://doi.org/10.1016/j.aej.2024.03.106.
- H. J. El-Khozondar et al., “A smart energy monitoring system using ESP32 microcontroller,” e-Prime - Advances in Electrical Engineering, Electronics and Energy, vol. 9, p. 100666, 2024, https://doi.org/10.1016/j.prime.2024.100666.
- A. Fan et al., "Large Language Models for Software Engineering: Survey and Open Problems," 2023 IEEE/ACM International Conference on Software Engineering: Future of Software Engineering (ICSE-FoSE), 2023, https://doi.org/10.1109/ICSE-FoSE59343.2023.00008.
- H. Edison, X. Wang and K. Conboy, "Comparing Methods for Large-Scale Agile Software Development: A Systematic Literature Review," in IEEE Transactions on Software Engineering, vol. 48, no. 8, pp. 2709-2731, 2022, https://doi.org/10.1109/TSE.2021.3069039.
- J. E. M. Perea Martins, “Introducing the concepts of measurement accuracy and precision in the classroom,” Phys Educ, vol. 54, no. 5, p. 055029, 2019, https://doi.org/10.1088/1361-6552/ab3143.
AUTHOR BIOGRAPHY

| Faisal Rahutomo is a lecturer and researcher in the Department of Electrical Engineering at Sebelas Maret University (UNS), Surakarta, Indonesia. He is recognized for his dedication and expertise in electrical engineering. He earned his Bachelor of Engineering (S.T.) in Electrical Engineering from Brawijaya University, Malang, Indonesia, in 2003. He continued his studies at the Sepuluh Nopember Institute of Technology (ITS), Surabaya, where he obtained a Master of Computer (M.Kom.) in Informatics Engineering in 2009. In pursuit of further academic excellence, he completed his Doctor of Engineering (Dr.Eng.) in Computer Science and Electrical Engineering at Kumamoto University, Japan, in 2014. His research interests span software engineering, as well as data and knowledge engineering. |
|
|

| Bagus Putra Nugraha earned his Bachelor of Engineering (S.T.) in Electrical Engineering from Universitas Sebelas Maret, Indonesia, where he is currently continuing his studies in the same field within the Faculty of Engineering. Born on April 23, 2001, Bagus has a strong interest in computer engineering and telecommunications, particularly in basic programming, web development, and mobile application design. He actively engages in workshops, seminars, and research projects, seeking to bridge theoretical knowledge with practical applications in smart technologies, artificial intelligence (AI), and the Internet of Things (IoT). Known for his analytical thinking and teamwork, Bagus is dedicated to contributing to the advancement of electrical engineering. He can be reached at bagusputran6@student.uns.ac.id. |
|
|

| Atinkut Molla Mekonnen received his Bachelor’s degree in Information Technology from Wollo University, Kombolcha Institute of Technology (KIoT), Ethiopia, in 2017, followed by a Master’s degree in Computer Networks and Communications from the same institution in 2019. He is currently a lecturer and researcher in the Department of Information Technology at the College of Engineering and Technology, Injibara University, Ethiopia. His research interests include computer networks, the Internet of Things (IoT), artificial intelligence (AI), machine learning, and deep learning. He can be reached at atinkut.molla@inu.edu.et. |
|
|

| Bashiru Olalekan Ariyo obtained his Bachelor’s degree from Kwara State University, Malete, Nigeria, in 2017, and his Master’s degree from the University of Ilorin, Nigeria, in 2022. He currently serves as Chief Technologist at the University of Ilorin, Kwara State, Nigeria. His research interests include renewable energy systems, microgrid power systems, and energy systems optimization. He can be reached at ariy@unilorin.edu.ng. |
Faisal Rahutomo (Design and Application of a Cyber Physical Based Data Logger System for Charging Stations)