ISSN: 2685-9572 Buletin Ilmiah Sarjana Teknik Elektro
Performance Enhancement of Photovoltaic Panels Using Passive Heatsink Cooling and Single-axis Solar Tracking
Chico Hermanu Brillianto Apribowo 1, Wiwik Nur Winda 2, Hari Maghfiroh 3, Irwan Iftadi 4,
Muhammad Ahmad Baballe 5
1,2,3,4 Department of Electrical Engineering, Universitas Sebelas Maret, Surakarta, Indonesia
5 Dept. of Mechatronic Engineering, Nigerian Defence Academy (NDA), Kaduna, Nigeria
ARTICLE INFORMATION |
| ABSTRACT |
Article History: Received 30 March 2025 Revised 03 May 2025 Accepted 08 May 2025 |
| 
Indonesia's persistent tropical climate and strong sunlight year-round lend themselves well to photovoltaic (PV) applications. However, prolonged sun exposure raises panel temperatures and reduces energy conversion efficiency. This study examines how to experimentally enhance the power output and efficiency of PV systems by combining single-axis solar tracking with passive heatsink cooling. On sunny days, two identical 50 W polycrystalline PV panels were evaluated in Surakarta, Indonesia. Four setups were tested: baseline (no tracking or cooling), tracking only, cooling only, and a combination of both. Temperature, voltage, and current data were gathered using calibrated INA219 and MLX90614 sensors. Results indicate the system can enhance efficiency and power output. Tracking alone improved power by 26.42% and efficiency by 2.16%; cooling using an aluminum heatsink boosted power by 40.28% and efficiency by 3.39%. Combining tracking and cooling yielded the highest power increase of 55.61%, with a 2.79% efficiency gain. These findings demonstrate the reduced efficiency benefits due to thermal effects despite higher irradiance in tracking systems. This research offers practical insights for optimizing PV performance in tropical regions and supports developing cost-effective, hybrid enhancement strategies. |
Keywords: Photovoltaic Thermal Management; Single-Axis Solar Tracking; Passive Cooling System; Tropical Climate Conditions; Indonesia |
Corresponding Author: Chico Hermanu Brillianto Apribowo, Department of Electrical Engineering, Universitas Sebelas Maret, Surakarta, Indonesia. Email: chico@staff.uns.ac.id |
This work is open access under a Creative Commons Attribution-Share Alike 4.0 
|
Document Citation: C. H. B. Apribowo, W. N. Winda, H. Maghfiroh, I. Iftadi, and M. A. Baballe, “Performance Enhancement of Photovoltaic Panels Using Passive Heatsink Cooling and Single-axis Solar Tracking,” Buletin Ilmiah Sarjana Teknik Elektro, vol. 7, no. 2, pp. 147-157, 2025, DOI: 10.12928/biste.v7i2.13150. |
INTRODUCTION
Electrical energy has an important role in human life today, almost all activities require electrical energy for commercial, industrial, and household daily activities [1]-[4]. Therefore, to meet the demand for electrical energy, it is necessary to have an adequate supply of energy, electricity with fossil fuels, and renewable energy. As the global demand for clean and sustainable energy intensifies, solar photovoltaic (PV) technology continues to attract significant attention due to its scalability, zero-emission operation, and decreasing production costs. Indonesia is a developing country that fulfills electricity needs mostly from power plants that still use fossil fuels [5]-[7]. Indonesia's government through the National Energy Policy (KEN) formulated an energy mix to decrease the dependence on fossil fuels. The energy mix has the achievement target in 2025 as renewable energy at least 23%, petroleum less than 25%, coal at least 30%, and natural gas at least 22% [8]-[14].
Based on regulations issued by the Government of Indonesia, the most appropriate use of new and renewable energy to be implemented is the Panel PV, namely, a technology that works by converting sunlight into electrical energy. PV was selected based on the potential for new and renewable energy in Indonesia, namely the availability of sunlight throughout the year. Indonesia is a tropical country located on the equator. Most parts of Indonesia get sufficient solar radiation intensity with daily radiation of up to 4.8 kWh/m2 per day [15]-[17].
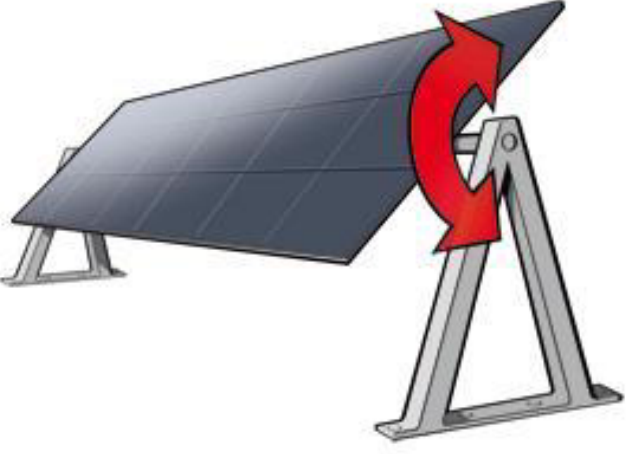
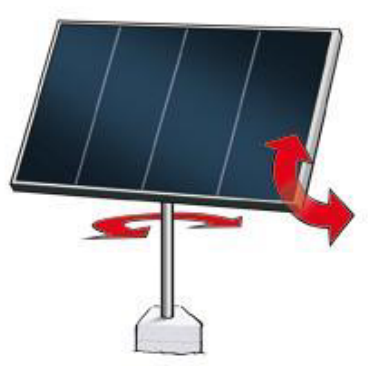
PV as a new and renewable energy technology, still has shortcomings, one of which is related to the low level of power output efficiency. According to [18][19] most PV panels have the efficiency range of 10-15%. This is because the application of PV which is installed statically or does not move causes the reception of solar energy to be received is not optimal. After all, the sun is a moving object that always moves from east to west. Solar Tracker as additional technology is needed as a drive system for PV which will follow the movement of the sun so that the solar panels will get optimal sunlight. Generally, there are two types of solar tracking: single-axis and dual-axis as illustrated in Figure 1.
Simultaneously, various cooling techniques have been developed to dissipate heat and maintain lower PV operating temperatures. These include [20]: active cooling methods, such as water spray [21], forced convection [22], and phase change materials (PCMs) [23], which are effective but require additional power and may increase maintenance needs. Passive cooling methods, such as aluminum finned heatsinks, natural convection, radiative cooling, and floating PV structures [24]-[26], which are simpler and operate without external energy inputs but may offer limited cooling capacity.
| 
|
(a) single axis | (b) dual axis |
Figure 1. Type of PV’s solar tracking system [27]
Fahad, et al [28]. compared the increase in power between the single-axis and the dual-axis solar tracker systems with only a 3.96% difference, this shows that the single-axis and dual-axis solar tracker systems do not have a significant increase in power. The dual-axis solar tracker system has different installation and operating costs. Research by Lazaroiu, et al. [29] comparing the single-axis solar tracker PV system with a static PV system state that there is an increase in efficiency of 12-20%.
The problem of the efficiency of the panel PV is not only related to the problem of not optimal reception of solar radiation. The performance of the PV system is influenced by several parameters, one of which is temperature [30]-[34]. The unabsorbed portion of solar radiation is converted into heat energy and causes a decrease in the electrical efficiency of the PV system [35]-[38]. High levels of solar radiation cause panel temperatures PV to be too high where every 1°C increase causes a decrease in efficiency of 0.5% which also results in the lifespan of the panel PV [21],[39]-[41]. This requires cooling during the panel operation process PV. Heatsink as passive cooling was chosen for the cooling system because it does not require additional power. Efforts to reduce temperature using heatsink cooling were carried out by Jamaluddin, et al. with the addition of variations in the number of heatsink fins in PV which resulted in a temperature reduction of 3.6oC to 9.1oC [42]. While Swar, et al. were able to reduce the PV surface temperature by 12 oC [43]. Whereas Cuce, et al. prove that the heatsink cooling can improve the efficiency by 9% compared to the PV without cooling [44],[25],[24].
Some researchers already proposed a combination of tracking and cooling systems for PV. Pradeed, et al. proposed a dual-axis tracker with water cooling. They conclude that the proposed system can boost PV system efficiency [45]. However, since the tracking system and cooling need an electric supply, and the external power supply is used, the total cost of the system will be high, and the total efficiency, including the external supply, will be low. Reza, et al. [46] propose single-axis tracking with water cooling. In the experimental test, they use power from a battery in a PV system as the supply for both motor tracking and motor pumps in water cooling. They conclude that the proposed system can increase PV output power. They do not give an analysis of the power absorbed by the tracking and cooling system from the PV system.
In this research, optimizing solar radiation absorption using a single-axis solar tracker combined with heatsink cooling is an effort to increase the efficiency of PV panels. The contributions and novelty of this study are as follows:
- Experimental implementation of a passive hybrid system combining single-axis tracking and heatsink cooling without external power.
- Quantitative evaluation of power and efficiency across four configurations: baseline, cooling-only, tracking-only, and combined.
- Demonstration of the sub-additive interaction between cooling and tracking effects under tropical climate.
The rest of the paper is as follows: Section II discusses the materials and method which include system configuration, data measurement, and data processing. The results and discussion are presented in Section III. Finally, the conclusion of this research is resumed in Section IV.
- METHODS
System Configuration
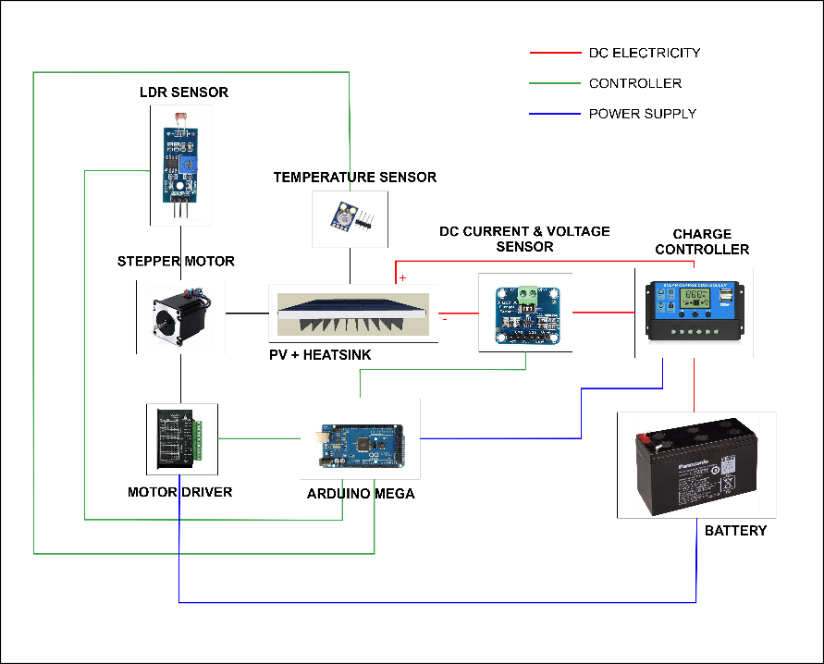
The proposed systems are equipped with a solar tracker designed with an Arduino mega microcontroller, light dependent resistor (LDR) sensor, and a stepper motor drive that actively tracks the sun and changes the position of the PV perpendicular to the sun's position, shown in Figure 2. This mechanism is to maximize the absorption of solar radiation so that the efficiency of output PV increases compared to the use of static PV panels [47]. The mechanism of the solar tracker system is classified into two, namely single-axis tracker and dual-axis tracker [48]. The single-axis tracker has only one axis of horizontal movement, usually parallel to that which allows PV to move from east to west following the movement of the sun. Meanwhile, the dual-axis tracker has two axes of motion that allow PV to follow the movement of the sun with an axis parallel to the north-south and east-west [41]. Optimization of solar radiation absorption is carried out using a solar tracker technology which is designed in a single-axis solar tracker system. The specification of the PV used is in Table 1.
Figure 3 is the configuration of the PV panel and heatsink. Heatsink as a cooling made from aluminum is placed against the bottom of the PV panel. The PV used is Polycrystalline MY SOLAR MY50M-12. PV works by converting solar radiation into electrical energy through a process called the effect PV [49]. The PV effect is a process that generates a voltage or current in the PV cell when there is energy from sunlight hitting the PV surface
Table 1. PV specifications
Panel PV “My Solar (MY50M-12) |
Cell type | Polycrystalline Silicon Solar Cell |
Peak Power (Pmax) | 50W |
Max. Power Volt (Vmp) | 17.6 V |
Max. Power Current (Imp) | 2.86 A |
Open Circuit Voltage (Voc) | 22 V |
Short Circuit Current (Isc) | 3.03 A |
Max. System Voltage | 700 V |
Operating Temperature | -45oC to +80°C |
Module Temperature | 25oC |
Efficiency | 14.2% |
Weight | 4.2 Kg |
Dimension | 0.67 m  0.53 m 0.03 m 0.53 m 0.03 m |
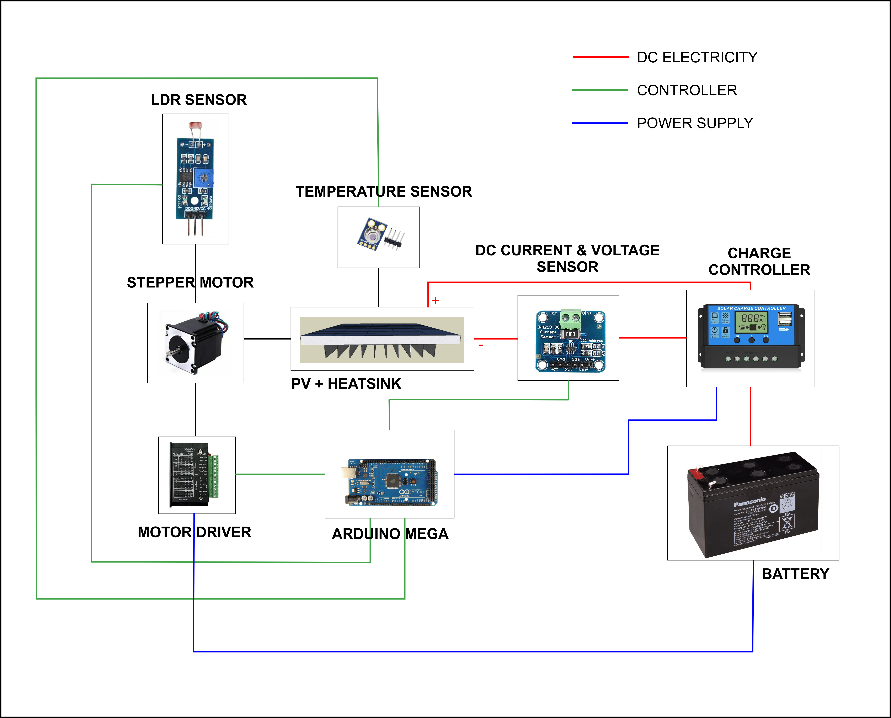
Figure 2. Proposed PV system
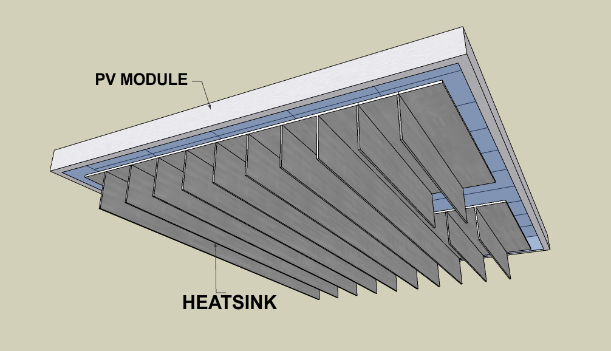
Figure 3. PV Panel Configuration and Heatsink
Comparing the PV type, polycrystalline need a wider surface than monocrystalline to produce the same amount of electric power and has a lower efficiency [51]. The thin film has an output power 45% greater than monocrystalline and polycrystalline and more efficiently in cloudy weather [52]. Heatsink as passive cooling has mechanism that refers to the technology used to minimize PV heat absorption without additional power consumption [53]. Therefore, passive cooling technology is considered effective in reducing the temperature of PV cells because it is relatively easy and cost-effective in production.
The heatsink is equipped with a finned surface of various shapes that are often used to cool electronic devices. The energy generated by the electronic device is transferred to the heatsink via conduction and from the heatsink to the ambient air by natural convection [53]. The optimal dimensions heatsink can be calculated using equation (1) to equation (3) [50]. The illustration of heatsink dimension is depicted in Figure 4.
where,  is the Rayleigh number,
  is the Fins length (m),
  is the Gravity (m/s),
  is the Prandtl number,
  is the Volumetric expansion coefficient (1/K),
  is the Fins distance (m),
  is the Kinematic viscosity,
  is the Number of fins,
  is the Surface temperature (°C),
  is the Heatsink surface width (m), and
  is the Ambient temperature (°C),
  is the Fin thickness (m).
 and
and  is the Rayleigh number for fins distance and length respectively, which is obtained by the equation (1) and equation (2). After knowing the value Rayleigh number, the optimum distance of the fins heatsink is calculated by the formula (3). The number of fins heatsink for the optimum distance of the fins is heatsink obtained by the equation (4). This research uses PV 50 WP with dimensions of
  cm. The heatsink is placed under the PV surface with a plate thickness of 3 mm and a thickness of 2 mm fins. The heatsink installation is equipped with a thermal paste to help optimize PV temperature absorption.
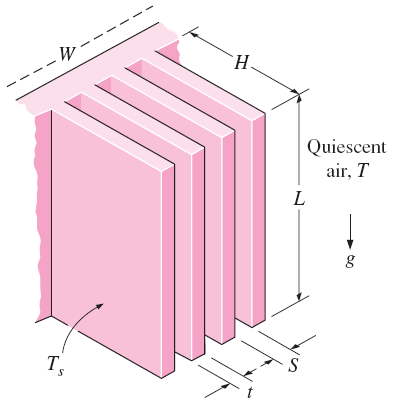
Figure 4. Heatsink Dimension [50]
Data Measurement
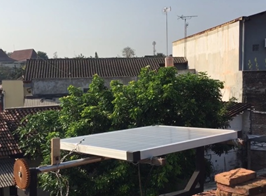
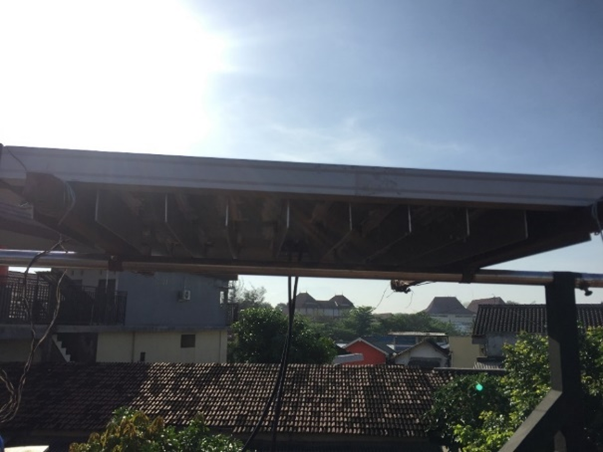
The testing is carried out for 7 days with a testing period of 8 hours starting at 08.00 a.m. to 16.00 p.m. The variables measured in this study are voltage (V), current (A), PV surface temperature (°C). Voltage and current are measured using the INA219 sensor, while the surface temperature of the PV is measured using the MLX90614 temperature sensor in real-time, wherein the current, voltage, and PV temperature data measurements are stored in the data logger. In the data measurement process, two PVs were used where one PV was installed with a static system without the addition of a solar tracker and heatsink cooling. The other PV is installed with the solar tracker and heatsink cooling system alternately, then the systems are solar tracker and heatsink cooling installed on the PV simultaneously. The real picture of testing conditions is shown in Figure 5.
Data Processing
The calculation of data from the measurement of current, voltage and surface temperature are carried out to determine the amount of power output, efficiency, and temperature change for further analysis of the relationship between temperature and PV performance. Where the electrical efficiency and thermal efficiency of PV are calculated using the equation (5). While thermal efficiency is calculated by the formula (6).
In equation (5),  is the electric efficiency of PV,
  is the efficiency of PV (14.2%),
  is the temperature coefficient of silicon (K-1), is the surface temperature of PV (°C), and
  is the reference temperature of PV (°C). At formula (6),
  (%) is thermal efficiency,
  is thermal energy (J),
  is mean solar intensity (Wh / m2), and
  is PV surface area (m2). The thermal energy in formula (6) is calculated using the formula (7). At formula (7), m is the object's mass (kg),
  is the body's heat coefficient (kJ / (kg *°C)),
  is the initial temperature (°C), and
  is the final temperature (°C). The sun intensity can be calculated using the following formula (8), where
  is the power (W). The total efficiency is calculated by equation (9).
| 
|
(a) No Tracking, No Cooling | (b) No Tracking, Cooling |
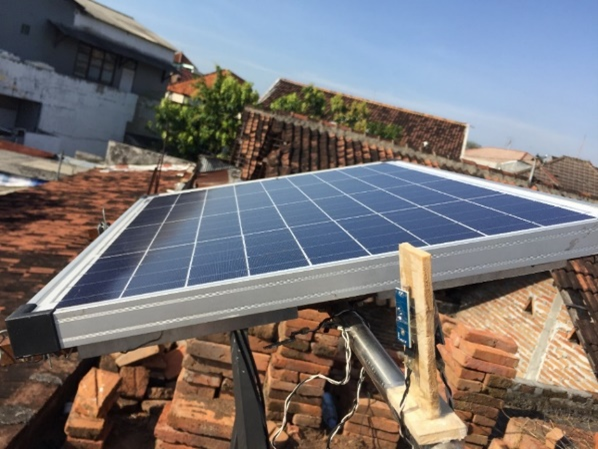
|
|
(c) Tracking, No Cooling | (d) Tracking, Cooling |
Figure 5. Testing condition
- RESULT AND DISCUSSION
After the experimental testing, in this section, the results will be provided and analyzed. The results from four testing conditions are compared. The results in the view of power are provided in Figure 6. It informs that compared to the normal condition of no cooling-no tracking; the highest peak power is came from cooling-tracking. Compared no cooling condition for no tracking and tracking, the letter has higher peak power. On the other hand, compared cooling conditions with and without tracking, it found that the first one has higher peak power. More detail, the largest average power output is generated by cooling-tracking condition which is 39.81 W. Furthermore, the average power output of 35.89 W is generated by cooling-no tracking condition. Followed by no cooling-tracking with average power of 31.88 W.
The PV surface temperature comparison is shown in Figure 7. The graph shown on PV normal condition (no cooling-no tracking) the temperatures fluctuating between the hours of 9:40 a.m. until 12:00 p.m., where the average temperature is worth 44.12°C. The temperature decrease is generated by cooling-no tracking condition with an average surface temperature of 36.02°C. Further temperature decreases also occurred in the cooling-tracking condition in which the average value of the temperature of 37.95°C, while in no cooling-tracking condition increased the mean average temperature to be 48.33°C. Overall, the highest temperature is from no cooling-tracking condition, and the lowest temperature is from cooling-no tracking condition. Therefore, this proof that the cooling has significant effect in the PV surface temperature.
The last analysis is from the efficiency which the results is depicted in Figure 8. From the graph, the highest average efficiency value is generated by cooling-no tracking condition at 13.64%. For cooling-tracking condition, efficiency is 13.56%. While no cooling-tracking condition produces an average efficiency of 13.48%. Therefore, it can be concluded that cooling can increase the efficiency of the PV system. Whereas the tracking system event can increase power output, it has low efficiency since in the tracking system the surface temperature of the PV is higher.
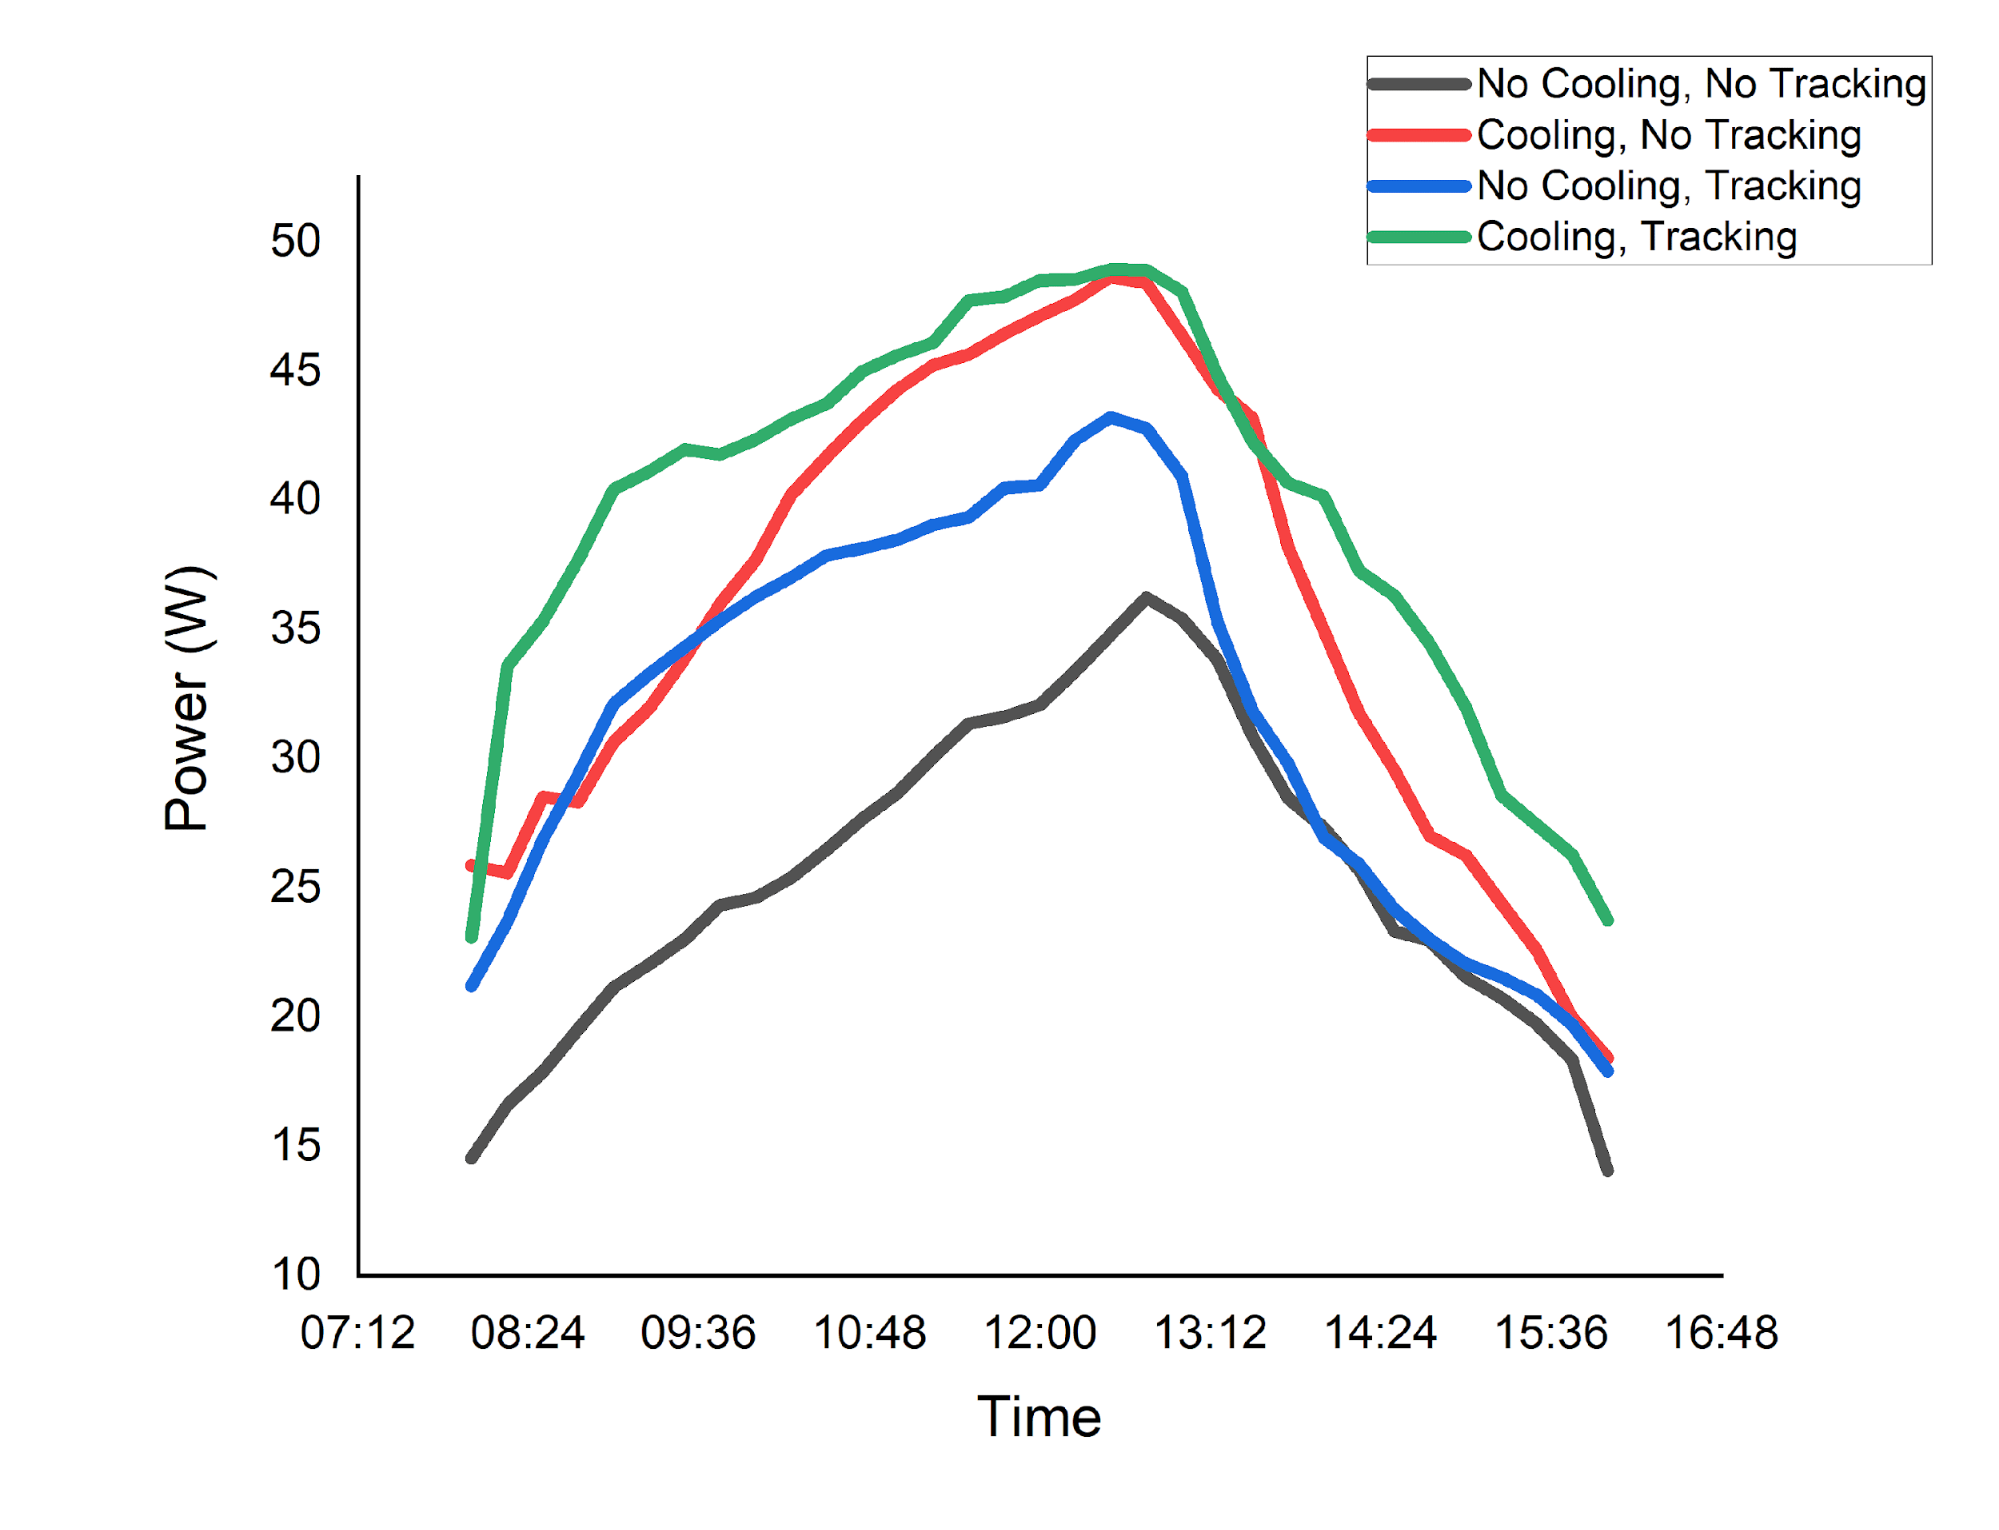
| 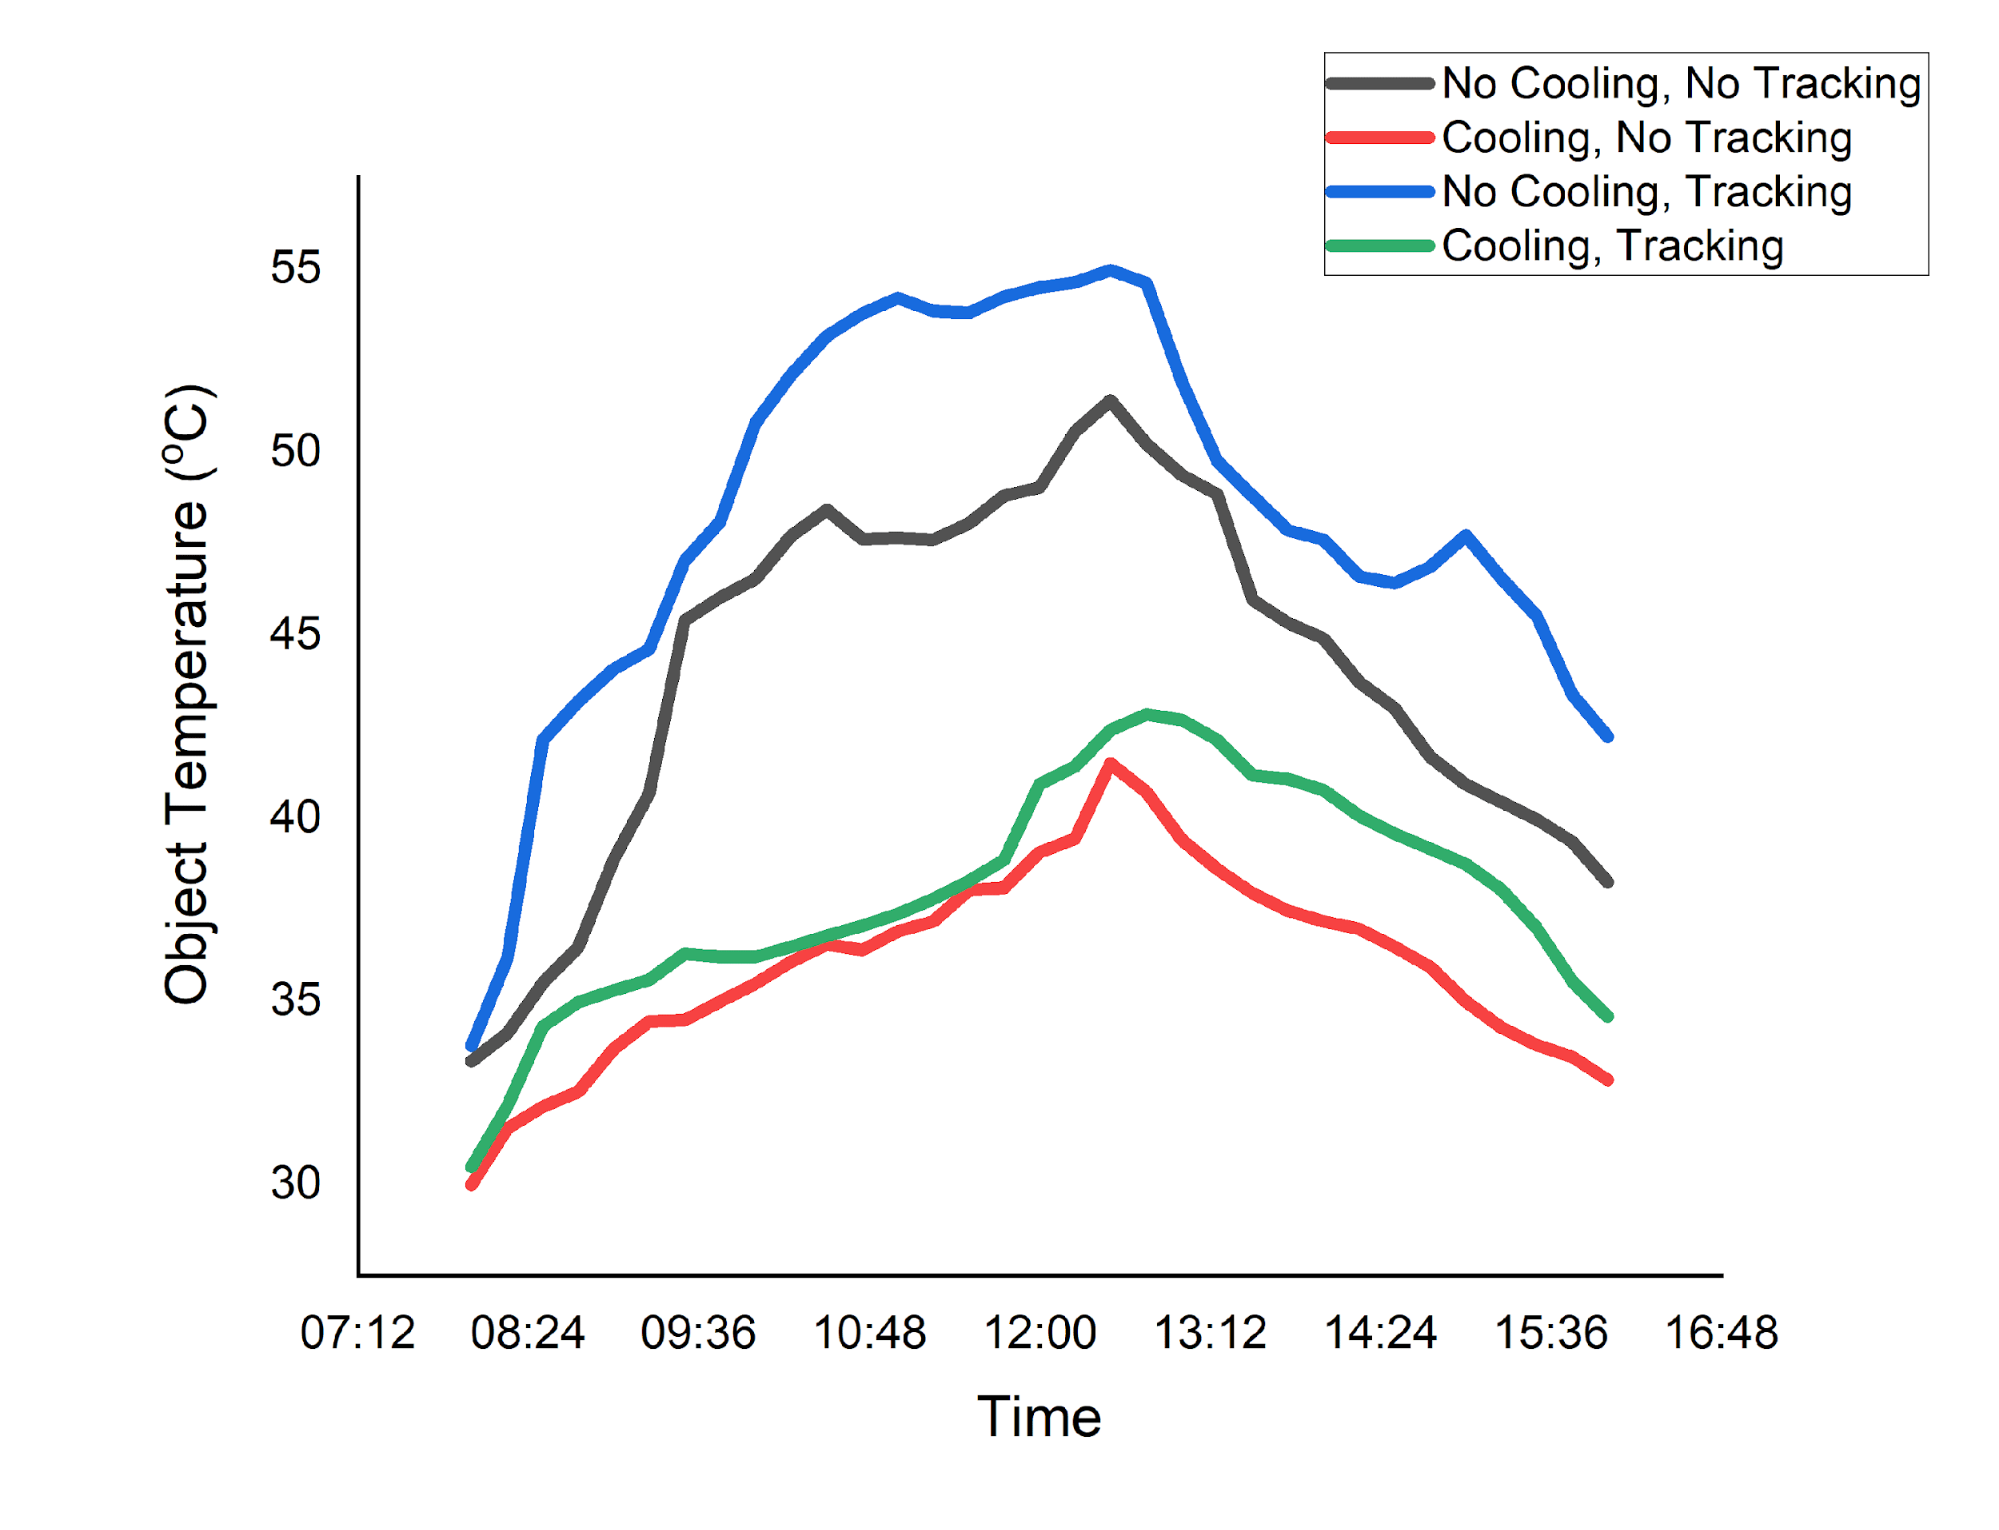
|
Figure 6. Power Comparison | Figure 7. PV Surface Temperature Comparison |
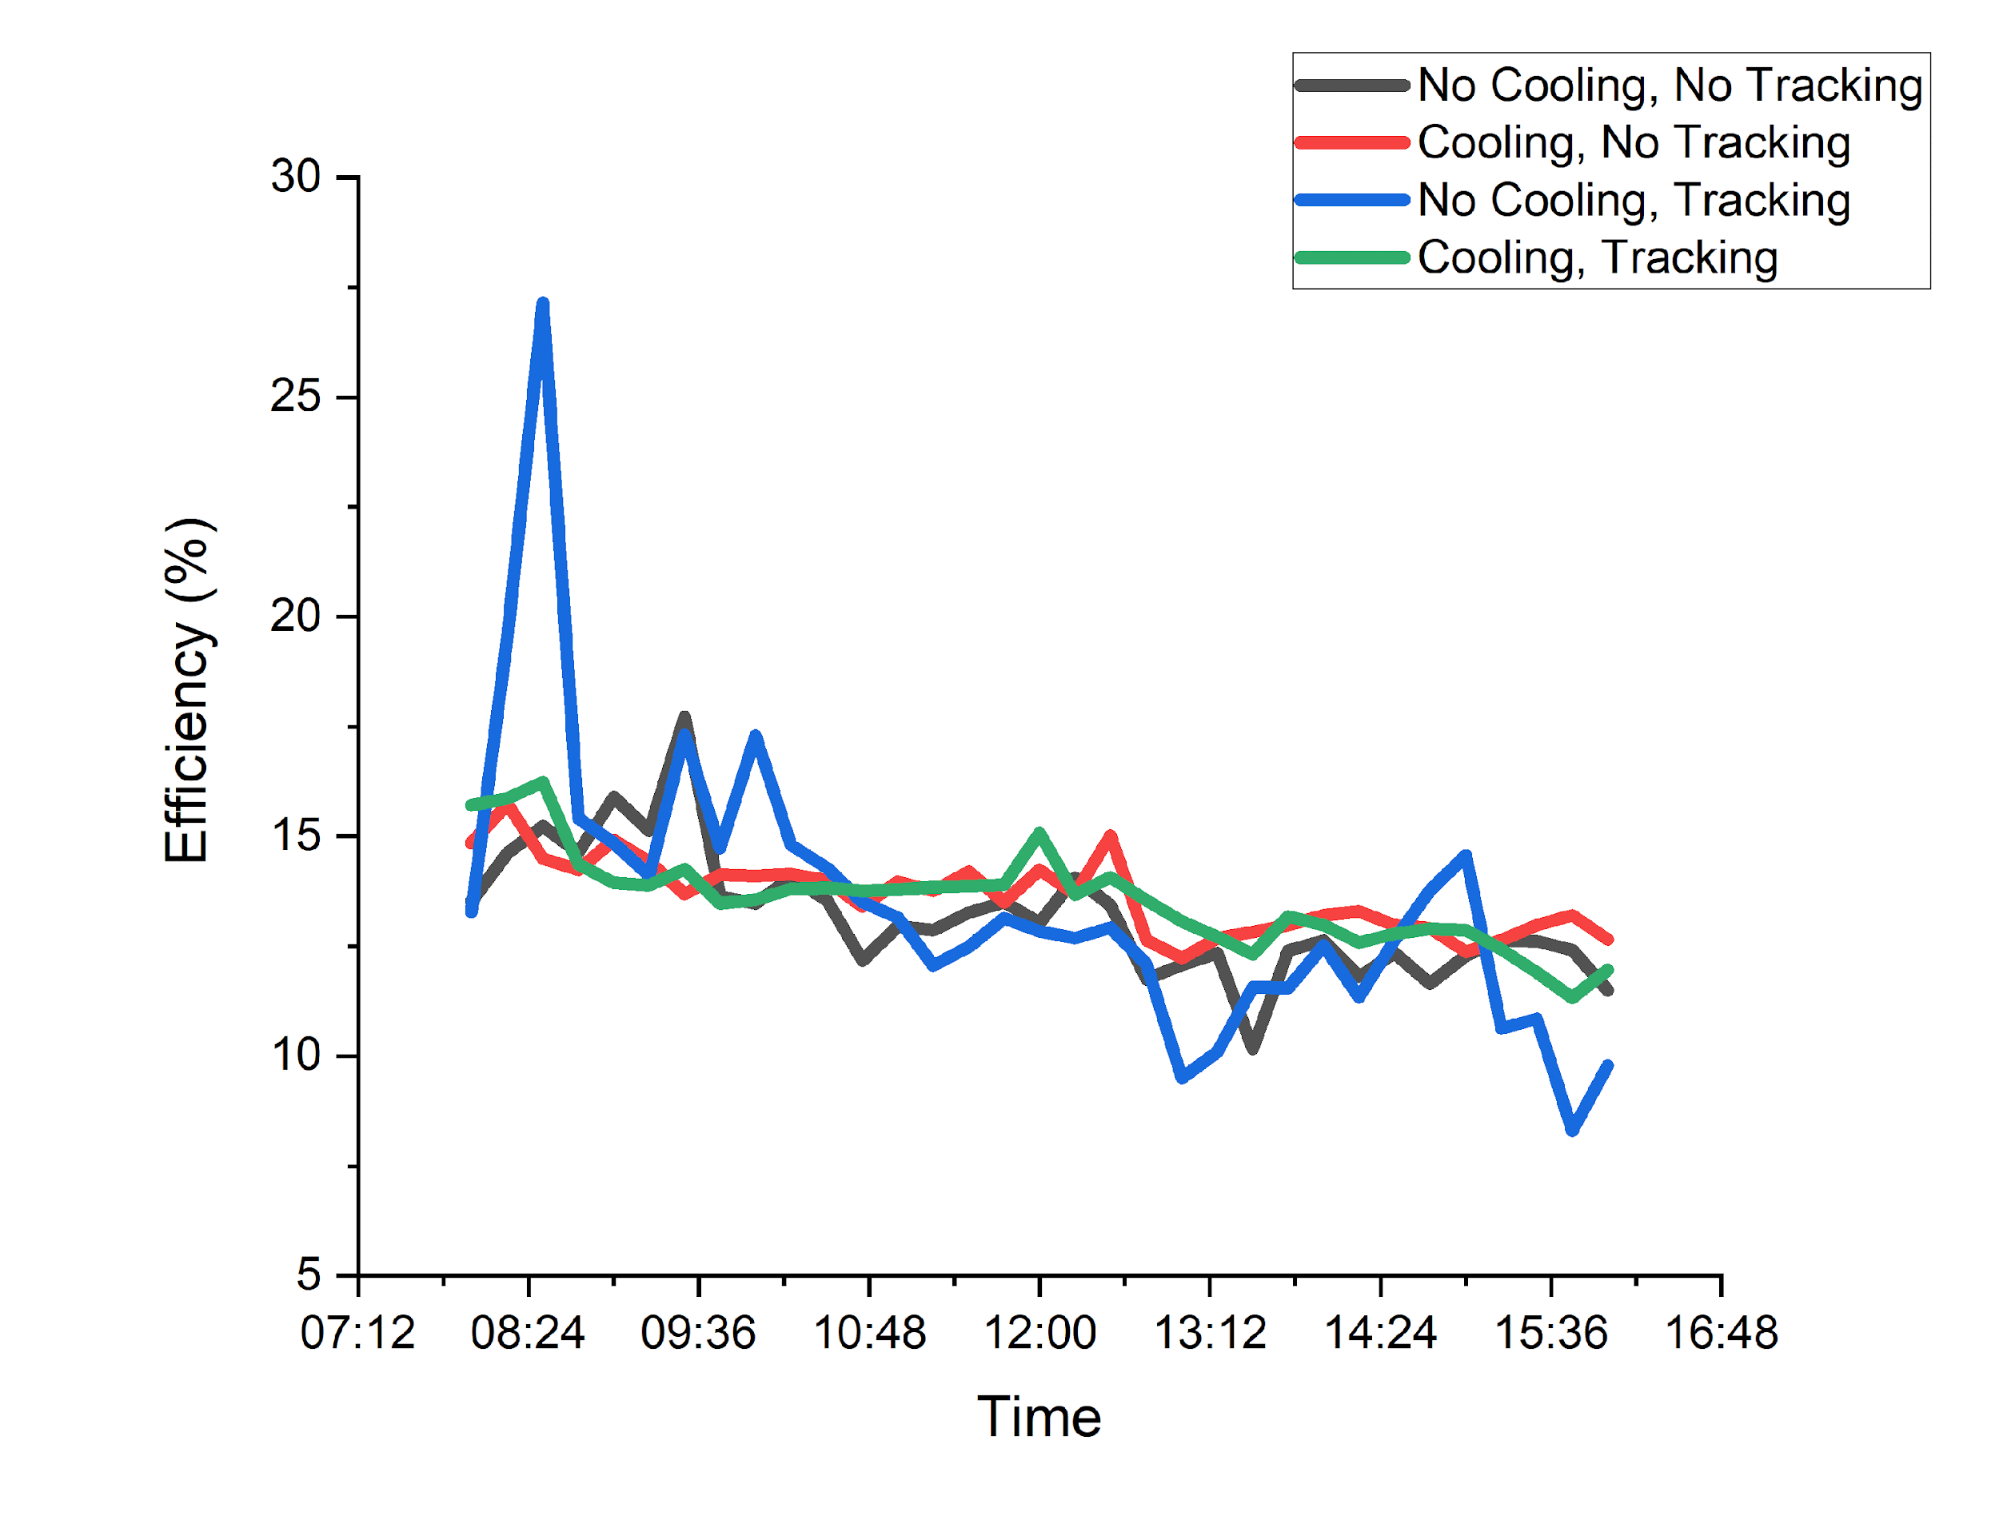
Figure 8. Efficiency Comparison
In more detail, the quantitative results are resumed in Table 2 for power, temperature, and efficiency. From the three conditions compared to PV no cooling-no tracking condition, there was the largest increase in power in the cooling-tracking method by 55.61% from an average of 25.58 W to 39.81 W. The increase in power was 40.28% and 24.62% also occurred in PV cooling-no tracking condition, which increased from an average of 25.58 W to 35.89 W, and PV no cooling-tracking condition only increased by 6.3 W from an average of 25.58 W to 31.88 W. These results shows that the addition of cooling and tracker system can increase the power output of a PV system.
In terms of PV surface temperature, four conditions are compared with no cooling-no tracking as the base. The temperature in no cooling-tracking condition has increased by 9.56%, namely 4.21°C from an average temperature of 44.12°C to 48.33°C. While in cooling-no tracking condition, the temperature decreased by 18.35%, namely 8.1°C from an average temperature of 44.12°C down to 36.02°C. In cooling-tracking condition temperature drop of 13.98%, which is 6.17°C of the average temperature of 44.12°C to 37.95°C. Of the four conditions compared, only no cooling-tracking condition which is experiencing an increase in temperature. The other two methods are experiencing a decrease in temperature. This is because no cooling-tracking, the solar panel moves to follow the movement of the sun so that the PV experiences a high enough temperature increase.
The results of the calculation of the total efficiency of no cooling-no tracking condition are compared to other conditions, the largest increase in total efficiency was generated by cooling-no tracking method by 3.39%. This shows that the use of a heatsink for cooling can reduce the panel temperature and increase efficiency. Meanwhile, the tracking method has experienced a low change in efficiency. This is because in the tracking method, the PV follow the sun movement which make it temperature higher compered to static PV system.
Table 2. Testing results in all conditions
Conditions | Power (W) | Change (%) | Surface Temp. (°C) | Change (%) | Ambient Temp. (°C) | Efficiency | Change (%) |
No Cooling-No Tracking | 25.58 | - | 44.12 | - | 32.53 | 13.20 | - |
Cooling-No Tracking | 35.89 | 40.28 | 36.02 | -18.35 | 34.73 | 13.64 | 3.39 |
No Cooling-Tracking | 31.88 | 24.62 | 48.33 | 9.56 | 35.94 | 13.48 | 2.16 |
Cooling-Tracking | 39.81 | 55.61 | 37.95 | -13.98 | 28.62 | 13.56 | 2.79 |
- CONCLUSIONS
The effort to increase PV system efficiency has been made using heatsink cooling and solar trackers. Four conditions have been tested which are: no cooling-no tracking, cooling-no tracking, no cooling-tracking, and cooling-tracking. Compared to PV with no cooling-no tracking as the base, the addition of the tracking method resulted in a power and efficiency increase of 26.42% and 2.16%, respectively. The use of the heatsink cooling method causes an increase in power by 40.28% and an efficiency of 3.39%. The heatsink cooling combined with the tracking method resulted in a 55.61% increase in power and a 2.79% increase in efficiency. This proves that both cooling and tracking can increase the efficiency of the PV system.
DECLARATION
Author Contribution
All authors contributed equally to the main contributor to this paper. All authors read and approved the final paper.
Funding
This research was supported by Universitas Sebelas Maret, Research Grant: Penelitian Hibah Riset Group (HRG UNS) with contract number 371/UN27.22/PT.01.03/2025.
Acknowledgement
Write a thank you to those who have helped in this research who are not listed in the author's list.
Conflicts of Interest
The authors declare no conflict of interest.
REFERENCES
- H. Maghfiroh et al., “Smart Home System With Battery Backup and Internet of Things,” Journal of Applied Engineering and Technological Science, vol. 5, no. 1, pp. 42–57, 2023, https://doi.org/10.37385/jaets.v5i1.1969.
- T. Kobashi, Y. Choi, Y. Hirano, Y. Yamagata, and K. Say, “Rapid rise of decarbonization potentials of photovoltaics plus electric vehicles in residential houses over commercial districts,” Appl Energy, vol. 306, 2022, https://doi.org/10.1016/j.apenergy.2021.118142.
- C. Hermanu, M. Nizam, and F. I. Robbani, “Optimal Placement of Unified Power Flow Controllers (UPFC) for Losses Reduction and Improve Voltage Stability Based on Sensitivity Analysis in 500 kV Java-Bali Electrical Power System,” Proceeding - 2018 5th International Conference on Electric Vehicular Technology, ICEVT 2018, pp. 83–87, 2019, https://doi.org/10.1109/ICEVT.2018.8628455.
- Y. Afifah, B. A. Chico Hermanu, R. A. Rosadi, and M. R. Hafiz, “The smart monitoring and automation control system for fish aquarium based on internet of things technology,” in AIP Conference Proceedings, vol. 2097, no. 1, 2019, https://doi.org/10.1063/1.5098193.
- C. H. B. Apribowo, Sarjiya, S. P. Hadi and F. D. Wijaya, "Integration of Battery Energy Storage System to Increase Flexibility and Penetration Renewable Energy in Indonesia: A Brief Review," 2022 5th International Conference on Power Engineering and Renewable Energy (ICPERE), pp. 1-6, 2022, https://doi.org/10.1109/ICPERE56870.2022.10037530.
- C. H. B. Apribowo, Sarjiya, S. P. Hadi, and F. Danang Wijaya, “Optimal Sizing and Siting of Battery Energy Storage Systems with Retired Battery,” in ICT-PEP 2022 - International Conference on Technology and Policy in Energy and Electric Power: Advanced Technology for Transitioning to Sustainable Energy and Modern Power Systems, Proceedings, pp. 327–332, 2022, https://doi.org/10.1109/ICT-PEP57242.2022.9988958.
- C. H. B. Apribowo, S. P. Hadi, F. D. Wijaya, and Sarjiya, “Optimal Sizing and Siting of Fresh and Second-Life Battery Energy Storage Systems Based on Linearized Optimal Power Flow for High Photovoltaic Penetration: A Comparative Study,” Evergreen, vol. 11, no. 3, pp. 2202–2216, 2024, https://doi.org/10.5109/7236864.
- Z. Tharo, E. Syahputra, and R. Mulyadi, “Analysis of Saving Electrical Load Costs With a Hybrid Source of Pln-Plts 500 Wp,” Journal of Applied Engineering and Technological Science, vol. 4, no. 1, pp. 235–243, 2022, https://doi.org/10.37385/jaets.v4i1.1024.
- Agus Ramelan and M. Hamka Ibrahim, “Simulation and Techno-Economic Analysis of On-Grid Battery Energy Storage Systems in Indonesia,” Journal of Electrical, Electronic, Information, and Communication Technology, vol. 3, no. 1, pp. 30-34, 2021, https://doi.org/10.20961/jeeict.3.1.50492.
- [10] ICEVT : 2018 5th International Conference on Electric Vehicular Technology : 30-31 October 2018, Surakarta, Indonesia. Institute of Electrical and Electronics Engineers, 2019.
- C. H. B. Apribowo, S. P. Hadi, F. D. Wijaya, and M. I. B. Setyonegoro, “Early prediction of battery degradation in grid-scale battery energy storage system using extreme gradient boosting algorithm,” Results in Engineering, vol. 21, p. 101709, 2024, https://doi.org/10.1016/j.rineng.2023.101709.
- C. H. B. Apribowo, S. P. Hadi, F. Danang Wijaya, M. I. B. Setyonegoro, and Sarjiya, “Optimal sizing and placement of battery energy storage system for maximum variable renewable energy penetration considering demand response flexibility: A case in Lombok power system, Indonesia,” Energy Conversion and Management: X, vol. 23, 2024, https://doi.org/10.1016/j.ecmx.2024.100620.
- U. G. K. Mulleriyawage and W. X. Shen, “Optimally sizing of battery energy storage capacity by operational optimization of residential PV-Battery systems: An Australian household case study,” Renew Energy, vol. 160, pp. 852–864, 2020, https://doi.org/10.1016/j.renene.2020.07.022.
- C. H. B. Apribowo, S. Sarjiya, S. P. Hadi, and F. D. Wijaya, “Optimal planning of battery energy storage systems by considering battery degradation due to ambient temperature: A review, challenges, and new perspective,” Batteries, vol. 8, no. 12, p. 290, 2022, https://doi.org/10.3390/batteries8120290.
- A. B. Pulungan et al., “Economic Analysis of Rooftop Based on-Grid and Off-Grid Photovoltaic Systems in Equatorial Area,” Journal of Applied Engineering and Technological Science, vol. 5, no. 1, pp. 460–473, 2023, https://doi.org/10.37385/jaets.v5i1.3158.
- A. S. Jacob, R. Banerjee, and P. C. Ghosh, “Trade-off between end of life of battery and reliability in a photovoltaic system,” J Energy Storage, vol. 30, 2020, https://doi.org/10.1016/j.est.2020.101565.
- P. Megantoro, P. Anugrah, Y. Afif, L. J. Awalin, and P. Vigneshwaran, “A practical method to design the solar photovoltaic system applied on residential building in Indonesia,” Indonesian Journal of Electrical Engineering and Computer Science, vol. 23, no. 3, pp. 1736–1747, 2021, https://doi.org/10.11591/IJEECS.V23.I3.PP1736-1747.
- N. E. Nteka and K. E. Kanyarusoke, "Concentrated Solar and Photovoltaic Thermal Cooled System for Domestic Use," 2019 International Conference on the Domestic Use of Energy (DUE), pp. 232-237, 2019, https://ieeexplore.ieee.org/abstract/document/8734446.
- S. Sinha and S. S. Chandel, “Review of recent trends in optimization techniques for solar photovoltaic-wind based hybrid energy systems,” Renewable and Sustainable Energy Reviews, vol. 50, pp. 755–769, 2015, https://doi.org/10.1016/j.rser.2015.05.040.
- B. Utomo, J. Darkwa, D. Du, and M. Worall, “Solar photovoltaic cooling and power enhancement systems: A review,” Renewable and Sustainable Energy Reviews, vol. 216, p. 115644, 2025, https://doi.org/10.1016/j.rser.2025.115644.
- Y. Zhao et al., “Experimental and numerical investigation of spray cooling based photovoltaic/thermal system: Achieving high performance, low cost, and lightweight design,” Energy, vol. 323, 2025, https://doi.org/10.1016/j.energy.2025.135671.
- Asri, Y. Away, Nasaruddin, I. Devi Sara, and A. Novandri, “Enhancement of Photovoltaic Performance With Coolant Calcium Chloride: Experimental and Predictive Modeling,” IEEE Access, vol. 12, pp. 112839–112851, 2024, https://doi.org/10.1109/ACCESS.2024.3443695.
- Z. Arifin, S. D. Prasetyo, B. A. Tribhuwana, D. D. D. P. Tjahjana, R. A. Rachmanto, and B. Kristiawan, “Photovoltaic Performance Improvement with Phase Change Material Cooling Treatment,” International Journal of Heat and Technology, vol. 40, no. 4, pp. 953–960, 2022, https://doi.org/10.18280/ijht.400412.
- C. H. B. Apribowo and A. Habibie, “Experimental Method for Improving Efficiency on Photovoltaic Cell Using Passive Cooling and Floating Method,” ICEVT 2019 - Proceeding: 6th International Conference on Electric Vehicular Technology 2019, pp. 272–275, 2019, https://doi.org/10.1109/ICEVT48285.2019.8993960.
- C. H. B. Apribowo, A. Habibie, Z. Arifin, and F. Adriyanto, “Experimental method for improving efficiency on photovoltaic cell with using floating installation method,” AIP Conf Proc, vol. 2217, no. 1, p. 30190, 2020, https://doi.org/10.1063/5.0000827.
- B. A. Chico Hermanu, B. Santoso, Suyitno, and F. X. R. Wicaksono, “Design of 1 MWp floating solar photovoltaic (FSPV) power plant in Indonesia,” AIPC, vol. 2097, no. 1, p. 30013, 2019, https://doi.org/10.1063/1.5098188.
- N. Mir-Nasiri and M. H. Ali, “Small scale sun tracking power plant,” 2016 5th International Conference on Informatics, Electronics and Vision, ICIEV 2016, pp. 281–286, 2016, https://doi.org/10.1109/ICIEV.2016.7760011.
- H. M. Fahad, A. Islam, M. Islam, M. F. Hasan, W. F. Brishty, and M. M. Rahman, “Comparative analysis of dual and single axis solar tracking system considering cloud cover,” International Conference on Energy and Power Engineering: Power for Progress, ICEPE 2019, no. c, pp. 1–5, 2019, https://doi.org/10.1109/CEPE.2019.8726646.
- G. C. Lazaroiu, M. Longo, M. Roscia, and M. Pagano, “Comparative analysis of fixed and sun tracking low power PV systems considering energy consumption,” Energy Convers Manag, vol. 92, pp. 143–148, 2015, https://doi.org/10.1016/j.enconman.2014.12.046.
- Y. S. Bijjargi, S. S. Kale, and K. A. Shaikh, “Cooling techniques for photovoltaic module for improving its conversion efficiency: A review,” International Journal of Mechanical Engineering and Technology, vol. 7, no. 4, pp. 22–28, 2016, https://iaeme.com/Home/article_id/IJMET_07_04_003.
- K. Rishi, M. Balachandran, G. Raagul, A. Srinivasagopalan, B. Ramkiran, and P. Neelamegam, “Solar Cooling Technologies-A Review,” 7th IEEE International Conference on Computation of Power, Energy, Information and Communication, ICCPEIC 2018, pp. 174–178, 2018, https://doi.org/10.1109/ICCPEIC.2018.8525162.
- S. Ouédraogo, G. A. Faggianelli, G. Pigelet, G. Notton, and J. L. Duchaud, “Performances of energy management strategies for a Photovoltaic/Battery microgrid considering battery degradation,” Solar Energy, vol. 230, no. August, pp. 654–665, 2021, https://doi.org/10.1016/j.solener.2021.10.067.
- M. Bortolini, M. Gamberi, and A. Graziani, “Technical and economic design of photovoltaic and battery energy storage system,” Energy Convers Manag, vol. 86, pp. 81–92, Oct. 2014, https://doi.org/10.1016/J.ENCONMAN.2014.04.089.
- L. Deotti, W. Guedes, B. Dias, and T. Soares, “Technical and economic analysis of battery storage for residential solar photovoltaic systems in the Brazilian regulatory context,” Energies (Basel), vol. 13, no. 24, 2020, https://doi.org/10.3390/en13246517.
- S. Kalaiselvan, V. Karthikeyan, G. Rajesh, A. Sethu Kumaran, B. Ramkiran, and P. Neelamegam, “Solar PV Active and Passive Cooling Technologies-A Review,” 7th IEEE International Conference on Computation of Power, Energy, Information and Communication, ICCPEIC 2018, pp. 166–169, 2018, https://doi.org/10.1109/ICCPEIC.2018.8525185.
- S. A. Marathe and B. P. Patil, “Mechanisms for Improving the Productivity of the Existing Photovoltaic Panels: A Review,” 2020 International Conference on Computational Performance Evaluation, ComPE 2020, pp. 87–90, 2020, https://doi.org/10.1109/ComPE49325.2020.9200005.
- H. Shin and J. H. Roh, “Framework for Sizing of Energy Storage System Supplementing Photovoltaic Generation in Consideration of Battery Degradation,” IEEE Access, vol. 8, pp. 60246–60258, 2020, https://doi.org/10.1109/ACCESS.2020.2977985.
- B. Celik, S. Suryanarayanan, R. Roche, and T. M. Hansen, “Quantifying the Impact of Solar Photovoltaic and Energy Storage Assets on the Performance of a Residential Energy Aggregator,” IEEE Trans Sustain Energy, vol. 11, no. 1, pp. 405–414, 2020, https://doi.org/10.1109/TSTE.2019.2892603.
- Z. M. Alaas, "The Effects of Temperature on Photovoltaic and Different Mitigation Techniques: A Review," in IEEE Access, vol. 12, pp. 180309-180327, 2024, https://doi.org/10.1109/ACCESS.2024.3504009.
- J. Siecker, K. Kusakana, and B. P. Numbi, “A review of solar photovoltaic systems cooling technologies,” Renewable and Sustainable Energy Reviews, vol. 79, no. May, pp. 192–203, 2017, https://doi.org/10.1016/j.rser.2017.05.053.
- M. J. Fadhil, R. A. Fayadh, and M. K. Wali, “Design and implementation of smart electronic solar tracker based on Arduino,” Telkomnika (Telecommunication Computing Electronics and Control), vol. 17, no. 5, pp. 2486–2496, 2019, https://doi.org/10.12928/TELKOMNIKA.v17i5.10912.
- M. Jamaluddin, R. A. Rachmanto, S. Hadi, C. H. B. Apribowo, Trismawati, and Z. Arifin, “The effect of fins number variation on aluminum heat sink to the photovoltaic performance,” In Proceedings of the 6th International Conference and Exhibition on Sustainable Energy and Advanced Materials: ICE-SEAM 2019, 16—17 October 2019, pp. 449-459, 2020, https://doi.org/10.1007/978-981-15-4481-1_43.
- S. A. Zubeer, H. A. Mohammed, and M. Ilkan, “A review of photovoltaic cells cooling techniques,” E3S Web of Conferences, vol. 22, 2017, https://doi.org/10.1051/e3sconf/20172200205.
- E. Cuce, T. Bali, and S. A. Sekucoglu, “Effects of passive cooling on performance of silicon photovoltaic cells,” International Journal of Low-Carbon Technologies, vol. 6, no. 4, pp. 299–308, 2011, https://doi.org/10.1093/ijlct/ctr018.
- D. Pradeep, A. N V, D. B N, M. Jay, and S. C. N. Shetty, “Improving the efficiency of a solar PV panel’s power generation by using a Dual-Axis tracker with a Cooling system,” 2023 IEEE International Conference on Distributed Computing, VLSI, Electrical Circuits and Robotics (DISCOVER), pp. 101–104, 2023, https://doi.org/10.1109/discover58830.2023.10316713.
- N. Reza and N. Mondol, “Design and implementation of an automatic single axis tracking with water-cooling system to improve the performance of solar photovoltaic panel,” 2021 International Conference on Automation, Control and Mechatronics for Industry 4.0, ACMI 2021, vol. 0, no. July, pp. 1–6, 2021, https://doi.org/10.1109/ACMI53878.2021.9528189.
- A. Singh, S. Adhav, A. Dalvi, A. Chippa, and M. Rane, “Arduino based Dual Axis Solar Tracker,” Proceedings of the 2nd International Conference on Artificial Intelligence and Smart Energy, ICAIS 2022, no. 5, pp. 1789–1793, 2022, https://doi.org/10.1109/ICAIS53314.2022.9742876.
- H. A. Kazem, M. T. Chaichan, A. H. A. Al-Waeli, and K. Sopian, “Recent advancements in solar photovoltaic tracking systems: An in-depth review of technologies, performance metrics, and future trends,” Solar Energy, vol. 282, p. 112946, 2024, https://doi.org/10.1016/j.solener.2024.112946.
- Budiyanto and Fadliondi, “The improvement of solar cell output power using cooling and reflection from mirror,” International Journal of Power Electronics and Drive Systems, vol. 8, no. 3, pp. 1320–1326, 2017, https://doi.org/10.11591/ijpeds.v8i3.pp1320-1326.
- M. Becker. Heat transfer: a modern approach. Springer Science & Business Media. 2012. https://books.google.co.id/books?hl=id&lr=&id=rGrSBwAAQBAJ.
- M. H. Aksoy and M. Ispir, “Techno-Economic Feasibility of Different Photovoltaic Technologies,” Applied Engineering Letters, vol. 8, no. 1, pp. 1–9, 2023, https://doi.org/10.18485/aeletters.2023.8.1.1.
- S. A. Zubeer, H. A. Mohammed, and M. Ilkan, “A review of photovoltaic cells cooling techniques,” In E3S web of conferences, vol. 22, p. 00205, 2017, https://doi.org/10.1051/e3sconf/20172200205.
- N. A. Handayani and D. Ariyanti, “Potency of solar energy applications in Indonesia,” International Journal of Renewable Energy Development, vol. 1, no. 2, pp. 33–38, 2012, https://doi.org/10.14710/ijred.1.2.33-38.
AUTHOR BIOGRAPHY
Chico Hermanu Brillianto Apribowo obtained his bachelor's degree in Electrical Engineering from the Institut Teknologi Sepuluh Nopember (ITS), Indonesia. He earned his master's and doctoral degrees in Electrical Engineering and Information Technology from Universitas Gadjah Mada (UGM), Indonesia. He is currently a lecturer in the Department of Electrical Engineering at Universitas Sebelas Maret, Indonesia. His research interests include power system operation and planning, artificial intelligence and optimization techniques, uncertainties in modern power systems, power electronics and control, smart grids, microgrids, renewable energy systems, energy storage systems, energy transition and sustainability, and electric vehicles. Email: chico@staff.uns.ac.id |
|
Wiwik Nur Winda Student in the Department of Electrical Engineering, Universitas Sebelas Maret, Surakarta, Indonesia Email: wiwiknurwinda@gmail.com |
|
Hari Maghfiroh obtained his bachelor’s and master’s degree from the Department of Electrical Engineering and Information Technology, Universitas Gadjah Mada, Indonesia in 2013 and 2014. He also joints a double degree master program at the National Taiwan University of Science and Technology in 2014. He is currently a lecturer in the Department of Electrical Engineering, Sebelas Maret University, Indonesia. His research interests involve control systems, electric vehicles, and railway systems. Email: hari.maghfiroh@staff.uns.ac.id |
|
Irwan Iftadi Lecturer in the Department of Electrical Engineering, Universitas Sebelas Maret, Surakarta, Indonesia. Email: irwaniftadi@staff.uns.ac.id |
|
Muhammad Ahmad Baballe is a notable academic affiliated with the Nigerian Defence Academy Kaduna in Nigeria, where he has contributed to the field of computer engineering. His research primarily focuses on innovative security systems and detection technologies, reflecting a commitment to enhancing safety and efficiency in various applications. Lecturer in the Department of Mechatronics Engineering, Nigerian Defence Academy, Kaduna, Nigeria. Email: mb.ahmad@nda.edu.ng |
Buletin Ilmiah Sarjana Teknik Elektro, Vol. 7, No. 2, June 2025, pp. 147-157