ISSN: 2685-9572 Buletin Ilmiah Sarjana Teknik Elektro
Improved Black Widow for Optimal Distributed Generation Placement in Radial Distribution Networks
Oladepo Olatunde 1, Egeruo Sochima 2
1 Department of Electrical and Electronic Engineering, Osun State University, Osogbo, Nigeria
2 Transmission Company of Nigeria, National Control Centre, Osogbo, Osun State, Nigeria
ARTICLE INFORMATION |
| ABSTRACT |
Article History: Received 25 February 2025 Revised 13 May 2025 Accepted 21 May 2025 |
| 
Mitigating active and reactive power losses and improving voltage profiles in radial distribution networks remain critical challenges for system operators. While the introduction of Distributed Generation offers a promising solution, determining their optimal placement and sizing is a complex problem. Metaheuristic algorithms, though effective, have seen limited application in addressing issues specific to radial feeders, where traditional analytical methods dominate. This paper presents an Improved Black Widow Optimization Algorithm to improve Distributed Generation location and proper sizing in radial distribution networks. The Improved Black Widow Optimization Algorithm incorporates a non-linear inertia weight adjustment to enhance the balance between diverse exploration and focused exploitation, addressing a key limitation of the standard Black Widow Optimization. A backward-forward sweep algorithm is used to calculate the initial losses and voltage profile of the test systems, while the Improved Black Widow Optimization Algorithm determines optimal Distributed Generation parameters. The proposed method is tested on the IEEE 33-bus system and validated on a Nigerian 32-bus 11kV distribution feeder using MATLAB. Results demonstrate that the Improved Black Widow Optimization Algorithm reduces power losses by 49.49% and improves voltage profiles by 85.64% on the IEEE system, outperforming the standard Black Widow Optimization Algorithm (44.81% loss reduction, 84.64% voltage improvement). On the Nigerian network, the Improved Black Widow Optimization Algorithm achieves a 52.86% loss reduction and 92.22% voltage improvement, compared to 25.98% and 79.04% with the Black Widow Optimization Algorithm. These improvements translate to enhanced energy efficiency, reduced technical losses, and better voltage stability, confirming the superior performance of the Improved Black Widow Optimization Algorithm in addressing radial distribution network challenges. |
Keywords: Distributed Generation; Metaheuristic Algorithms; Radial Distribution Networks; Voltage Profile Improvement; Non-Linear Inertia Weight; Optimization |
Corresponding Author: Egeruo Sochima, Transmission Company of Nigeria, National Control Centre, Osogbo, Osun State, Nigeria. Email: sochima.egeruo@gmail.com |
This work is open access under a Creative Commons Attribution-Share Alike 4.0 
|
Document Citation: O. Olatunde and E. Sochima, “Improved Black Widow for Optimal Distributed Generation Placement in Radial Distribution Networks,” Buletin Ilmiah Sarjana Teknik Elektro, vol. 7, no. 2, pp. 181-194, 2025, DOI: 10.12928/biste.v7i2.12954. |
- INTRODUCTION
Technological advancement and advanced industrialization have significantly created a huge electricity demand worldwide. Unfortunately, conventional energy sources are insufficient to cater for the increased demand because they are not environmentally or economically supportive [1]. Integrating renewable energy sources (RES) into distribution networks has gained significant traction across numerous countries as a strategy to reduce reliance on fossil energy, which significantly contributes to reducing greenhouse gas emissions. Given its crucial role in mitigating climate change, RES is often highlighted among the top global advancements to combat the adverse effects of rising temperatures [2]. Unlike conventional energy sources, it does not emit greenhouse gases such as carbon dioxide, which drive global warming. Recent projections indicate that by 2050, RES will account for approximately 85% of global electricity generation, with only 15% derived from non-renewable sources [3]. Examples of RES include solar photovoltaic generation (SPVG), battery energy storage systems (BESS), wind turbines (WT), and various natural sources that have been used as a substitute to provide electricity generation for the last decade or more. Also, reducing the abundance of fossil fuels and global warming has forced utilities to rely more on RES. SPVG has proven to be a reliable RES, and it has been successfully incorporated into various radial distribution networks (RDN) primarily because of its pristine energy source, cheaper operating cost, and availability [4].
The RDN in the majority of the developing countries, like Nigeria, is often radial in design, for operational simplicity. Power from centralized generating stations is sent through the transmission network down to the distribution substations. The distribution substation supplies electrical power to the end consumers through a passive network. The substation serves as the sole point of feeding for the RDN. The power flow in RDN is hence unidirectional. However, due to a variety of factors, a significant amount of the generated electricity is lost [5]. Large voltage drops, poor voltage stability, and substantial power losses are caused by distribution lines with high impedance ratios [6][7]. For an effective and reliable power system operation, Optimal placement and proper sizing of RES is very important as it would provide relief for the conventional energy sources. Effective integration of RES into any network, whether distribution or transmission, especially close to the load centers, will greatly mitigate system losses, improve the power factor, and improve the voltage profile of the system concerned. Practically, the SPVG and WT should be installed, particularly where their respective energy sources are abundant [8].
It is also important to note that integrating RES to RDN would have its challenges, especially regarding the basic protective systems structure and design. Hence, ensuring the voltage levels are within the desired limits can pose a serious challenge. Therefore, it is important to carry out a detailed investigation on the entire protective system before RES is integrated into the RDN to avoid a total failure of these systems. Due to these issues, it is recommended that there should be a threshold of RES penetration at every interconnection point of the RES [9].
The significant power loss and weak voltage profile problems in radial distribution systems are the other factors that motivate researchers to further investigate possible solutions [10]. Nowadays, meta-heuristic algorithm techniques have been deployed to ascertain the sizes and connection points of RES in RDN. In [8] The Grid-Oriented Multi-objective Harmony Search Algorithm (GOMOHSA) was used for optimal deployment of RES, and the study was performed using MATLAB software for the loading scenario of the base year 2021 and projected year 2031 in the southern parts of Rajasthan state of India. The Objective function was tailored to minimize total reactive power loss, total voltage deviation, and total active power loss. The recommended capacity of the RES is 80MW, 175MW, and 175MW on the nodes 63, 51, and 25, respectively, of the test bus system, and this was benchmarked with the Genetic Algorithm (GA) and was found to be better, however the GOMOHSA is found to have a slow convergence rate. [11] used the Garra Rufa Optimization method (GRO) for their study. The IEEE 14 and 30 standard bus test systems were used in this case to validate the result and benchmarked with Particle Swarm Optimization (PSO) and GA. The proposed strategy decreased the real power losses of the IEEE-14 bus test system, and the GRO increased the peak permissible voltage stability index of the IEEE-30 bus test system by 857%, however, GRO's optimization process can be time-consuming and computationally intensive, especially when dealing with complex problems or large-scale systems. Assen in his work [12] used a hybrid approach of Grey Wolf Optimizer (GWO) and Particle Swarm Optimization (PSO) algorithms. A multi-objective function was formulated which includes real–reactive power loss minimization and voltage profile improvement. The hybrid algorithm was tested on a practical bus in Ethiopia called the DILLA distribution system. Four scenarios of distributed generation (DG) penetration were tested, which are: Scenario 1: One DG integration; Scenario 2: Two DG integrations; Scenario 3: Three DG integrations; Scenario 4: Four DG integrations. The results from the hybrid solution were compared with GWO, PSO, Sine Cosine Algorithm (SCA), and Whale Optimization Algorithm (WOA). The three DG integrations gave the best result while using the proposed method. 58.1175% real and 58.2189% reactive power loss reduction was achieved, while the maximum voltage deviation is 2.1739%. Also, the proposed hybrid method outperformed other methods. In [13] A modified particle swarm optimization (MPSO) was used in which a novel inertia term was introduced in the velocity update equation, which helps to improve the algorithm's ability to find optimal solutions by reducing the redundancy of particle velocity in each iteration. The algorithm, however, gets trapped in the local minima, which is a common problem with particle swarm optimization.
Most studies in the open literature focus on comparing one algorithm with others, rather than improving existing algorithms to achieve better results. In this work, the standard Black Widow Optimization Algorithm (BWOA) was improved by integrating a Non-Linear Inertia Weight Adjustment to improve its performance. It is defined by a cosine-sine hybrid function, to improve the convergence behavior of the standard Black Widow Optimization algorithm. It starts by encouraging global exploration through a high inertia weight and gradually transitions to local exploitation. The cosine part introduces a decaying trend, while the sine-square-root component smoothens the exploration-exploitation trade-off, resulting in better balance and improved solution quality over iterations. The improved algorithm was applied to the IEEE 33-bus system for optimization and validated on an 11 kV distribution network. Its effectiveness was evaluated by comparing the results with those of the standard BWOA algorithm.
The research contributions are stated as follows:
- Developing an Improved Black Widow Optimization algorithm (IBWOA) by embedding a non-linear inertia weight adjustment to enhance the balance between extensive exploration and localized refinement.
- The fitness function's optimal weights (
 and
and  ) were identified through experimental testing, providing a practical method for balancing power loss and voltage deviation in optimization problems.
The remaining part of this work is organized as follows: The modeling of the renewable energy sources, which includes; SPVG and BESS are explained in section 2 also, the implementation of the BWOA and IBWOA in conjunction with the optimal weight selection for the fitness function are also explained in the same section. Section 3 details the model simulation result while the conclusion is detailed in section 4.
- METHODS
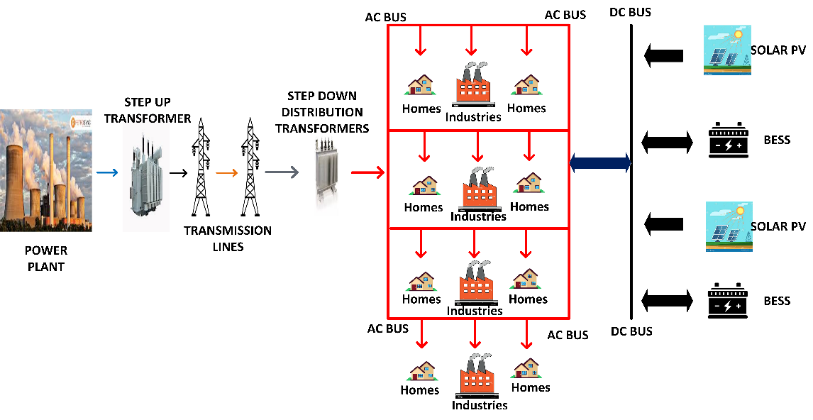
The optimization technique presented in this study was first validated on an IEEE 33-bus radial feeder, thereafter, it was also tested using a Nigerian 11kV feeder as a case study. Figure 1 shows the concept of the proposed work, which depicts how power is transferred from the generation plants down to the customers while the RES is integrated at the distribution end. The maximum load recorded on the Nigerian 11kV feeder is 3.43MW and 2.76MVAr, and this feeder covers a relatively large geographical area. So many commercial activities that involve industrial loads and also residential facilities connected to the feeder have caused it to experience real power losses, incessant outages, and voltage deviation, which makes it important for it to be investigated and a solution provided. The integration of SPVG and BESS into the distribution network was strategically chosen due to their complementary roles in enhancing grid stability and reliability. SPVG alone is inherently intermittent, as its output fluctuates with changes in sunlight intensity due to weather conditions and time of day [14]. To address this limitation, the BESS plays a critical role as a power reserve. Charging and discharging the BESS during off-peak periods and peak periods respectively, can reduce the peak demand on the power grid [15]. It smartly compensates for the variability and unpredictability of SPVG output, ensuring a steady power supply.

Figure 1. Conceptual Diagram of Power Flow with RES Integration
Black Widow Optimization Algorithm
The BWOA is a meta-heuristic nature-inspired algorithm that is influenced by the natural life cycle and reproductive manner of black widow spiders [16]. It specifically simulates the phases of giving birth, cannibalism, and mutation, making it unique compared to other optimization approaches. The algorithm effectively mitigates the issue of untimely convergence and attains better-optimized fitness values than competing algorithms [16]. In GA and PSO terms, this structure is termed ‘‘Chromosome’’ and ‘‘Particle position’’, respectively, but in BWOA it is called ‘‘widow’’. In BWOA, each black widow spider is considered a potential solution to each problem. Also, the problem variables are represented by each Black Widow [17]. The BWOA was chosen over traditional algorithms such as Genetic Algorithm (GA) and Particle Swarm Optimization (PSO) because it has a superior performance in terms of balancing between exploration and exploitation, faster convergence, and reduced parameter dependency. Unlike GA, which may suffer from premature convergence and often requires many genetic operators, BWOA employs a more aggressive selective pressure through its unique cannibalism and reproduction mechanisms, enhancing diversity without excessive complexity. Compared to PSO, which can easily get trapped in local optima, BWOA's dynamic control strategy allows it to escape such traps more effectively, especially in high-dimensional or complex search spaces. These characteristics make BWOA more suitable for the problem domain addressed in this study, where solution diversity and convergence stability are critical.
Initialization Stage
Within a defined solution space, the first group of spiders is generated randomly. Each spider Si represents a prospective solution as shown in Eq. (1). where LB = lower boundary, UB = upper boundary. This stage ensures there is a wide range of starting points for the optimization process.
| 
| (1) |
Reproduction Stage
As the pairs function independently of each other, they begin to mate to generate offspring. The offspring are produced in parallel since each pair mates within its web separately. The offspring  is represented in Eq. (2), where
  is a random weight.
  and
and  are parent solutions.
| 
| (2) |
Cannibalism Stage
This eliminates the weaker solutions, ensuring the survival of the stronger ones. The weaker offspring are removed after the fitness test has been performed. Eq. (3) shows the operation. Where represents the stronger offspring solution from the current generation and  represents the weaker offspring solution being compared to .
| 
| (3) |
Mutation Stage
To enhance diversity and avoid local optima, some solutions undergo mutation. A mutated solution  is given in Eq. (4).
  controls the mutation rate while the random factor introduces variability, promoting global exploration.
| 
| (4) |
Convergence
Similar to other algorithms, we can take into account three termination conditions:
- A pre-determined count of iterations.
- Constant result obtained for fitness value of the best black widow spider for multiple iterations.
- Achieving the desired accuracy level.
In black widow optimization, the best widow indicates the Supreme fitness function. In this study, 200 iterations were executed. The rates used for procreation, cannibalism and mutation are 0.4, 0.6, and 0.2, respectively.
Improvement Strategy Employed on the BWOA
In balancing the equilibrium between local and global search capabilities in any algorithm, Inertia weight plays an essential role. The proposed nonlinear inertia weight aids and fine-tunes the search process while adapting to changes over time [18]. The formula used to calculate the weight is given in Eq. (5) as:
| 
| (5) |
The proposed nonlinear weight adjustment mechanism combines a cosine-based decay with a sine-driven oscillation and a square root component. Initially, the cosine term starts at 1 (when ite = 0) and gradually decays to 0 by the final iteration (ite = Num_ite), mimicking traditional inertia weight decay. Simultaneously, the sine component begins at 0 and increases with oscillatory behavior, introducing dynamic fluctuations. The square root function modulates the growth rate early on—slowing it down to encourage broader exploration—while facilitating a gradual shift toward convergence in later stages. This hybrid structure produces a wave-like, non-linear adjustment curve that strategically balances exploration and exploitation over time. Figure 2 illustrates the nonlinear weight adaptation curve designed for the IBWOA, capturing this behavior. Additionally, the procedural steps of the IBWOA are depicted in Figure 3, which presents the algorithm's flowchart.
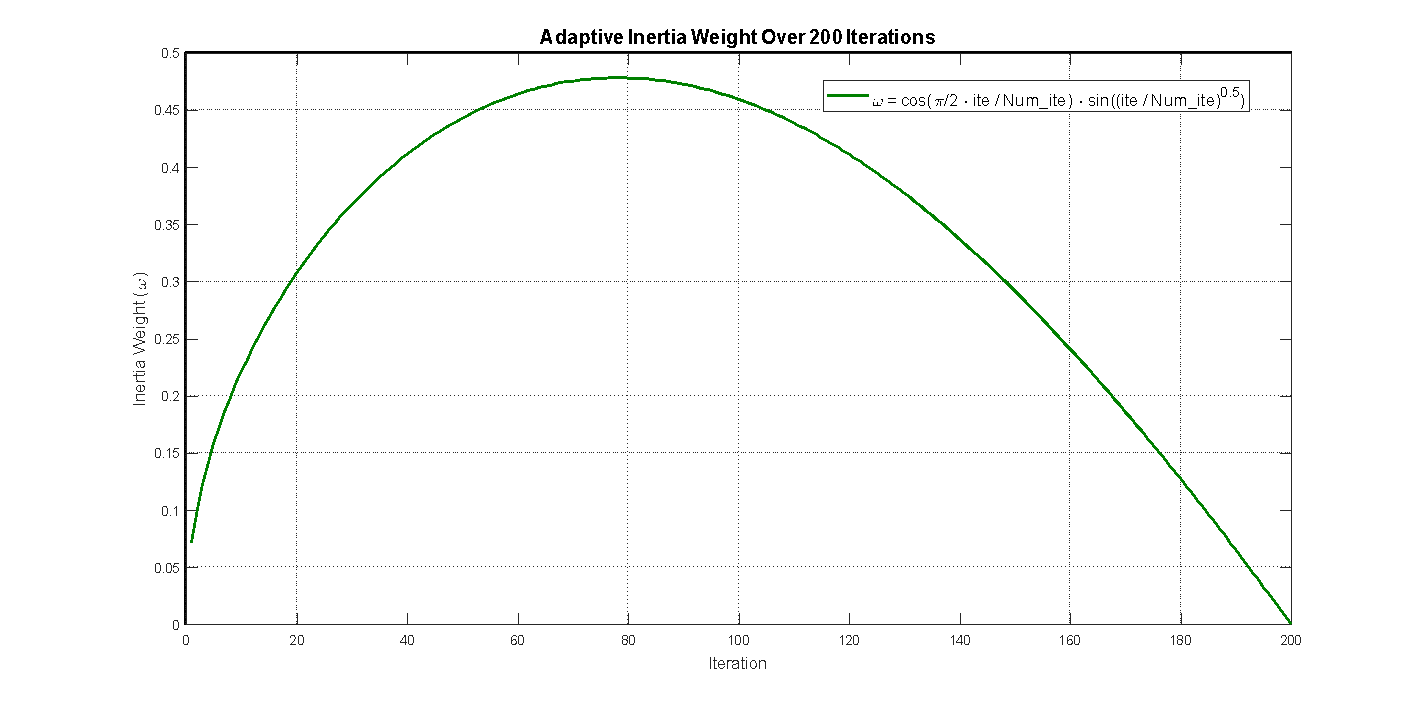
Figure 2. Nonlinear Inertia Weight Curve for the IBWOA
The Procedure for the IBWOA
Improved Black Widow Optimization Algorithm (IBWOA) with Nonlinear Inertia Weight
Input:
- Population size (pop_size), Minimum bus (bus_min), Maximum bus (bus_max), Minimum DG size (min_DG), Maximum DG size (max_DG), Reproduction rate (rep_rate), Mutation rate (mut_rate), Cannibalism rate (can_rate), Maximum iterations (max_Iter), Objective function (evaluate_fitness), Base value (Sbase).
Output:
- Best fitness (fitness), Best solution (population).
Procedure:
- Step 1: The problem statement is initialized. The objective function shown in section 2.4 is a cascaded function that employs the weighted sum method, which minimizes the power loss and voltage variance of the system. Decision variables, which are the sizing and location of the PV/BESS, and system constraints, which have been defined in section 2.4.1, are all well-defined.
- Step 2: Import the Line and bus data of the IEEE 33-bus and Nigerian 32-bus distribution systems.
- Step 3: Run the load flow using the backward-forward sweep algorithm to obtain the results without the DG installation. The source bus is taken as the slack bus.
- Step 4: Initialize the IBWOA parameters. Here, the max_ite is set at 200, the pop_size is 150, the rep_rate is 0.4, the can_rate is 0.6 and mut_rate is 0.1. The bus_min, bus_max, min_DG, and max_DG are also set.
- Step 5: The initial population is generated by randomly assigning bus numbers for each individual and DG size also ensuring it is within the set limits.
- Step 6: The fitness of each solution in the population is assessed using the load flow method in Step 3, based on the objective function outlined in Step 1.
- Step 7: Record and store the best solution from the population based on the fitness level in Step 6.
- Step 8: For each iteration (Main Loop),
- Calculate the nonlinear weight adjustment using equation (5).
- The reproduction stage is implemented, which involves generating offspring between pairs of randomly selected parents and applying the nonlinear weight adjustment to them to ensure diversity.
- The mutation stage is implemented, which involves using the probability mut_rate to mutate randomly selected genes in the offspring and ensure all system constraints are met.
- The cannibalism stage is implemented, which involves removing the least fit offspring based on the can_rate.
- The population size is adjusted by adding top-performing individuals from the current population to maintain the population size
- The fitness level is recalculated for the updated population as Step 6.
- Check if the convergence criteria have been met and exit the loop.
- Step 9: The optimal solution is shown based on the fitness value. The IBWOA is implemented, which yields the size and location of the PV/BESS, and the minimized value of the power loss and voltage deviation is shown while also satisfying the system constraints.
The maximum iterations (max_ite = 200) ensure adequate search depth without excessive runtime. A population size of 150 maintains diversity for global search. The reproduction rate (rep_rate = 0.4) and cannibalism rate (can_rate = 0.6) provide a good balance between exploration and selective pressure. A mutation rate of 0.1 introduces controlled variability to avoid local optima.
Modelling of BESS and Photovoltaic
Battery Modelling
It takes a reasonable amount of time for the BESS discharge which could range between 1-10 hours, which implies that we can get an available capacity between 1 to 10 kWh for a system that has a power rating of 1 kW [19]. The BESS manages power deficits caused by demand fluctuations and SPVG variability. With SPVG's intermittent nature, the battery remains in charging mode, supplying power only during shortages. The state of charge (SOC) governs the battery operation, which changes as a function of the power injected or absorbed by the direct system in conjunction with its losses [20]. It is shown in Eq. (6) as follows:
Where  is the state of charge of the battery at
  connected to the node
  ,
,  is the state of charge of the batter time
  connected to the node ,
  is the charging efficiency of the battery when connected to node (1/W),
 is the power the batter provides at node and at a time (W),
  is the battery’s power loss connected to the node and at the time (W),
  is the battery’s initial state of charge at the node .
  is the battery’s final state of charge at node .
For the BESS to function effectively, it must maintain regular constraints on energy storage, charging power and discharging power [21],
Where  and
and  is the maximum discharge and charge limits of the battery while,
  and
and  is the minimum and maximum Energy storage limits of the battery.
The BESS service life cycle and daily cycle can be calculated from [22] and [23] , respectively.
| 

| (8) |
Cycle Life = 3,000 cycles, Q, and D = 285 days, are the cycle count in the entire life span of a Li-on battery, the specific service life cycle in years, and the number of operating days of the BESS [19].
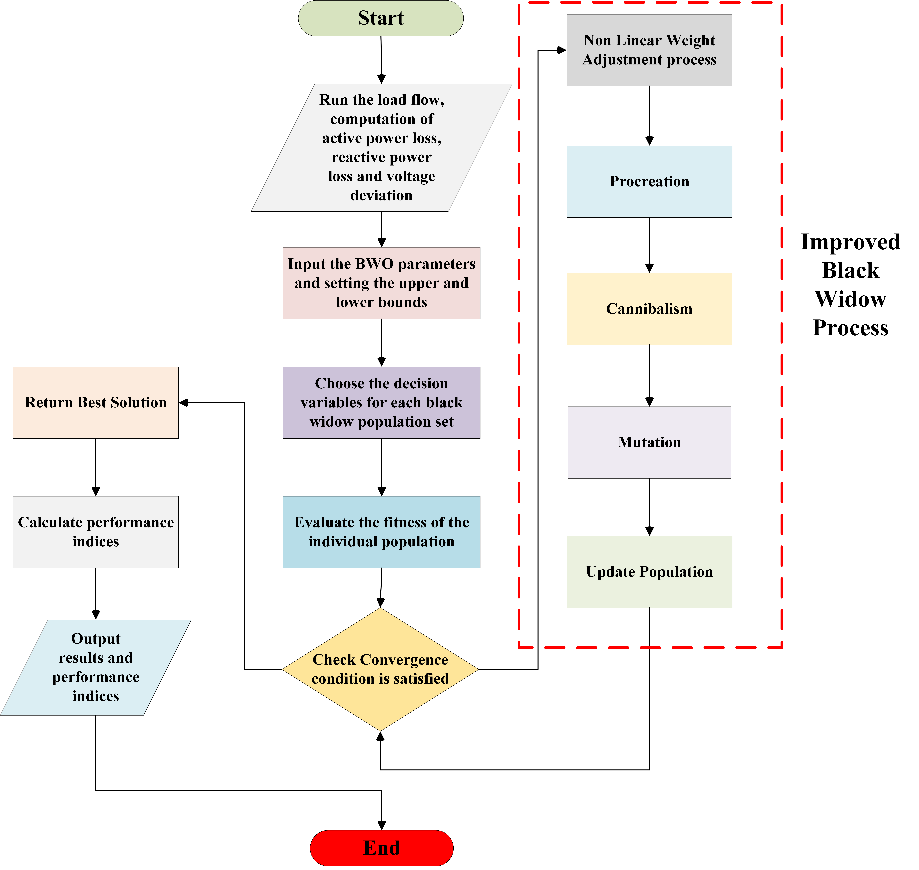
Figure 3. Flowchart of the Improved Black Widow Algorithm
Solar Photovoltaic Generation Modelling
Temperature and solar radiation are critical factors in SPVG power generation. Accurate modeling of solar radiation at a specific location is essential for reliable outcomes. By collecting and analyzing historical data of daily solar radiation, we determine the mean and standard deviation (SD) [14]. Each PV-based DG possesses a continuous probability distribution function (PDF) that is divided into states (periods). Also, the solar irradiance abides within stipulated limits in each of them. This is important to ensure that during the planning formation, each PV-based DG is accounted for as a multistate variable. Another way is to ensure several states of the solar irradiance for each time segment [24].
- Modelling of the Solar Radiation
The Beta PDF [25] represents the random nature of solar propagation. The equation is given as:
Where  is the Beta PDF of
  ,
, and
and  represents the Beta PDF’s shape rate and G represents gamma’s function [24]. The shape rates can be calculated using the mean and standard deviation with the formula (10). Where
  and
and  are the mean and standard deviation.
| 

| (10) |
- Power Generation from PV Arrays
The ambient temperature and solar radiation influence the PV array's power output [24]. Considering the mean solar radiation (Savm) for the mth state, the estimated PV power generated can be given as follows:
| 
| (11) |
Where  is the power output of the PV, Savm is defined as the mean solar radiation,
 is the number of solar panels, fill factor is represented by FF,
  and
and  is the voltage and current respectively.
The other components of the equation above can be derived as shown in [26]:
Where  (°C) represents the ambient temperature,
  stands for the maximum power tracking voltage, and
 stands for the maximum power tracking current.
  and
and  is the short-circuit current and open-circuit voltage of the PV module,
  and
and  represents the coefficients of temperature (A/°C and V/°C),
  represents the mth state temperature (°C) of the PV module.
Problem Formulation
Power loss reduction and Voltage profile improvement form the objective function of this study. The decision variables are the PV/BESS sizes and location.
- Loss minimization
The total real power losses on the feeder can be computed as [27]:
| 
| (13) |
Also, the cumulative reactive power losses can be calculated as [28]
| 
| (14) |
Where  and
and  are the two objective functions related to minimization of the system power loss,
  is the line current,
  is the ith line resistance, and nb denotes the branches in the system. The reduction of the percentage of total power loss can be computed as (Prasetyo et al, 2019) and [29].
| 
| (15) |
| 
| (16) |
- Voltage profile Improvement
The next objective focuses on enhancing the voltage profile of the RDN, expressed through the aggregate voltage variation index as follows formula (17):
| 
| (17) |
 is the ith bus voltage, Vref denotes the reference voltage and N is the number of the system bus.
- General Objective Function
The multi-objective function is transformed using the weighted sum method into a single-objective function (18). Where and are weighting factors.
| 
| (18) |
The weighted sum method is advantageous for its simplicity, especially when applied to convex problems. However, it has limitations, such as difficulty in exploring all solutions in non-convex spaces and the lack of a clear method for assigning objective weights [12]. Selecting appropriate weighting factors often relies on the system planner's experience and priorities. In this study, the primary focus is on minimizing real power loss, as it significantly affects utility profits, accounting for over 50% of losses and leading to customer dissatisfaction. Various weight combinations were tested, and the optimal one yielding the superior solution which minimized the objective function the best is presented in the results section.
System Constraint
The constraints associated with this study are categorized as follows:
- Equality Constraint
The under-listed constraints must be satisfied for the total generated power as given in [24], where the substation’s active and reactive power is denoted as  and
and  .
.  represents the total DG number, and M represents the aggregate line number in the system.
| 
| (19) |
| 
| (20) |
- Inequality Constraints
Voltage restrictions, the specific voltage requirements are as formula (21):
| 
| (21) |
The constraints associated with the power generated by the DG are as follows [30]:
| 
| (22) |
| 
| (23) |
 and
and  represents the minimum and maximum active power of the DG. Also,
  and
and  represents the minimum and maximum reactive power of the DG, respectively.
The branch capacity limitation is represented as formula (24):
| 
| (24) |
The limits associated with the power factor of the DG are as formula (25):
| 
| (25) |
- RESULTS AND DISCUSSION
As earlier stated, the key goal behind optimally positioning and sizing the RES is to reduce losses and strengthen voltage profiles on the radial distribution lines. Figure 4 and Figure 5 show the integration of the RES into the Nigerian 11kV feeder and IEEE 33-bus test distribution system respectively. The Nigerian 11kV feeder has a real power demand of about 3.43MW and 2.76MVAr while the base power is 100MVA and base voltage of 11kV. The IEEE 33-bus system delivers a real power is 3.72 MW and a reactive power is 2.3MVAr. The base power is 100MVA at 12.66kV. MATLAB was used for the simulation. Table 1 shows the results of the standard BWOA compared with the IBWOA implemented on the IEEE 33-bus system while Table 2 shows the same comparison implemented on the Nigerian 11kV feeder. A backward forward sweep algorithm was employed to run the load flow on both test systems and the base case power loss on the IEEE 33-bus system is 202.52kW and 136.98kVAr. The voltage deviation recorded was 1.7724. The voltage deviation means the deviation of the individual bus voltages from the nominal voltage of 1 p.u. On the Nigerian 11kV feeder, the same algorithm was employed to run the load flow studies and the base case power loss was 63.38kW and 40.65kVAr. The voltage deviation recorded was 1.5218.
On the IEEE 33-bus system (Table 1), the BWOA reduced the power loss by 84.64% with optimal location of the PV/BESS at bus 7 and 11 with a capacity of 1212kW and 2313kW. The IBWOA tested on the same system reduced the power loss by 85.64% with the optimal location of the PV/BESS at bus 9 and 30 with a capacity of 1594kW and 1519kW. The voltage profile improved by 84.64% using BWOA while it improved by 85.64% using IBWOA.
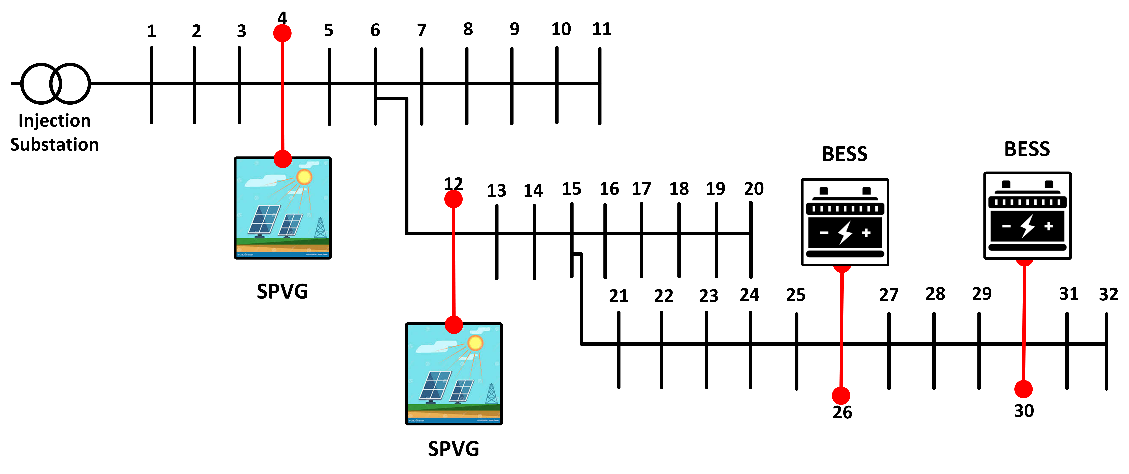
Figure 4. Nigerian 11kV feeder with RES integration
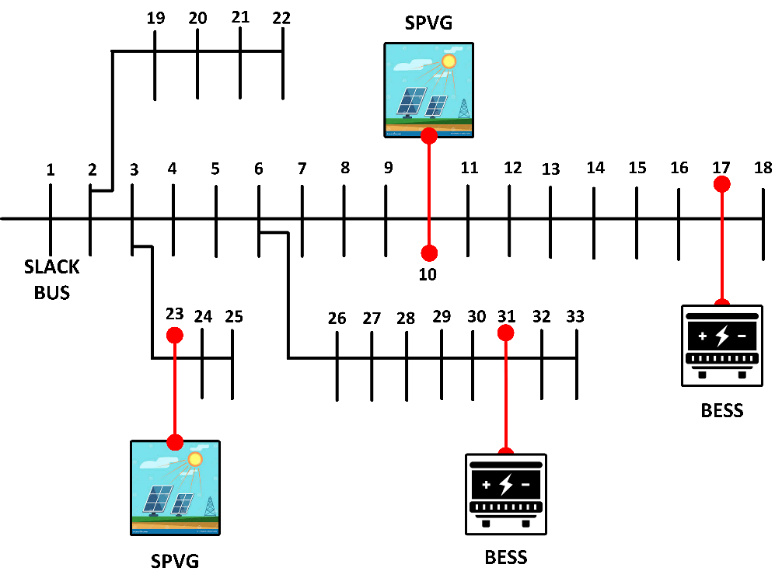
Figure 5. IEE 33-bus with RES integration
Table 1. Comparison of BWOA and IBWOA for IEEE 33-bus system
Item | Base Case | With RES Using BWOA | With RES Using IBWOA |
Power loss (kW) | 202.52 | 111.76 | 102.3 |
Loss reduction (%) | -- | 44.81 | 49.49 |
Min. voltage (pu) | 0.9048 | 0.9703 | 0.9796 |
Max. voltage (pu) | 0.9965 | 1.0056 | 1.0001 |
Node no | -- | 7 & 11 | 9 & 30 |
Power Factor | -- | Unity | Unity |
Size(kW) | -- | 1212kW & 2313kW | 1594kW & 1519kW |
Feeder voltage deviation (pu) | 1.7724 | 0.2722 | 0.2545 |
Voltage Improvement. (%) | -- | 84.64 | 85.64 |
On the Nigerian 11kV feeder system (Table 2), the BWOA reduced the power loss by 25.98% with the optimal location of the PV/BESS at bus 7 and 23 with a capacity of 673kW and 1271kW. The IBWOA tested on the same system reduced the power loss by 52.86% with the optimal location of the PV/BESS at bus 22 with a capacity of 1246kW. The voltage profile improved by 79.04% using BWOA while it improved by 92.22% using IBWOA. A better loss reduction improves the efficiency of the test systems. The voltage profiles for both methods on the different test systems are shown in Figure 6 and Figure 7.
The convergence behaviour of the standard BWOA is compared with the IBWOA, as illustrated in Figure 8. It is evident that IBWOA converges faster and reaches a better solution, demonstrating its efficiency in solving the RES placement problem. This improved performance can be attributed to the non-linear inertia weight mechanism, which enhances the balance between exploration and exploitation during the search process. While the IBWOA demonstrates superior convergence and solution quality, it incurs a moderately higher computational cost due to this added mechanism. However, this trade-off is justified by the algorithm’s increased accuracy and robustness, making it well-suited for real-world distribution planning applications where solution quality is critical. Figure 9 shows the hourly energy production curve of solar PV. It shows the average hourly solar power production over a day, peaking at midday and declining in the evening. It reflects how sunlight intensity and weather conditions affect solar energy generation. Figure 10 shows the absorption and release of the BESS energy over 24 hours. The battery charges during peak solar hours and discharges in the evening and night, ensuring a continuous power supply when solar generation is low.
Table 2. Comparison of BWOA and IBWOA for Nigerian 11kV Feeder
Item | Base Case | With RES Using BWOA | With RES Using IBWOA |
Power loss (kW) | 63.38 | 46.91 | 29.87 |
Loss reduction (%) | -- | 25.98 | 52.86 |
Min. voltage (pu) | 0.9275 | 1.003 | 0.9878 |
Max. voltage (pu) | 0.9989 | 1.02 | 1.005 |
Bus No for integration | -- | 7 & 23 | 22 |
Power Factor | -- | Unity | Unity |
Size(kW) | -- | 673kW & 1271kW | 1246Kw |
Feeder voltage deviation (pu) | 1.5218 | 0.319 | 0.1184 |
Voltage Improvement. (%) | -- | 79.04 | 92.22 |
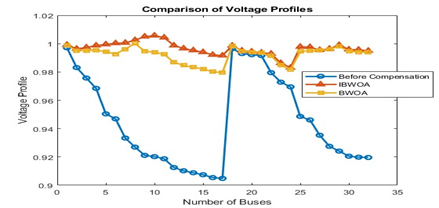
Figure 6. IEEE 33-bus Distribution system voltage profile for BWOA and IBWOA
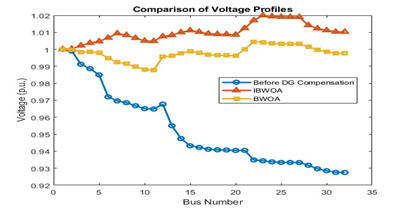
Figure 7. Nigerian 11kV Distribution system voltage profile for BWOA and IBWOA
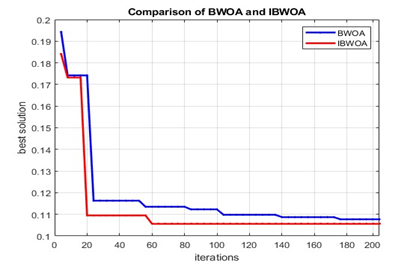
Figure 8. Convergence characteristics of BWOA and IBWOA
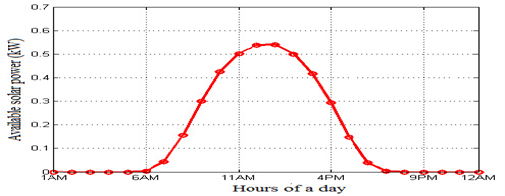
Figure 9. Hourly Output power of the Solar PV generation
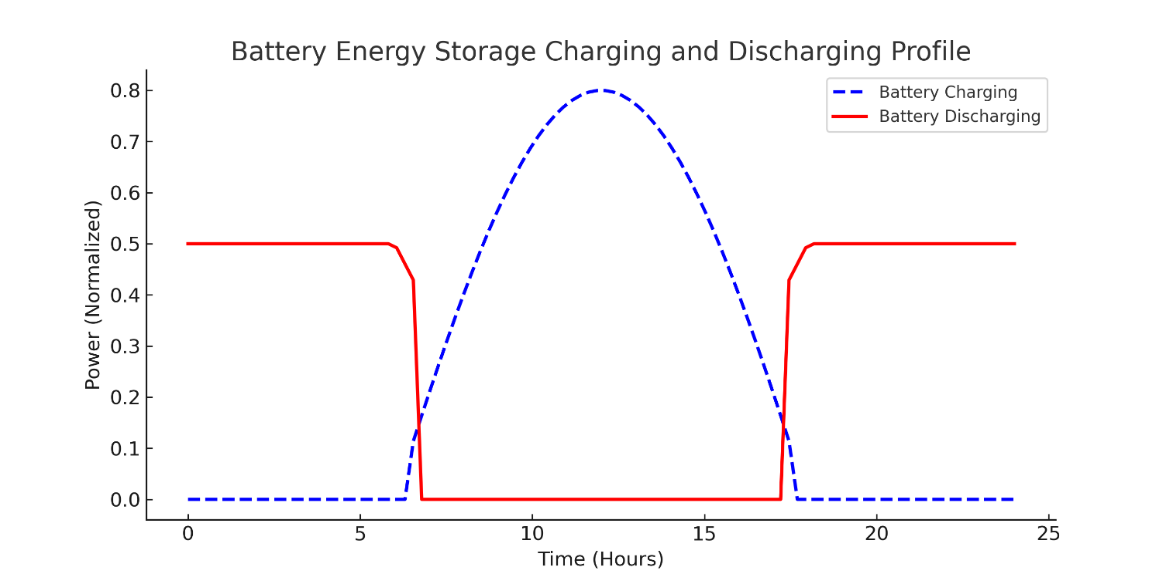
Figure 10. BESS Charging and Discharging Profile Over 24 Hours
- CONCLUSION
This paper introduced an Improved Black Widow Optimization Algorithm (IBWOA) to optimize DG placement and sizing in RDN. The proposed approach boosts the effectiveness of the standard Black Widow Optimization Algorithm (BWOA) by incorporating a non-linear inertia weight adjustment, which significantly improves the equilibrium between global search and local exploitation. This modification enables the improved approach to search more efficiently for optimal solutions and also avoids early convergence. The Backward-Forward Sweep load flow algorithm was used to accurately compute real power losses and voltage profiles, ensuring a comprehensive evaluation of the network’s performance. The effectiveness of IBWOA was tested on the IEEE 33-bus system and further validated on the Aiyetobi 32-bus 11 kV distribution feeder in Nigeria using MATLAB simulations. Results demonstrated that IBWOA achieved a 49.49% reduction in power losses and an 85.64% improvement in voltage profiles on the IEEE system, outperforming the conventional BWOA, which achieved a 44.81% loss reduction and an 84.64% voltage improvement. On the Nigerian network, IBWOA significantly reduced power losses by 52.86% and improved voltage profiles by 92.22%, compared to 25.98% and 79.04% achieved by BWOA. These findings confirm the superior performance of IBWOA in addressing key challenges associated with radial distribution networks, particularly in mitigating real power losses and improving voltage stability. By effectively determining the optimal RES placement and sizing, IBWOA contributes to improving the efficiency, reliability, and overall performance of distribution networks. Further research can look into the integration of dynamic load variations and other renewable energy sources, such as wind power, to assess IBWOA’s adaptability in real-time power distribution scenarios. Also, investigating the economic impacts of DG placement using IBWOA would provide deeper insights into its practical implementation.
REFERENCES
- M. H. Ali, S. Kamel, M. H. Hassan, M. Tostado-Véliz, and H. M. Zawbaa, “An improved wild horse optimization algorithm for reliability based optimal DG planning of radial distribution networks,” Energy Reports, vol. 8, pp. 582–604, 2022, https://doi.org/10.1016/j.egyr.2021.12.023.
- M. Ali Shaik, P. L. Mareddy, and N. Visali, “Enhancement of Voltage Profile in the Distribution system by Reconfiguring with DG placement using Equilibrium Optimizer: Enhancement of voltage profile in the distribution system,” Alexandria Engineering Journal, vol. 61, no. 5, pp. 4081–4093, 2022, https://doi.org/10.1016/j.aej.2021.09.063.
- M. Aref, V. Oboskalov, A. El-Shahat, and A. Y. Abdelaziz, “Modified Analytical Technique for Multi-Objective Optimal Placement of High-Level Renewable Energy Penetration Connected to Egyptian Power System,” Mathematics, vol. 11, no. 4, 2023, https://doi.org/10.3390/math11040958.
- S. Pemmada, N. R. Patne, A. D. Manchalwar, and R. Panigrahi, “A novel hybrid algorithm based optimal planning of solar PV and battery energy storage systems,” Energy Reports, vol. 9, pp. 380–387, 2023, https://doi.org/10.1016/j.egyr.2023.05.157.
- M. A. Aman et al., “Optimal Siting of Distributed Generation Unit in Power Distribution System considering Voltage Profile and Power Losses,” Math Probl Eng, vol. 2022, 2022, https://doi.org/10.1155/2022/5638407.
- M. A. Aman, S. Ahmad, J. Khan, N. F. Soliman, and M. E. Munir, “A Holistic Approach to Voltage Profile Improvement and Power Loss Mitigation through Distributed Generation Placement and Sizing,” 2023, https://doi.org/10.20944/preprints202309.1423.v1.
- N. Al Masood, A. Jawad, K. T. Ahmed, S. R. Islam, and M. A. Islam, “Optimal capacitor placement in northern region of Bangladesh transmission network for voltage profile improvement,” Energy Reports, vol. 9, pp. 1896–1909, 2023, https://doi.org/10.1016/j.egyr.2023.01.020.
- P. Kumar et al., “Optimal Sizing and Deployment of Renewable Energy Generators in Practical Transmission Network Using Grid-Oriented Multiobjective Harmony Search Algorithm for Loss Reduction and Voltage Profile Improvements,” International Transactions on Electrical Energy Systems, vol. 2023, 2023, https://doi.org/10.1155/2023/6315918.
- [9] A. Owosuhi, Y. Hamam, and J. Munda, “A New Framework for Active Loss Reduction and Voltage Profile Enhancement in a Distributed Generation-Dominated Radial Distribution Network,” Applied Sciences, vol. 14, no. 3, p. 1077, 2024, https://doi.org/10.3390/app14031077.
- Y. G. Werkie and H. A. Kefale, “Optimal allocation of multiple distributed generation units in power distribution networks for voltage profile improvement and power losses minimization,” Cogent Eng, vol. 9, no. 1, 2022, https://doi.org/10.1080/23311916.2022.2091668.
- R. K. Chillab, A. S. Jaber, M. Ben Smida, and A. Sakly, “Optimal DG Location and Sizing to Minimize Losses and Improve Voltage Profile Using Garra Rufa Optimization,” Sustainability (Switzerland), vol. 15, no. 2, 2023, https://doi.org/10.3390/su15021156.
- A. B. Alyu, A. O. Salau, B. Khan, and J. N. Eneh, “Hybrid GWO-PSO based optimal placement and sizing of multiple PV-DG units for power loss reduction and voltage profile improvement,” Sci Rep, vol. 13, no. 1, 2023, https://doi.org/10.1038/s41598-023-34057-3.
- M. J. Tahir, M. B. Rasheed, and M. K. Rahmat, “Optimal Placement of Capacitors in Radial Distribution Grids via Enhanced Modified Particle Swarm Optimization,” Energies (Basel), vol. 15, no. 7, 2022, https://doi.org/10.3390/en15072452.
- P. A. Juá Stecanella, D. Vieira, M. V. Leite Vasconcelos, and A. L. de Ferreira Filho, “Statistical analysis of photovoltaic distributed generation penetration impacts on a utility containing hundreds of feeders,” IEEE Access, vol. 8, pp. 175009–175019, 2020, https://doi.org/10.1109/ACCESS.2020.3024115.
- A. Inaolaji, X. Wu, R. Roychowdhury, and R. Smith, “Optimal Allocation of Battery Energy Storage Systems for Peak Shaving and Reliability Enhancement in Distribution Systems,” Journal of Energy Storage, vol. 95, p. 112305, 2024, https://doi.org/10.1016/j.est.2024.112305.
- X. Xu, “Enhancing Optimization Through Innovation: The Multi-Strategy Improved Black Widow Optimization Algorithm (MSBWOA),” arXiv preprint arXiv:2312.13395, 2023, https://doi.org/10.48550/arXiv.2312.13395.
- V. Hayyolalam and A. A. Pourhaji Kazem, “Black Widow Optimization Algorithm: A novel meta-heuristic approach for solving engineering optimization problems,” Eng Appl Artif Intell, vol. 87, 2020, https://doi.org/10.1016/j.engappai.2019.103249.
- H. Wang, J. Wang and Z. Li, "Research on Optimization of Grey Wolf Algorithm with Multiple Improved Strategies," 2023 4th International Conference on Big Data, Artificial Intelligence and Internet of Things Engineering (ICBAIE), pp. 70-75, 2023, https://doi.org/10.1109/ICBAIE59714.2023.10281240.
- N. Pompern, S. Premrudeepreechacharn, A. Siritaratiwat, and S. Khunkitti, “Optimal Placement and Capacity of Battery Energy Storage System in Distribution Networks Integrated With PV and EVs Using Metaheuristic Algorithms,” IEEE Access, vol. 11, pp. 68379–68394, 2023, https://doi.org/10.1109/ACCESS.2023.3291590.
- W. Gil-Gonzalez, O. D. Montoya, and J. C. Hernandez, “An Energy Management System for the Optimal Operation of BESS in DC Microgrids: A Robust Convex Programming Approach,” IEEE Access, vol. 11, pp. 38168–38181, 2023, https://doi.org/10.1109/ACCESS.2023.3267410.
- V. K. Thunuguntla et al., “A TOPSIS based multi-objective optimal deployment of solar PV and BESS units in power distribution system electric vehicles load demand,” Sci Rep, vol. 14, no. 1, p. 29688, 2024, https://doi.org/10.1038/s41598-024-79519-4.
- O. Babacan, W. Torre, and J. Kleissl, “Siting and sizing of distributed energy storage to mitigate voltage impact by solar PV in distribution systems,” Solar Energy, vol. 146, pp. 199–208, 2017, https://doi.org/10.1016/J.SOLENER.2017.02.047.
- C. K. Das, O. Bass, G. Kothapalli, T. S. Mahmoud, and D. Habibi, “Overview of energy storage systems in distribution networks: Placement, sizing, operation, and power quality,” Renewable and Sustainable Energy Reviews, vol. 91, pp. 1205–1230, 2018, https://doi.org/10.1016/J.RSER.2018.03.068.
- M. Khasanov, S. Kamel, F. Jurado, A. Kurbanov, and U. Jalilov, “Photovoltaic-based Distributed Generation Allocation in Distribution Network for Energy Loss Minimization,” in E3S Web of Conferences, vol. 434, p. 01015, 2023, https://doi.org/10.1051/e3sconf/202343401015.
- D. Q. Hung, N. Mithulananthan, and R. C. Bansal, “Integration of PV and BES units in commercial distribution systems considering energy loss and voltage stability,” Appl Energy, vol. 113, pp. 1162–1170, 2014, https://doi.org/10.1016/J.APENERGY.2013.08.069.
- M. Khasanov, S. Kamel, C. Rahmann, H. M. Hasanien, and A. Al-Durra, “Optimal distributed generation and battery energy storage units integration in distribution systems considering power generation uncertainty,” IET Generation, Transmission and Distribution, vol. 15, no. 24, pp. 3400–3422, 2021, https://doi.org/10.1049/gtd2.12230.
- R. Sirjani and A. Rezaee Jordehi, “Optimal placement and sizing of distribution static compensator (D-STATCOM) in electric distribution networks: A review,” Renewable and Sustainable Energy Reviews, vol. 77, pp. 688–694, 2017, https://doi.org/10.1016/J.RSER.2017.04.035.
- T. F. Agajie, A. O. Salau, E. A. Hailu, M. Sood, and S. Jain, “Optimal Sizing and Siting of Distributed Generators for Minimization of Power Losses and Voltage Deviation,” in Proceedings of IEEE International Conference on Signal Processing,Computing and Control, pp. 292–297, 2019, https://doi.org/10.1109/ISPCC48220.2019.8988401.
- M. I. Akbar, S. A. A. Kazmi, O. Alrumayh, Z. A. Khan, A. Altamimi, and M. M. Malik, “A Novel Hybrid Optimization-Based Algorithm for the Single and Multi-Objective Achievement with Optimal DG Allocations in Distribution Networks,” IEEE Access, vol. 10, pp. 25669–25687, 2022, https://doi.org/10.1109/ACCESS.2022.3155484.
- T. Wanjekeche, A. A. Ndapuka, and L. N. Mukena, “Strategic Sizing and Placement of Distributed Generation in Radial Distributed Networks Using Multiobjective PSO,” Journal of Energy, vol. 2023, pp. 1–14, 2023, https://doi.org/10.1155/2023/6678491.
Improved Black Widow for Optimal Distributed Generation Placement in Radial Distribution Networks (Oladepo Olatunde)