Buletin Ilmiah Sarjana Teknik Elektro ISSN: 2685-9572
Automatic Plant Disease Classification with Unknown Class Rejection using Siamese Networks
Rizal Kusuma Putra 1, Gusti Ahmad Fanshuri Alfarisy 2, Faizal Widya Nugraha 3,
Aninditya Anggari Nuryono 1
1 Department of Informatics, Institut Teknologi Kalimantan, Indonesia
2 School of Digital Science, Universiti Brunei Darussalam, Brunei Darussalam
3 Department of Advanced Industrial Science, Kumamoto University, Japan
ARTICLE INFORMATION |
| ABSTRACT |
Article History: Received 24 September 2024 Revised 08 October 2024 Published 27 November 2024
|
| 
Potatoes are one of the horticultural commodities with significant trade value both domestically and internationally. To produce high-quality potatoes, healthy and disease-free potato plants are essential. The most common diseases affecting potato plants are late blight and early blight. These diseases appear randomly in different positions and sizes on potato leaves, resulting in numerous combinations of infected leaves. This study proposes an architecture focused on a similarity-based approach, namely the Siamese Neural Network (SNN). SNN can recognize images by comparing two or more images and categorizing the test image accordingly. Thus, SNN has an advantage over classification-based approaches as it can identify various combinations of disease spots on potato plants using a similarity-based approach. This study is divided into two main scenarios: testing with data categories which were previously seen during the training process (traditional testing) and testing with the addition of new data categories that were not seen during training. In the first scenario, SNN showed better accuracy with an accuracy rate of 98.4%, while in the second scenario, SNN achieved an accuracy of 97.1%. That result suggests that SNN can categorize data very well, even recognizing data which never seen during training. These results offer hope that SNN can recognize more disease spots/patterns on potato plants or even identify new diseases by adding these new diseases to the SNN support set without retraining. |
Keywords: Potato Plant Diseases; Siamese Neural Network;
Deep Learning; ResNet50; CNN |
Corresponding Author: Rizal Kusuma Putra, Department of Informatics, Institut Teknologi Kalimantan, Indonesia. Email: rizal.putra@lecturer.itk.ac.id |
This work is licensed under a Creative Commons Attribution-Share Alike 4.0 
|
Document Citation: R. K. Putra, G. A. F. Alfarisy, F. W. Nugraha, and A. A. Nuryono, “Automatic Plant Disease Classification with Unknown Class Rejection using Siamese Networks,” Buletin Ilmiah Sarjana Teknik Elektro, vol. 6, no. 3, pp. 308-316, 2024, DOI: 10.12928/biste.v6i3.11619. |
- INTRODUCTION
Potatoes are a type of tuber that serves as a carbohydrate source for the human body. Potatoes are also a valuable crop, both domestically and internationally. According to the Indonesian Central Bureau of Statistics (BPS), potato production in Indonesia reached 1.42 tons in 2022, increasing 4.21% from the previous year. Healthy and disease-free potato plants are essential to produce many high-quality potatoes. The most common diseases found in potato plants are late blight and early blight [1].
Mostly, the spots/patterns of these two diseases can vary in shape or size, making it difficult for potato farmers to identify the specific diseases affecting their plants [2]. In agriculture, leaves are a crucial aspect for identifying diseases and determining the appropriate treatment for the plant [3]. Late blight typically appears on potato plants around the fifth to sixth week of growth. The initial symptoms include the appearance of wet spots on the edges or center of the leaves, which then enlarge and cause the changing colour to brown or gray. Meanwhile, early blight is characterized by the appearance of dry, circular brown spots on the lower leaves. If these diseases are not treated, the infection can be spreading to the stems, significantly reducing yields and potentially causing crop failure.
Many efforts have been made to address diseases in potato plants, not only agriculturally but also technologically [4], such as the use of image processing with computer vision [5], [6], [7], [8]. Fauzi et al. [9], proposed a hybrid model using DenseNet101 as feature extractor and SVM as classifier. The extracted features were reduced using Principal Component Analysis (PCA) [10] to minimize data dimensions. This study produced excellent performance in identifying several types of plants. In the study by Kiran and Chandrappa [10], disease recognition was proposed for several plantation crops. The study began by extracting features from the dataset using various methods such as histograms, Haralick textures, and Hu moments. This study also used several methods like logistic regression, KNN, decision tree, random forest, and SVM [11]. In this study, the Random Forest model achieved the highest test accuracy of 97.92%. In the experimentation conducted by Sharma et al. [12], several methods, such as logistic regression, KNN, SVM, and CNN, were tested. In the study, CNN had the highest test accuracy of 98%, followed by logistic regression with 66.4%. Demilie [13], experimented with several models for detecting and recognizing diseases in various plants, including potatoes. The study suggested that proposing more modern methods or algorithms, such as deep learning, both in architecture and hyperparameters are promising directions. Aligned with several studies, deep learning produces better results than conventional methods.
In this study, we propose a deep learning approach using a similarity-based approach by a Siamese Neural Network (SNN) which is different from previous research [14]. SNN produces a different output from typical deep learning methods. The outputs feature distance/similarity scores for the tested data, unlike traditional classification that yield a confidence score between 0 and 1 [15]. With a similarity approach, we only need to train the SNN model to distinguish images, not recognize them, making the model more capable to identify diverse leaf features or diseases on potato leaves, which vary in shape and position, as shown in Figure 1. Distinguishing images have been undertaken by measuring the features produced by the embedding model using the Euclidean distance function [16] which is similar like open-set recognition technique through contrastive prototype loss and self-attention reciprocal point learning recently proposed by Alfarisy et al. [17], [18]. Thus, the model can identify the category of the tested image by finding the smallest distance score. With the proposed method, the SNN model is expected to recognize more potato leaf disease features and identify new data categories that were not previously seen during the model's training process.

Figure 1. Diseases on potato plant leaves; from left to right: late blight, early blight, healthy
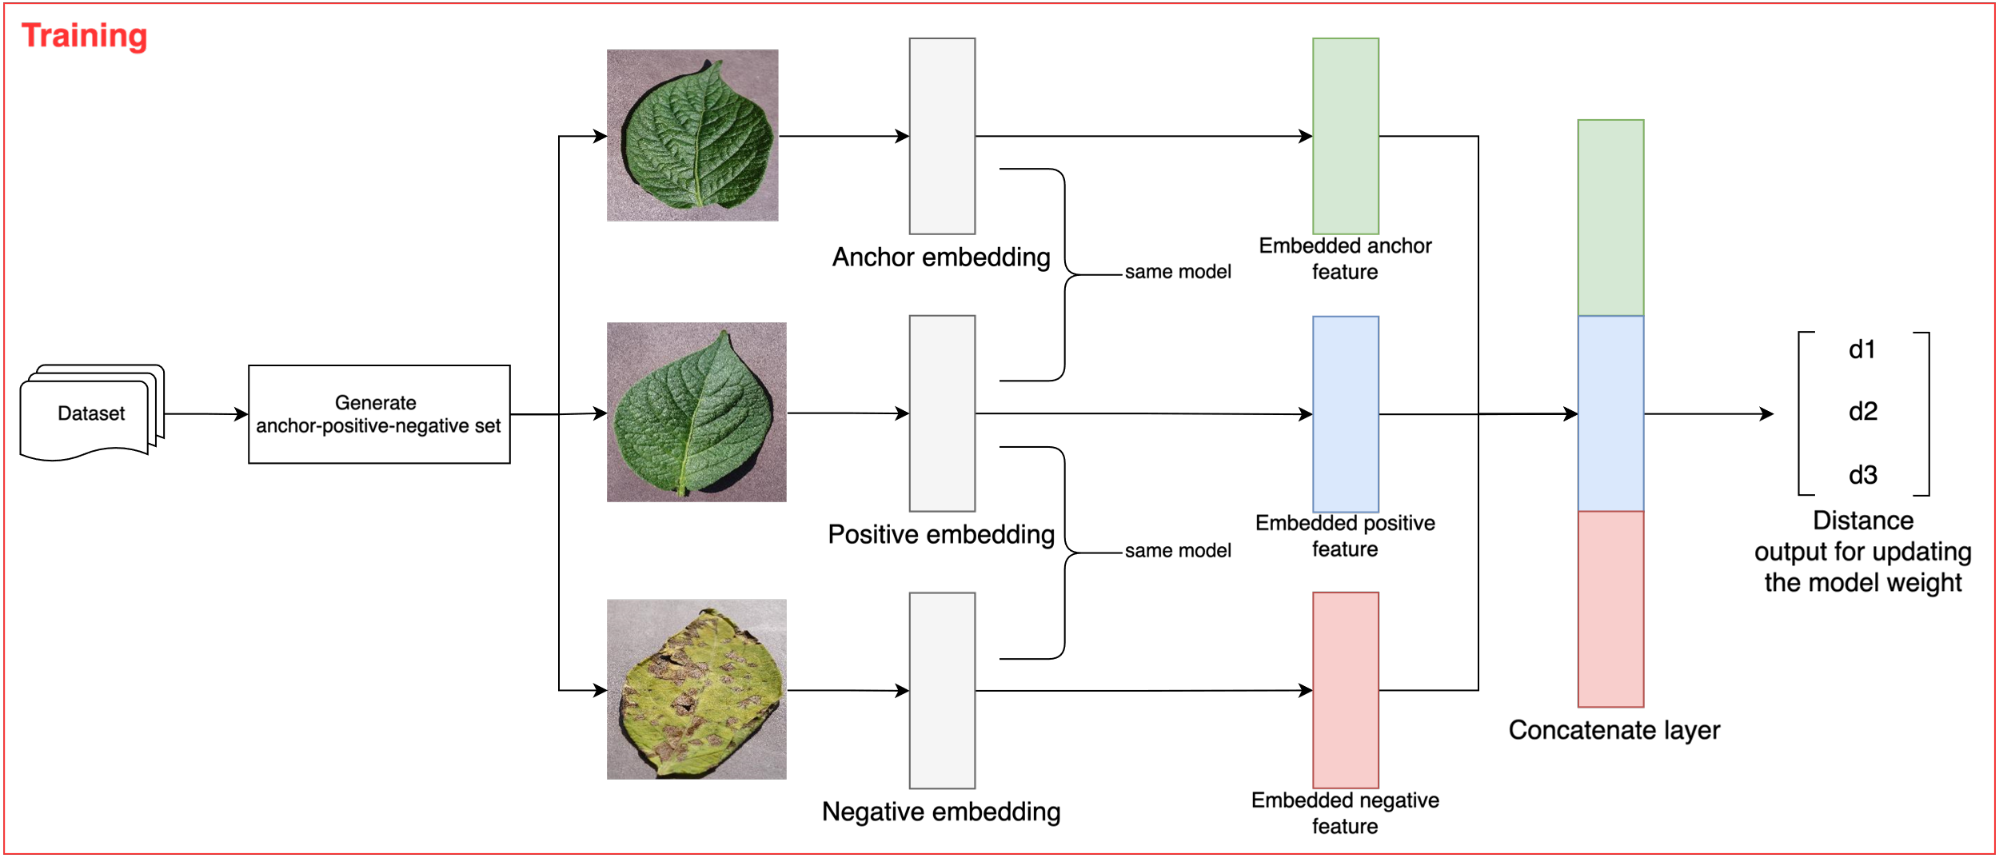

Figure 2. Proposed architecture of the SNN model
- METHODS
Siamese Neural Networks (SNN)
SNN (Siamese Neural Network) is a deep learning model that leverages the distance differences between features to categorize data. The features are obtained by extracting information from the data. This extraction process is conducted using a model or method called the backbone model. The backbone model can either be pre-trained or require training beforehand. The result of the extraction process is called extracted features. These extracted features are a  vector, where
  represents the feature length. The length of the feature is determined by the number of kernels in the final layer of the backbone model.
Dataset Collection
We utilized dataset of potato leaf diseases from the PlantVillage dataset available at https://www.kaggle.com [19]. The PlantVillage dataset contains various images of plant diseases. Hence, we merely selected the images that are related to the potato plants. Through this process, we obtained 500 images for the early blight category, 500 for the late blight category, and 152 for the healthy category.
Preprocessing Dataset
Before entering the deep learning architecture, the first step is preprocessing. Preprocessing is necessary to prepare the dataset to be processed by the deep learning model. All images were resized to 100×100 pixels followed by normalization. Ensuring the images are within the same range between 0 and 1. Afterwards, the dataset was split into 800 images for training data and 200 images for testing data. The training and testing data comprised only two categories: early blight and late blight. The healthy category was used to test whether the SNN model could recognize which was not seen during training.
Feature Extraction
We employed transfer learning as a feature extractor through the backbone model: ResNet50 [20]. ResNet50 is one of the popular models for extracting image features, as evidenced by its high accuracy in the ImageNet competition. ResNet50 generates 2048 feature outputs for each image. We utilized the trained weights from the ImageNet research [21].
Triplet Ranking Loss
The proposed SNN model has three inputs, requiring a loss function considering three inputs. Therefore, we implemented a triplet ranking loss function using the Euclidean distance formula. As shown in Figure 2, the proposed SNN model has three inputs: anchor, positive, and negative. The anchor is data from a specific category that determines the model's learning class. The positive is data that belongs to the same category as the anchor, while the negative is data from a different category than the anchor. A detailed illustration of these signs can be seen in Figure 3. Each component will be passed through its respective CNN (ResNet50) network during model training, producing three embeddings. These three embeddings are then passed through the triplet loss function, defined in Equation (1).
| 
| (1) |
In Equation (1),  represents the feature embedding distance between the anchor and the positive, and
  is the feature embedding distance between the anchor and the negative. In this study we set the margin to 0.2 following the FaceNet model [22]. With the loss function as shown in Equation (1), the model will learn to minimize the feature embedding distance between similar images (anchor and positive) and maximize the distance between different images (anchor and negative). This process is detailed in Figure 4.
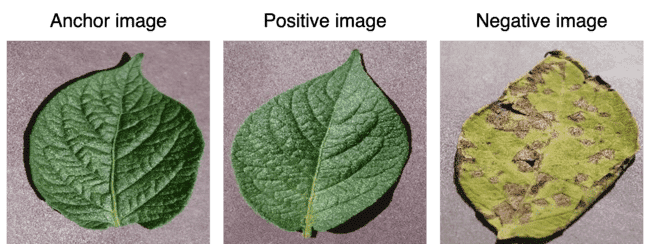
Figure 3. Examples of anchor image, positive image, and negative image
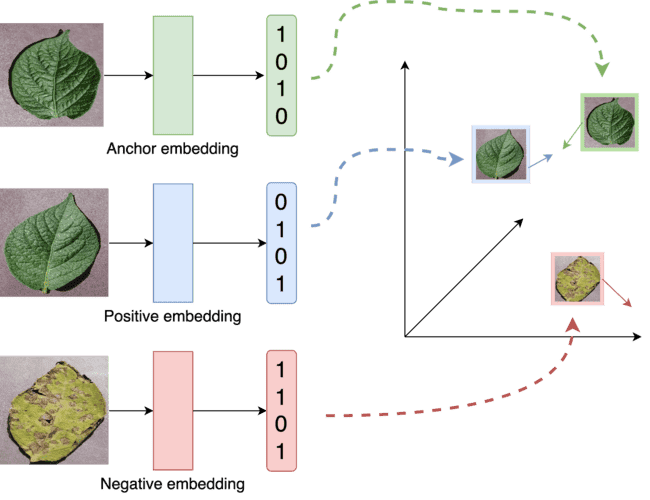
Figure 4. How triplet loss works to bring the embedding features of the anchor image closer to the positive image and further from the negative image
Semi-hard Triplet
After creating the triplet loss function, the next process is ensuring that the model learns which feature embeddings should be brought closer together and which should be pushed apart from the anchor feature embedding. To assist the model during training, we must provide a training dataset where the anchor-negative embedding distance is close to the anchor-positive embedding distance. That training dataset can be achieved by applying the condition in Equation (2) [23]. Using this condition, the positive embedding features are closer in distance to the negative embedding features than the negative embedding features are to the anchor. When represented in an image, the semi-hard triplet concept will produce a series of data visually resembling each other, as shown in Figure 5. The semi-hard triplet accounts for half of the batch size, which is 10. As a result, there are five easy triplets and five semi-hard triplets.

Figure 5. Example of a semi-hard triplet where the negative has similar features to the positive
| 
| (2) |
Building the proposed SNN Model
The SNN model was built using the ResNet50 embedding model. The proposed SNN model has three inputs, as shown in Figure 2. Our SNN model accepts three RGB image inputs of size 100×100×3, which then undergo the embedding process with the ResNet50 model. After obtaining the feature embeddings from each image, the SNN model learns these features by calculating their distances using the Euclidean distance function. The SNN was trained using Adam optimizer with initial learning rate of  and the model was trained for 50 epochs.
Testing the SNN Model
Testing the SNN model cannot rely solely on whether the model achieves high test accuracy. The primary task of the SNN model is to provide closer distance calculations for pairs of images within the same category and farther distance calculations for pairs of images in different categories. Therefore, in addition to accuracy, we also tested the SNN model using the Area Under the Curve (AUC) [24].
AUC is a reliable model evaluation indicator, especially when the dataset used is imbalanced. In this study, one category only had 152 images, while the others consisted of 500 images. AUC provides a fairer assessment because it considers sensitivity (True Positive Rate) and specificity (False Positive Rate). AUC focuses more on the model's ability to distinguish between positive and negative classes, regardless of class distribution. AUC is also independent to the threshold [25], which makes it a suitable metric to assess the unknown class rejection to reveal the model potential.
To provide a fair comparison, we tested the SNN model's accuracy. We compared it with several models from previous studies that were trained and tested on the same device and data (training and testing data). This scenario was conducted to prove that the SNN model performs better than models from previous research.
- RESULT AND DISCUSSION
Pre-training test
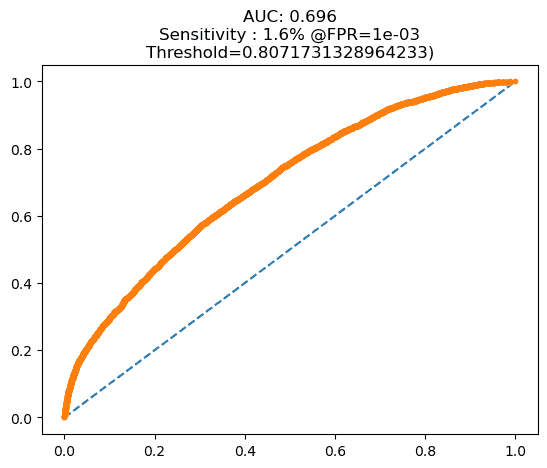
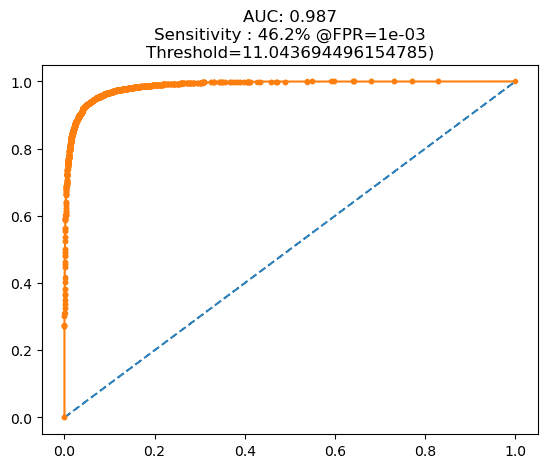
Before starting the training phase, we tested our SNN model using the preprocessed test dataset. At this stage, the number of test dataset images was 200, consisting of 100 images from the early blight category and 100 images from the late blight category. The results from this stage aligned with our expectations that our model was still not optimal, indicating that the SNN model could not yet effectively distinguish the images in the test dataset. The resulting AUC value was only 0.696, close to 0.5, which means the model was equivalent to random class selection. The AUC at this stage is shown in Figure 6. At this stage, the distance values produced by the SNN model were often similar between images of different categories, leading to prediction errors. The distance between the dataset and the support set can be seen above each support set image. The support set images were randomly selected for each category. An explanation of this is provided in Figure 7.
| 
|
Figure 6. AUC: (a) pre-training test, (b) post-training test
Figure 7. The SNN model still produces distances that are not significantly different for images of different categories during pre-training tests, leading to prediction errors
Testing with AUC
Having the trained SNN model, we tested our approach by examining the AUC score. At this stage, the AUC score increased significantly compared to the pre-training phase. The AUC value at this stage was 0.987, as shown in Figure 6(b). This score indicates that the SNN model could generate appropriate feature distances—shorter distances for images within the same category and longer distances for images from different categories. The difference in feature distance at this stage also showed improvement. Visualizations at this stage can be seen in Figure 8.
Comparison with Previous Research
After obtaining the trained SNN model, we compared our proposed SNN model with models from previous research. Two earlier models were used as comparisons: a CNN model with several layers from [26] and DenseNet121 from [27]. Both models were retrained using the same training dataset as our proposed SNN model and tested on the same test dataset.
In this testing phase, we conducted two testing scenarios: the test dataset consisted of two categories, early blight and late blight, and the test dataset consisted of three categories, with the addition of a new category that had not seen of the three models during the training process, the healthy category. In the first scenario, our proposed SNN model achieved a test accuracy of 98.4%. The CNN model [24] achieved an accuracy of 96%, and the DenseNet121 model from [25] achieved an accuracy of 97.5%. In this scenario, the SNN model outperformed the deep learning models that used classification-based approaches.
The three models had a significant difference in the second scenario. Our proposed SNN model achieved an accuracy of 97.1%, the CNN model [26] achieved an accuracy of 54.55%, and the DenseNet model from [27] achieved an accuracy of 55.4%. These test results show that the similarity-based approach has a significant advantage over the classification-based approach in recognizing a new dataset category. In deep learning with a classification approach, the model cannot recognize test datasets if the dataset has not been seen during the model training process. Therefore, by utilizing a similarity-based approach, we can recognize diseases on potato leaves more accurately and provide preliminary knowledge if a new disease emerges by adding the latest disease to the support set. Most importantly, retraining is unnecessary and can consume significant resources. These test results are shown in Table 1, and the new dataset recognition test by our SNN model can be seen in Figure 9.
Figure 8. The SNN model produces a much better distance difference than the pre-training test stage
Figure 9. The proposed SNN model can recognize previously unseen datasets, as demonstrated by producing the smallest distance value for ‘Class 2,’ which represents the healthy leaf category
- The Results of Testing Our Proposed SNN Model Compared to Previous Research Models
Model | Accuracy |
Scenario 1 | Scenario 2 (+new data) |
Our SNN | 98.4% | 97.1% |
CNN [26] | 96% | 54.55% |
DenseNet121 [27] | 97.5% | 55.4% |
- CONCLUSIONS
This study demonstrated that the proposed SNN model can effectively recognize potato leaf diseases, such as early and late blight. Additionally, the model can identify new data categories not seen during training. This result is evidenced by the SNN model's significantly higher accuracy than deep learning models using classification approaches, such as CNN and DenseNet121. The test results showed that the SNN model achieved an accuracy of 98.4% for datasets seen during training and 97.1% for datasets not seen during training. This result indicates that the similarity-based approach has advantages in recognizing potato leaf diseases without requiring resource-intensive retraining. This model could be integrated into automated disease monitoring systems in practical agricultural settings, allowing farmers to detect infections early and apply targeted interventions. The model's ability to recognize unseen data categories without retraining is especially beneficial in dynamic environments, where new disease variants may emerge, or when applying the system across different crop types and regions. For instance, this system could be deployed via mobile or drone-based platforms, enabling real-time disease monitoring in the field. This would empower farmers to make informed decisions quickly, reducing crop losses and improving disease management efficiency. Additionally, integrating this model into large-scale agricultural monitoring platforms could streamline disease tracking and control, contributing to more sustainable farming practices and enhanced food security.
ACKNOWLEDGEMENT
Our deepest gratitude to Institut Teknologi Kalimantan for providing the facilities and resources that supported this research. We also thank the team and colleagues who provided valuable assistance and feedback throughout the research process. Special thanks to Tairu Oluwafemi Emmanuel for posting the PlantVillage dataset on Kaggle, which greatly assisted in the data collection for this research. Additionally, we appreciate everyone who contributed to the success of this research, whose names may not be mentioned individually. Further studies should employ larger classes of disease to assess the potential of the proposed SNN model and compare it with other open-set recognition techniques.
REFERENCES
[1] A. Granwehr and V. Hofer, “Analysis on Digital Image Processing for Plant Health Monitoring,” Journal of Computing and Natural Science, vol. 1, no. 1, pp. 5–8, Jan. 2021, https://doi.org/10.53759/181X/JCNS202101002.
[2] X. Li, Y. Zhou, J. Liu, L. Wang, J. Zhang, and X. Fan, “The Detection Method of Potato Foliage Diseases in Complex Background Based on Instance Segmentation and Semantic Segmentation,” Front Plant Sci, vol. 13, Jul. 2022, https://doi.org/10.3389/fpls.2022.899754.
[3] N. Upadhyay and N. Gupta, “A Survey on Diseases Detection for Agriculture Crops Using Artificial Intelligence,” 2021 5th International Conference on Information Systems and Computer Networks, ISCON 2021, pp. 1-8, 2021, https://doi.org/10.1109/ISCON52037.2021.9702513.
[4] F. Furizal, A. Ma’arif, A. A. Firdaus, and W. Rahmaniar, “Future Potential of E-Nose Technology: A Review,” International Journal of Robotics and Control Systems, vol. 3, no. 3, pp. 449–469, Jul. 2023, https://doi.org/10.31763/ijrcs.v3i3.1091.
[5] Erlin, I. Fuadi, R. N. Putri, D. Nasien, Gusrianty, and D. Oktarina, “Deep Learning Approaches for Potato Leaf Disease Detection: Evaluating the Efficacy of Convolutional Neural Network Architectures,” Revue d’Intelligence Artificielle, vol. 38, no. 2, pp. 717–727, Apr. 2024, https://doi.org/10.18280/ria.380236.
[6] H. Pattanaik, G. Patnaik, A. Gouda, M. Sahoo, and M. Das, “A Comparative Study of Disease Detection in Potato Plants Using Machine Learning and Deep Learning Methods,” in Data Science and Communication, pp. 159–172, 2024, https://doi.org/10.1007/978-981-99-5435-3_11.
[7] B. M. Joshi and H. Bhavsar, “Plant leaf disease detection and control: A survey,” Journal of Information and Optimization Sciences, vol. 41, no. 2, pp. 475–487, 2020, https://doi.org/10.1080/02522667.2020.1734295.
[8] S. Bangari, P. Rachana, N. Gupta, P. S. Sudi, and K. K. Baniya, “A Survey on Disease Detection of a potato Leaf Using CNN,” in 2022 Second International Conference on Artificial Intelligence and Smart Energy (ICAIS), pp. 144–149, 2022, https://doi.org/10.1109/ICAIS53314.2022.9742963.
[9] M. D. Fauzi, F. D. Adhinata, N. G. Ramadhan, and N. A. F. Tanjung, “A Hybrid DenseNet201-SVM for Robust Weed and Potato Plant Classification,” Jurnal Ilmiah Teknik Elektro Komputer dan Informatika, vol. 8, no. 2, pp. 298–306, 2022, https://doi.org/10.26555/jiteki.v8i2.23886.
[10] S. M. Kiran and D. N. Chandrappa, “Plant Leaf Disease Detection Using Efficient Image Processing and Machine Learning Algorithms,” Journal of Robotics and Control (JRC), vol. 4, no. 6, pp. 840–848, Nov. 2023, https://doi.org/10.18196/jrc.v4i6.20342.
[11] A. Mousavi, A. H. Sadeghi, A. M. Ghahfarokhi, F. Beheshtinejad, and M. M. Masouleh, “Improving the Recognition Percentage of the Identity Check System by Applying the SVM Method on the Face Image Using Special Faces,” International Journal of Robotics and Control Systems, vol. 3, no. 2, pp. 221–232, Mar. 2023, https://doi.org/10.31763/ijrcs.v3i2.939.
[12] P. Sharma, P. Hans, and S. C. Gupta, “Classification Of Plant Leaf Diseases Using Machine Learning And Image Preprocessing Techniques,” in 2020 10th International Conference on Cloud Computing, Data Science & Engineering (Confluence), pp. 480–484, 2020, https://doi.org/10.1109/Confluence47617.2020.9057889.
[13] W. B. Demilie, “Plant disease detection and classification techniques: a comparative study of the performances,” J Big Data, vol. 11, no. 1, 2024, https://doi.org/10.1186/s40537-023-00863-9.
[14] X. Chen and K. He, “Exploring simple Siamese representation learning,” Proceedings of the IEEE Computer Society Conference on Computer Vision and Pattern Recognition, pp. 15745–15753, 2021, https://doi.org/10.1109/CVPR46437.2021.01549.
[15] R. K. Putra and N. P. Utama, “Enhancing X-ray Baggage Inspection through Similarity-based Prohibited Object Identification,” in 2023 7th International Conference on Imaging, Signal Processing and Communications (ICISPC), pp. 16–21, 2023, https://doi.org/10.1109/ICISPC59567.2023.00012.
[16] M. D. Al Fitra and A. Fadlil, “Detection of Fuel Purity Using the TCS3200 Sensor Using the Euclidean Distance Function,” Buletin Ilmiah Sarjana Teknik Elektro, vol. 5, no. 3, pp. 312–322, 2023, https://doi.org/10.12928/biste.v5i3.8260.
[17] G. A. F. Alfarisy, O. A. Malik, and O. W. Hong, “Towards open domain-specific recognition using Quad-Channel Self-Attention Reciprocal Point Learning and Autoencoder,” Knowl Based Syst, vol. 284, p. 111261, 2024, https://doi.org/10.1016/j.knosys.2023.111261.
[18] G. A. F. Alfarisy, O. A. Malik, and O. W. Hong, “Quad-Channel Contrastive Prototype Networks for Open-Set Recognition in Domain-Specific Tasks,” IEEE Access, vol. 11, pp. 48578–48592, 2023, https://doi.org/10.1109/ACCESS.2023.3275743.
[19] F. Mohameth, C. Bingcai, and K. A. Sada, “Plant Disease Detection with Deep Learning and Feature Extraction Using Plant Village,” Journal of Computer and Communications, vol. 8, no. 6, pp. 10–22, 2020, https://doi.org/10.4236/jcc.2020.86002.
[20] S. Mascarenhas and M. Agarwal, “A comparison between VGG16, VGG19 and ResNet50 architecture frameworks for Image Classification,” in 2021 International Conference on Disruptive Technologies for Multi-Disciplinary Research and Applications (CENTCON), pp. 96–99, 2021, https://doi.org/10.1109/CENTCON52345.2021.9687944.
[21] B. Koonce, “ResNet 50,” in Convolutional Neural Networks with Swift for Tensorflow: Image Recognition and Dataset Categorization, pp. 63–72, 2021, https://doi.org/10.1007/978-1-4842-6168-2_6.
[22] F. Cahyono, W. Wirawan, and R. Fuad Rachmadi, “Face Recognition System using Facenet Algorithm for Employee Presence,” in 2020 4th International Conference on Vocational Education and Training (ICOVET), pp. 57–62, 2020, https://doi.org/10.1109/ICOVET50258.2020.9229888.
[23] Z. Tan et al., “Cross-Batch Hard Example Mining With Pseudo Large Batch for ID vs. Spot Face Recognition,” IEEE Transactions on Image Processing, vol. 31, pp. 3224–3235, 2022, https://doi.org/10.1109/TIP.2021.3137005.
[24] J. Li, “Area under the ROC Curve has the Most Consistent Evaluation for Binary Classification,” arXiv preprint arXiv:2408.10193, 2024, https://doi.org/10.48550/arXiv.2408.10193.
[25] T. Fawcett, “An introduction to ROC analysis,” Pattern Recognit Lett, vol. 27, no. 8, pp. 861–874, 2006, https://doi.org/10.1016/j.patrec.2005.10.010.
[26] U. Y. Tambe, A. Shobanadevi, A. Shanthini, and H.-C. Hsu, “Potato Leaf Disease Classification using Deep Learning: A Convolutional Neural Network Approach,” River Publishers Series in Proceedings, 2023, https://doi.org/10.13052/rp-9788770040723.043.
[27] H. Ghosh, I. S. Rahat, K. Shaik, S. Khasim, and M. Yesubabu, “Potato Leaf Disease Recognition and Prediction using Convolutional Neural Networks,” ICST Transactions on Scalable Information Systems, vol. 10, no. 6, Sep. 2023, https://doi.org/10.4108/eetsis.3937.
Automatic Plant Disease Classification with Unknown Class Rejection using Siamese Networks
(Rizal Kusuma Putra)
