Buletin Ilmiah Sarjana Teknik Elektro ISSN: 2685-9572
Internet of Things (IoT) Based Speed Monitoring System for Electric Cars
Rean Andhika Putra, Alfian Ma’arif
Department of Electrical Engineering, Universitas Ahmad Dahlan, Yogyakarta, Indonesia
ARTICLE INFORMATION |
| ABSTRACT |
Article History: Submitted 08 July 2024 Revised 10 August 2024 Accepted 10 August 2024 |
| 
The electric cars that have been made are also being competed at national events such as the FESC IIMS 2022 event in Jakarta and the Inter-College Electric Car Joint Training by the Ministry of Public Works and Public Housing (PUPR) in the context of the 2022 Road Day and the Indonesian Electric Car Contest (KMLI) at the Bandung State Polytechnic in Bandung until now. For the sustainability of electric cars, various research still needs to be carried out to achieve optimal electrical system design. Here, Ahmad Dahlan University's electric cars can operate at speeds above 30,000 rpm when monitored using a speedometer, but here there is no design for a long-distance speed monitoring system, therefore team colleagues who are in the paddock during the competition are not yet able to monitor the speed from inside the paddock. This system needs to be used during the race so that team mates in the paddock during the race can also monitor the speed of the Electric Car during the race when the race starts. This system is used using the Internet of Things (IoT) method because IoT can display speed data via a laptop and can implement a remote monitoring system. Therefore, in this final report, we will discuss how to design and implement a speed monitoring system for electric cars based on the Internet of Things (IoT). To get the best results and as expected, the design of this system refers to various sources. Where the input component is the detection from the Optocoupler Sensor after detecting the wheel speed, then the data is processed via Arduino using program initiation on the Arduino ide, after that the output will be generated on the I2C LCD and also the output will be displayed on IoT Things Speak because IoT itself, you have to use an internet signal, so here we add the sim800l component which is used to send Arduino data to Thingspeak via the sim800l internet intermediary. This tool was created with the aim of ensuring that the Al-Qorni UAD electric car continues to develop and has an advanced technological system. |
Keywords: KMLI; Electric-Vehicle; Arduino; Internet of Things |
Corresponding Author: Alfian Ma’arif, Department of Electrical Engineering, Universitas Ahmad Dahlan, Yogyakarta, Indonesia. Email: alfian_maarif@ieee.org |
This work is licensed under a Creative Commons Attribution-Share Alike 4.0 
|
Document Citation: R. A. Putra and A. Ma’arif, “Internet of Things (IoT) Based Speed Monitoring System for Electric Cars,” Buletin Ilmiah Sarjana Teknik Elektro, vol. 6, no. 2, pp. 182-189, 2024, DOI: 10.12928/biste.v6i2.11317. |
- INTRODUCTION
Electric cars have been created and developed by many well-known car manufacturers outside Indonesia, and have been widely used by humans in everyday life. Electric cars can be combined with electronic components which have an important role in testing and in use and use [1]-[3]. The rise in popularity of electric cars has attracted the interest of world automotive companies and also universities to develop them [4][5]. The absence of ownership rights to electric cars has made several universities in Indonesia compete to develop them. Manufacturing of electric cars at Ahmad Dahlan University has started in 2019.
The implementers in making this electric car are students from the Faculty of Teacher Training and Education, Automotive Technology Vocational Education Study Program and the Faculty of Industrial Technology, Electrical Engineering Study Program, which started by taking part in a Comparative Study at the 2019 Indonesian Electric Car Contest at the Bandung State Polytechnic [6]-[9]. The support and role of the Academic Community of the Teacher Training and Education Faculty and the Faculty of Industrial Technology in making electric cars increased the enthusiasm of students to produce an electric car called ADEV 01 with the name Al-Qorni Team. The electric cars that have been made are also being competed at national events such as the FESC IIMS 2022 event in Jakarta and the Inter-College Electric Car Joint Training by the Ministry of Public Works and Public Housing (PUPR) in the context of the 2022 Road Day and the Indonesian Electric Car Contest (KMLI) at the Bandung State Polytechnic in Bandung until now.
For the sustainability of electric cars, various research still needs to be carried out to achieve optimal electrical system design [10]-[13]. Here, Ahmad Dahlan University's electric cars can operate at speeds above 30,000 rpm when monitored using a speedometer, but here there is no design for a long-distance speed monitoring system, therefore team colleagues who are in the paddock during the competition are not yet able to monitor the speed from inside the paddock [14]-[17]. This system needs to be used during the race so that team mates in the paddock during the race can also monitor the speed of the Electric Car during the race when the race starts. This system is used using the Internet of Things (IoT) method because IoT can display speed data via a laptop and can implement a remote monitoring system [18]-[20]. Therefore, in this final report, we will discuss how to design and implement a speed monitoring system for electric cars based on the Internet of Things (IoT). From the things explained above, the author chose the title SPEED MONITORING SYSTEM IN ELECTRIC CARS BASED ON Internet of Things (IoT).
- METHODS
- Software Design
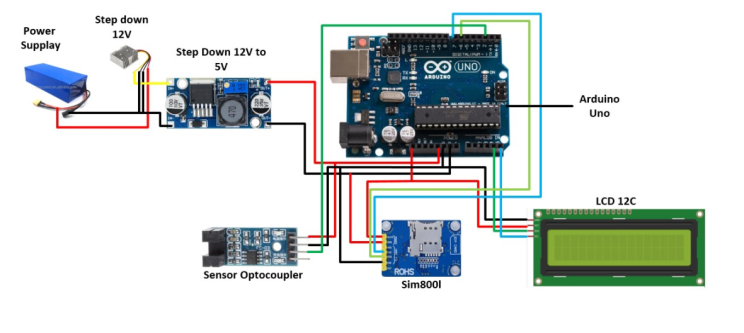
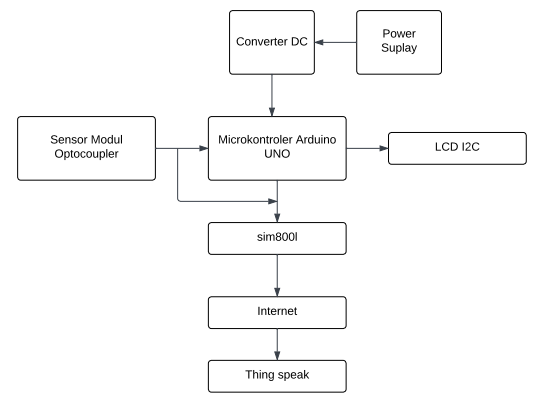
The flowchart or flow diagram begins with How the system works, namely a 48 V battery is connected to a DC 12 V step down converter, after that a DC 12V converter is used to reduce the voltage from 48V to 12V. then the output from the 12V converter is connected again to the input of the DC to 5V converter, the DC to 5V converter is used to reduce the voltage from 12V to 5V. After that, we input the output from the converter + to 5V from the Arduino and we input the - to GND Arduino. And here I use an optocoupler sensor which is used to detect speed on the wheels of an electric car, + sensor enters 5V Arduino and sensor data enters pin 2 on Arduino then - sensor enters GND Arduino. If the sensor has detected the wheel speed, the results of the sensor output that have been processed by the Arduino will be displayed on the I2C LCD. after that here I use sim800l, which is used as a long distance internet intermediary which is used to produce speed output on IoT (Internet of Things) on Things Speak, so the sensor detects the speed of the wheels on the car, after that it is processed via Arduino and will be displayed on I2C, and also Arduino send speed data to sim800l as an internet intermediary and sim800l sends data to IoT after which speed data will be displayed graphically and digitally and also a speedometer via Things Speak. The flow diagram and block diagram of the Adev 01 Monalisa vehicle condition monitoring system can be seen in Figure 1 and Figure 2.

Figure 1. Flowchart
 .
.
Figure 2. Blok Diagram
- Wiring Diagram
Hardware design continues by creating a wiring diagram of the components used. A wiring diagram is the process of connecting components using cables or PCB boards so that they can be connected from one component to another. All components must be connected to the Arduino UNO microcontroller. Specifications and wiring diagrams can be seen in Table 1 and Figure 3.
Tabel 1. Wiring diagram specifications
No | Arduino Uno | Speed Sensor | Sim800l | LCD I2C | Converter 5V |
1 | Pin 2 | D0 | - | - | - |
2 | Pin 6 | - | TX | - |
|
3 | Pin 7 | - | RX | - |
|
4 | A4 | - | - | SDA |
|
5 | A5 | - | - | SCL |
|
6 | GND | Negative | Negative | Negative | Negative |
7 | 5V | VCC | VCC | VCC | OUT 5V |

Figure 3. Wiring diagram
- RESULTS AND DISCUSSION
- Optocoupler Module Speed Sensor Calibration
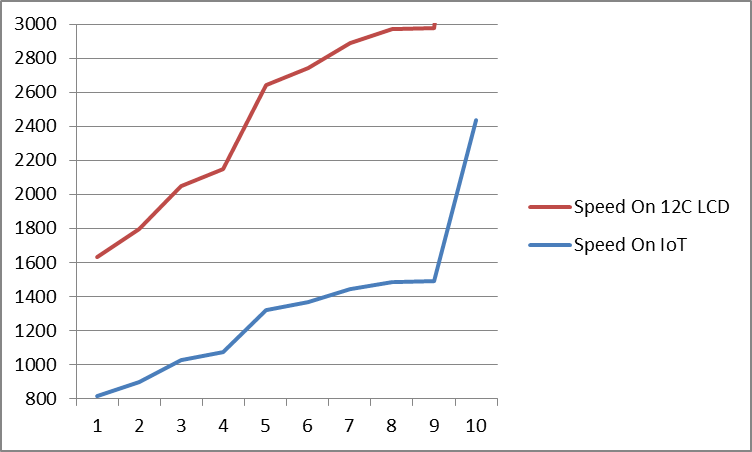
Sensor calibration is carried out to test the accuracy of the sensors used in the system. This is done to reduce errors that occur when the system is used. The calibration process is carried out using the help of an I2C LCD. Calibration is carried out by comparing the values read by the speed sensor with IoT and the speed sensor with I2C LCD. The data obtained is displayed in Table 2.
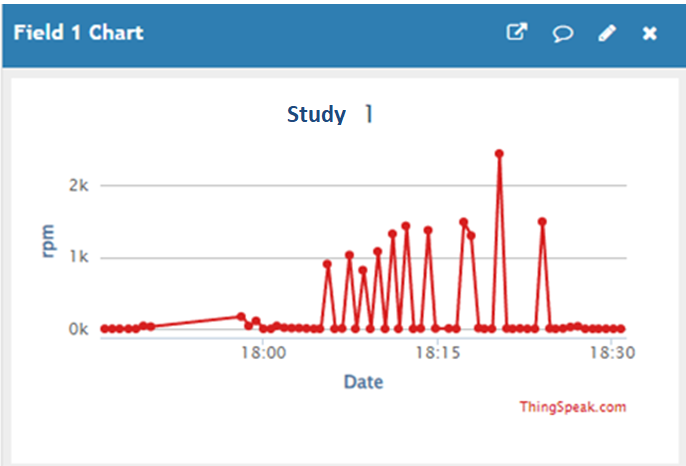
Speed sensor calibration produces good data with minimal differences. Calibration data collection was carried out for 10 data. With an interval of 15 seconds. This shows that the calibration carried out has been successful as desired. The data obtained from the calibration results are made in the form of a graph shown in Figure 4 and Figure 5.
Tabel 2. Speed sensor calibration results
No | Speed On IoT | Speed On 12C LCD | Data Difference |
1 | 815 | 815 | 0 |
2 | 900 | 900 | 0 |
3 | 1025 | 1025 | 0 |
4 | 1075 | 1075 | 0 |
5 | 1320 | 1320 | 0 |
6 | 1370 | 1370 | 0 |
7 | 1445 | 1445 | 0 |
8 | 1485 | 1485 | 0 |
9 | 1490 | 1490 | 0 |
10 | 2435 | 2435 | 0 |
Average | 1334.5 | 1334.5 | 0 |
| 
|
Figure 4. sensor calibration data on Things Speak and LCD I2C | Figure 5. Graphics On Things Speak |
- Internet of Things Calibration Testing
IoT calibration is carried out to test the accuracy of the sensors used in this method. This is done to reduce errors that occur when the system is used. The calibration process is carried out using the same Tachometer to detect wheel rotation. Calibration is carried out by comparing the values read by the sensor with the Tachometer. The results of testing the car in stationary conditions can be seen in Table 3.
Speed sensor calibration produces good data with minimal differences. Calibration data collection was carried out for 10 data. With an interval of 15 seconds. The average difference is not good, namely with an average difference of 99.09. This shows that the calibration carried out has been successful as desired. This shows that the calibration carried out is not according to what was desired. The data obtained from the test results are made in the form of a graph shown in Figure 6.
Tabel 3. Internet of Things Calibration
No | Speed Data On IoT and 12C | Speed On Tachometer | Data Difference |
1 | 815 | 8399 | 24.9 |
2 | 900 | 993.1 | 93.1 |
3 | 1025 | 1066.2 | 41.2 |
4 | 1075 | 1145.5 | 70.5 |
5 | 1320 | 1466.2 | 146.2 |
6 | 1370 | 1477.4 | 107.4 |
7 | 1445 | 1588 | 110.5 |
8 | 1485 | 1590 | 97 |
9 | 1490 | 1600.1 | 110.1 |
10 | 2435 | 2625 | 190 |
Average | 1334.5 | 1433.59 | 99.09 |
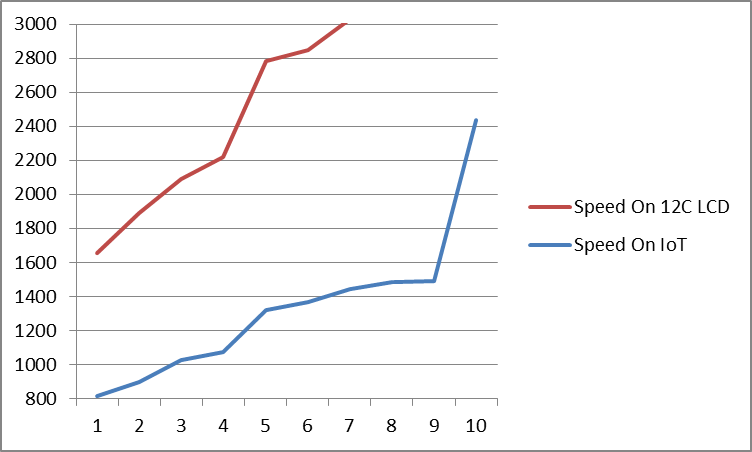
Figure 6. Internet of Things calibration graph
- Car Testing in Low Speed Conditions
Testing the car in slow condition is carried out to see the response of the car when the car is running slowly. However, the car was running but in jackstand condition. The parameter observed is the speed of the car up to how many rpm, the speed will be displayed on IoT once every 15 seconds because on IoT, the speed of the car is also observed with a Tachometer which is used to compare the values between the results on IoT and the Tachometer. The results of testing the car in stationary conditions can be seen in Table 4.
Testing the speed data of the Adev 01 Monalisa electric car, the data generated on IoT produces good data by testing the car data when conditions are slow, carrying out 10 data. With an interval of 30 seconds. The average difference produced in the speed data on the speed data shows 97.53 rpm. This shows that the data testing carried out has been successful as desired. This shows that the data testing carried out has been successful as desired. The data obtained from the test results is made in graphic form which is displayed in Figure 7.
Tabel 4. Car data test results in low speed conditions
No | Speed on Tachometer | Speed on IoT and 12C LCD | Data Difference |
1 | 100 | 180 | 80 |
2 | 103.1 | 186.5 | 83.4 |
3 | 105 | 190 | 85 |
4 | 110 | 215 | 105 |
5 | 111.9 | 218.8 | 106.9 |
6 | 117 | 220 | 103 |
7 | 120.1 | 222.1 | 102 |
8 | 125.5 | 226.5 | 101 |
9 | 126 | 230.5 | 104.5 |
10 | 128.5 | 233 | 104.5 |
Average | 114.71 | 212.24 | 97.53 |
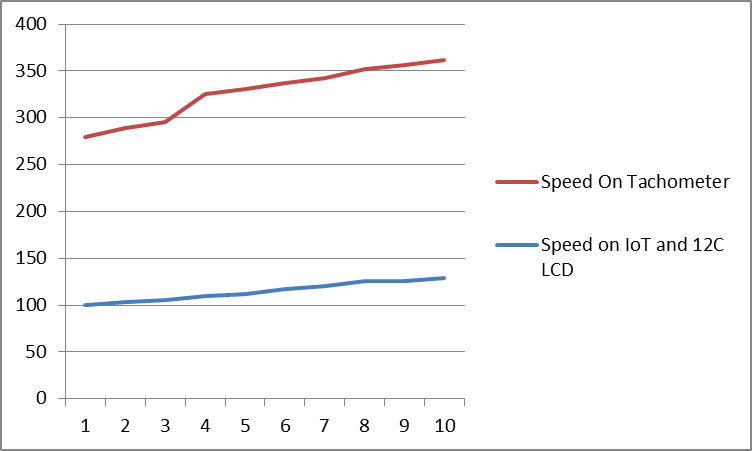
Figure 7. Graph of test data in low speed conditions
- Car Testing Under 50% Speed Conditions
Testing the car at medium speed or 50% is carried out to see the response of the car when it is on 50% gas. The parameters observed are the current on the speed instrument on the IoT and 12C LCD. The parameter observed is the speed of the car up to how many rpm, the speed will be displayed on IoT once every 15 seconds because on IoT, the speed of the car is also observed with a Tachometer which is used to compare the values between the results on IoT and the Tachometer. The results of testing the car in stationary conditions can be seen in Table 5.
Testing the speed data of the Adev 01 Monalisa electric car, the data generated on IoT produces good data by testing the car data when conditions are slow, carrying out 10 data. With an interval of 30 seconds. The average difference produced in the speed data on the speed data shows 60.49 rpm. This shows that the data testing carried out has been successful as desired. The data obtained from the test results are made in graphic form which is displayed in Figure 8.
Tabel 5. Car data test results in 50% speed conditions
No | Speed On Tachometer | Speed On IoT and 12C LCD | Data Difference |
1 | 715 | 750 | 35 |
2 | 720.5 | 755 | 34.5 |
3 | 723.3 | 790 | 66.7 |
4 | 726 | 802 | 76 |
5 | 764.5 | 823.1 | 58.6 |
6 | 768 | 8412 | 73.2 |
7 | 770 | 852 | 82 |
8 | 781 | 871.9 | 90.9 |
9 | 815 | 880 | 65 |
10 | 900 | 923 | 23 |
Average | 768.33 | 828.82 | 60.49 |
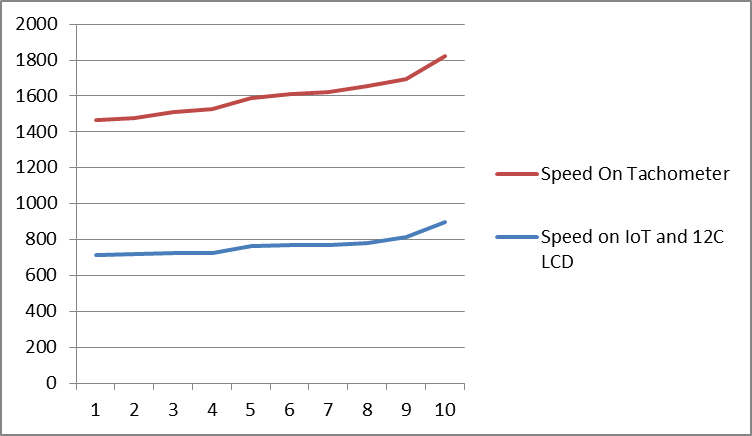
Figure 8. Data test graph under 50% speed condition
- Car Testing in High Speed Conditions
Testing the car in high speed conditions was carried out to see the response of the car when it was on 100% gas. The parameters observed are the current on the speed instrument on the IoT and 12C LCD. The parameter observed is the speed of the car up to how many rpm, the speed will be displayed on IoT once every 15 seconds because on IoT, the speed of the car is also observed with a Tachometer which is used to compare the values between the results on IoT and the Tachometer. The results of testing the car in stationary conditions can be seen in Table 6.
Testing the speed data of the Adev 01 Monalisa electric car, the data generated on IoT produces good data by testing the car data when conditions are slow, carrying out 10 data. With an interval of 30 seconds. The average difference produced in the speed data on the speed data shows 97.53 rpm. This shows that the data testing carried out has been successful as desired. The data obtained from the test results is made in graphic form which is displayed in Figure 9.
Tabel 6. Car data test results in high speed conditions
No | Speed On Tachometer | Speed On IoT and 12C LCD | Data Difference |
1 | 1445 | 1540.5 | 80 |
2 | 1485 | 1582 | 83.4 |
3 | 1490 | 1600.1 | 85 |
4 | 2435 | 2625 | 105 |
5 | 2535 | 2755 | 106.9 |
6 | 2717.1 | 2871 | 103 |
7 | 2962 | 3115.1 | 102 |
8 | 3114 | 3261 | 101 |
9 | 3245 | 3350 | 104.5 |
10 | 3441.9 | 3542 | 104.5 |
Average | 2487 | 2624.17 | 97.53 |
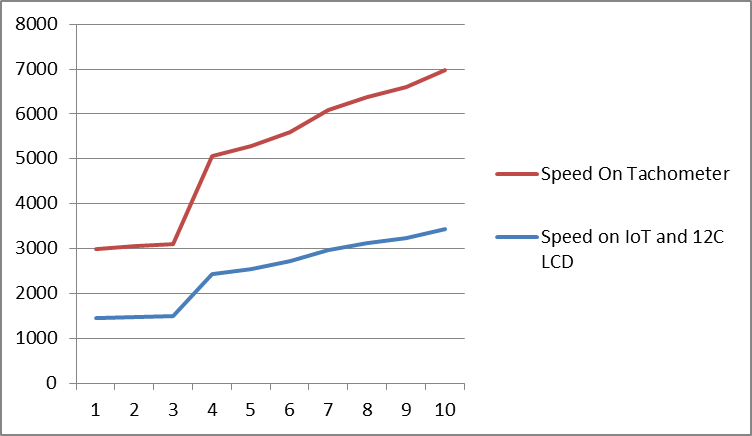
Figure 9. Data test graph in High speed conditions
The reading tests that have been carried out produce quite varied responses, but are still within normal limits. This shows that the tests carried out have been successfully carried out well. The conclusion is that the prototype speed monitoring system for electric cars based on the Internet of Things can function well and can display some car speed data.
The Internet of Things-based speed monitoring system for electric cars implements real-time data display using the Arduino Uno microcontroller and IoT methods as data display devices. As a result, the tool created can display data accurately, with the display data being displayed at all times as long as the power supply receives power input. The speed monitoring system for electric cars based on the Internet of Things is designed and made cheaply with smart technology which can later be developed well and can be used to roduce good and precise displays.
- Conclusion
Based on the research that has been carried out, several conclusions can be drawn, namely. The speed monitoring system in electric cars based on the Internet of Things (IoT) can function well and can display speed remotely. This tool displays data in real time using the Arduino Uno microcontroller and sim800l as a device to send Internet of Things data to Thing Speak remotely. As a result, the tool created can display speed data accurately with the display data being displayed every time as long as the power supply is receiving power input.
REFERENCES
- I. Memon, M. K. Hasan, R. A. Shaikh, J. Nebhen, K. A. A. Bakar, E. Hossain, and M. H. Tunio, “Energy-efficient fuzzy management system for internet of things connected vehicular ad hoc networks,” Electronics, vol. 10, no. 9, p. 1068, 2021, https://doi.org/10.3390/electronics10091068.
- X. Zhao, Y. Ye, J. Ma, P. Shi, and H. Chen, “Construction of electric vehicle driving cycle for studying electric vehicle energy consumption and equivalent emissions,” Environmental Science and Pollution Research, vol. 27, pp. 37395-37409, 2020, https://doi.org/10.1007/s11356-020-09094-4.
- M. A. Hoque and C. Davidson, “Design and implementation of an IoT-based smart home security system,” International Journal of Networked and Distributed Computing, vol. 7, no. 2, pp. 85-92, 2019, https://doi.org/10.2991/ijndc.k.190326.004.
- I. Husain et al., "Electric Drive Technology Trends, Challenges, and Opportunities for Future Electric Vehicles," in Proceedings of the IEEE, vol. 109, no. 6, pp. 1039-1059, 2021, https://doi.org/10.1109/JPROC.2020.3046112.
- M. H. Lipu et al., “Intelligent algorithms and control strategies for battery management system in electric vehicles: Progress, challenges and future outlook,” Journal of Cleaner Production, vol. 292, p. 126044, 2021, https://doi.org/10.1016/j.jclepro.2021.126044.
- M. Batra, J. McPhee, and N. L. Azad, “Real-time model predictive control of connected electric vehicles,” Vehicle System Dynamics, vol. 57, no. 11, pp. 1720-1743, 2019, https://doi.org/10.1080/00423114.2018.1552004.
- H. Zhang and X. Lu, “Vehicle communication network in intelligent transportation system based on Internet of Things,” Computer Communications, vol. 160, pp. 799-806, 2020, https://doi.org/10.1016/j.comcom.2020.03.041.
- F. Mohammadi and R. Rashidzadeh, "An Overview of IoT-Enabled Monitoring and Control Systems for Electric Vehicles," in IEEE Instrumentation & Measurement Magazine, vol. 24, no. 3, pp. 91-97, 2021, https://doi.org/10.1109/MIM.2021.9436092.
- S. M. Shariff, M. S. Alam, F. Ahmad, Y. Rafat, M. S. J. Asghar and S. Khan, "System Design and Realization of a Solar-Powered Electric Vehicle Charging Station," in IEEE Systems Journal, vol. 14, no. 2, pp. 2748-2758, 2020, https://doi.org/10.1109/JSYST.2019.2931880.
- A. Salam, “Internet of things for water sustainability,” In Internet of Things for Sustainable Community Development: Wireless Communications, Sensing, and Systems, pp. 113-145, 2024, https://doi.org/10.1007/978-3-031-62162-8_4.
- D. Jiang, “The construction of smart city information system based on the Internet of Things and cloud computing,” Computer Communications, vol. 150, pp. 158-166, 2020, https://doi.org/10.1016/j.comcom.2019.10.035.
- A. F. Subahi and K. E. Bouazza, "An Intelligent IoT-Based System Design for Controlling and Monitoring Greenhouse Temperature," in IEEE Access, vol. 8, pp. 125488-125500, 2020, https://doi.org/10.1109/ACCESS.2020.3007955.
- J. -A. Jiang et al., "A Novel Sensor Placement Strategy for an IoT-Based Power Grid Monitoring System," in IEEE Internet of Things Journal, vol. 7, no. 8, pp. 7773-7782, 2020, https://doi.org/10.1109/JIOT.2020.2991610.
- A. H. Mohd Aman, N. Shaari, and R. Ibrahim, “Internet of things energy system: Smart applications, technology advancement, and open issues,” International Journal of Energy Research, vol. 45, no. 6, pp. 8389-8419, 2021, https://doi.org/10.1002/er.6451.
- M. K. Hasan, M. M. Ahmed, B. Pandey, H. Gohel, S. Islam, and I. F. Khalid, “Internet of Things‐Based Smart Electricity Monitoring and Control System Using Usage Data,” Wireless Communications and Mobile Computing, vol. 2021, no. 1, pp. 6544649, 2021, https://doi.org/10.1155/2021/6544649.
- N. S. Lestari, A. G. Mahardika, T. Rachman, H. Suhendi, A. H. Mutaqin, and R. Hidayat, “Internet of Things Based Motorcycle Monitoring Application Development,” In Journal of Physics: Conference Series, vol. 1933, no. 1, p. 012098, 2021, https://doi.org/10.1088/1742-6596/1933/1/012098.
- F. Behrendt, “Cycling the smart and sustainable city: analyzing EC policy documents on internet of things, mobility and transport, and smart cities,” Sustainability, vol. 11, no. 3, p. 763, 2019, https://doi.org/10.3390/su11030763.
- M. A. P. Utomo, A. Aziz, and B. Harjito, “Server room temperature & humidity monitoring based on Internet of Thing (IoT),” In Journal of Physics: Conference Series, vol. 1306, no. 1, p. 012030, 2019, https://doi.org/10.1088/1742-6596/1306/1/012030.
- A. A. Awirya, D. P. Sembiring, and B. Kreuta, “The potential development of electric motorcycles in remote areas case study: Agats District, Asmat Regency, Indonesia,” Cleaner Engineering and Technology, vol. 17, p. 100690, 2023, https://doi.org/10.1016/j.clet.2023.100690.
- M. R. Djalal, I. Robandi and M. A. Prakasa, "Stability Enhancement of Sulselrabar Electricity System Using Mayfly Algorithm Based on Static Var Compensator and Multi-Band Power System Stabilizer PSS2B," in IEEE Access, vol. 11, pp. 57319-57340, 2023, https://doi.org/10.1109/ACCESS.2023.3283598.
Internet of Things (IoT) Based Speed Monitoring System for Electric Cars (Rean Andhika Putra)