Buletin Ilmiah Sarjana Teknik Elektro ISSN: 2685-9572
Implementation of Tsukamoto Fuzzy Logic for Watering Interval Control in Mini Greenhouse Temperature and Humidity Monitoring System with Aeroponic Method
Revata Dendi Aurix Pramana, Ahmad Raditya Cahya Baswara
Department of Electrical Engineering, Universitas Ahmad Dahlan, Yogyakarta, Indonesia
ARTICLE INFORMATION |
| ABSTRACT |
Article history: Received 14 June 2024 Revised 15 June 2024 Published 15 September 2024 |
| 
Agriculture in Indonesia faces challenges in the use of modern technology, resulting in a lack of optimisation in land management and crop yields. Greenhouses, also known as 'hothouses', have been developed using environmental sensor technology and microcontrollers to increase the efficiency of crop management. The use of Tsukamoto fuzzy logic is one of the solutions to improve this system. However, the increasingly popular microgreens have the disadvantage of losing nutrients when stored for long periods. Nevertheless, microgreens remain an attractive alternative for urban agriculture with limited land because of their fast growth and high nutrient content, offering more value than buying them from the store. The mini-greenhouse's temperature and humidity monitoring system uses the aeroponic cultivation method and adopts Tsukamoto fuzzy logic control with nine fuzzy rules to manage the watering interval. The temperature and humidity measurement results are sent online to the Internet for real-time monitoring. This research successfully designed an aeroponic system for growing caisim mustard greens, conducted IoT monitoring using ThingSpeak, and implemented watering control using Tsukamoto fuzzy logic. The results showed that the plants reached a height of 25 cm with 9 leaves and a leaf width of 8 cm. The watering interval method effectively reduced the power consumption to 3.6 times lower than 24-hour continuous watering, showing a significant contribution to energy management in aeroponic systems. |
Keywords: Microgreen; Aeroponics; Temperature and Humidity; Tsukamoto Fuzzy Logic |
Corresponding Author: Ahmad Raditya Cahya Baswara, Department of Electrical Engineering, Universitas Ahmad Dahlan, Yogyakarta, Indonesia. Email: ahmad.baswara@te.uad.ac.id |
This work is licensed under a Creative Commons Attribution-Share Alike 4.0 
|
Document Citation: R. D. A. Pramana and A. R. C. Baswara, “Implementation of Tsukamoto Fuzzy Logic for Watering Interval Control in Mini Greenhouse Temperature and Humidity Monitoring System with Aeroponic Method,” Buletin Ilmiah Sarjana Teknik Elektro, vol. 6, no. 3, pp. 223-236, 2024, DOI: 10.12928/biste.v6i3.10809. |
INTRODUCTION
Agriculture plays an important role in an agrarian society like Indonesia [1]-[3]. However, in some areas, farmers have not optimally utilised modern technology for land cultivation, irrigation management, and crop yield improvement. In addition, dependence on unpredictable weather during the harvest period can hinder the achievement of maximum yields for farmers [4]. Greenhouses have become a commonly used technology in agriculture, both by modern farmers and modern researchers [5][6]. Greenhouses, generally use materials such as acrylic, plastic, glass, and other types that can retain light [7]. Thanks to the development of new technologies, such as environmental sensors and affordable microcontrollers, researchers and engineers have managed to improve the efficiency of keeping plants in greenhouses.
In addition, there are methods that can be used to improve this system, one of which is by using the Tsukamoto fuzzy logic method [8][9]. The fuzzy method is a type of logic with two strict values, namely true and false [10]. In fuzzy logic theory, a value can be judged as true or false depending on its membership level in a fuzzy set [11]. Tsukamoto Fuzzy Inference is the process of integrating many rules using existing information [12]. Each rule is represented as a fuzzy set with a monotonous membership function in Tsukamoto fuzzy inference [13].
There are many factors that affect the success of plant cultivation, such as the humidity of the growing medium, air temperature, and light intensity that is adjusted to the type of plant being grown [14][15]. However, many things that were previously considered troublesome are now easier with the help of technology. One example of increasingly popular crop cultivation is microgreen. Microgreens are certain varieties of vegetables that are gaining high popularity in industrialised countries due to their higher nutrient and vitamin content compared to regular cultivated foods [16]. However, in Indonesia, microgreen crops are still not widely known by the public.
There are many factors that affect the success of plant cultivation, such as the humidity of the growing medium, air temperature, and light intensity that is adjusted to the type of plant being grown. However, many things that were previously considered troublesome are now easier with the help of technology. One example of increasingly popular crop cultivation is microgreen. Microgreens are certain varieties of vegetables that are gaining high popularity in industrialised countries due to their higher nutrient and vitamin content compared to regular cultivated foods. However, in Indonesia, microgreen crops are still not widely known by the public.
METHOD
In this research, the focus is given on determining the optimal Tsukamoto Fuzzy Logic Controller rules to regulate the temperature and humidity parameter values with the output on the water pump. This chapter describes the steps taken in the research, including system design, fuzzy rule setting, and implementation of the Tsukamoto Fuzzy Logic Controller that will be used to control the water pump based on temperature and humidity.
Fuzzy Logic Tsukamoto
Tsukamoto Fuzzy Logic Controller is a form of Fuzzy inference system developed by Professor Mamoru Tsukamoto. Tsukamoto FIS uses fuzzy logic-based linguistic rules to convert numerical inputs into numerical outputs [17]. Tsukamoto FIS focuses on system control applications by mapping numerical inputs from the environment into fuzzy values based on certain linguistic conditions or rules or can be called fuzzification [18]. This system applies the principles of fuzzy logic and decision making based on previously defined rules or commonly called defuzzification. In the fuzzyfication process, a triangular curve is used in determining the Tsukamoto FIS model.
- Fuzzyfication
At this stage, the input variables are translated into fuzzy sets using membership functions. This membership function describes the extent to which an input value meets certain criteria in a fuzzy set [19]. Each input variable has one or more fuzzy sets representing its membership level. The input variables are obtained and converted to membership values using appropriate membership functions. Equation (1) shows the fuzzification equation or membership function, and Figure 1 shows the shape of the triangular membership curve.
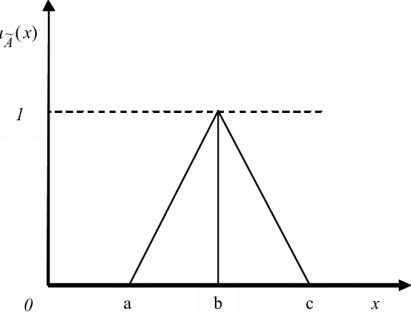
Figure 1. Triangle membership curve
- Inferensi
At this stage, fuzzy rules expressed in the form of human or natural language are used to combine the membership values of the input variables and generate membership values for the output variables [20]. These rules contain "if-then" conditions that relate the input membership values to the output membership values. A commonly used inference method in Tsukamoto fuzzy logic is the min-max method. Equation (2) displays the inference system equation.
| 
| (2) |
- Deffuzifikasi
At this stage, the membership values of the output variables generated at the perturbation stage are converted back into crisp values or concrete values that can be understood and used for decision making [21], [22]. There are several defuzzification methods that can be used, one of which is the centroid method, where the output crisp value is calculated based on the centre of mass or centroid of the output membership function.
Equation (3) shows the defuzzification equation.
| 
| (3) |
The Tsukamoto method also uses triangular or trapezoidal membership functions to represent fuzzy sets on input and output variables. These membership functions describe the relationship between input and output variables with the corresponding degrees of membership. Tsukamoto's fuzzy logic method is very useful in decision making where the existing knowledge is fuzzy or uncertain. By using knowledge-based rules, this method can produce more adaptive and flexible decisions that take into account the diversity of input values and relationships between variables.
System Design
The system design in this study consists of several things including the system block diagram. The system block diagram can be seen in Figure 2. Based on Figure 2, the input component in this system is the DHT22 sensor, which functions to measure the temperature and humidity in the aeroponic mini greenhouse environment. to measure the temperature and humidity in the aeroponic mini greenhouse environment. The data obtained from the sensor is then processed by the ESP32 microcontroller using the obtained from this sensor is then processed by the ESP32 microcontroller using the Tsukamoto Fuzzy Logic method. Logic Tsukamoto method. The purpose of using this method is to set the time interval for watering the plants based on the temperature data. watering plants based on the measured temperature and humidity data. After obtaining the watering interval value, the ESP32 will control the activation of the relay with the interval that has been calculated before. previously.
This relay is responsible for regulating the activation and deactivation of the water pump to water the plants through the sprinkle nozzle. through the sprinkle nozzle to distribute the water evenly. The input component of the system developed in this research is the DHT22 sensor. This sensor functions as an input device that receives and measures the temperature and humidity parameters in the mini aeroponics environment.
Humidity parameters in the mini aeroponics environment. The information collected by the DHT22 sensor is the basic data needed to monitor the environmental conditions in which the plants grow. The processing component of the system developed in this research is a Fuzzy Logic Controller (FLC). Controller (FLC). The FLC acts as a processing element that receives input data from the DHT22 sensor regarding temperature and humidity. DHT22 sensor regarding temperature and humidity. The FLC then performs data processing using predetermined rules, which are then used as a guideline for setting the plant watering time based on.
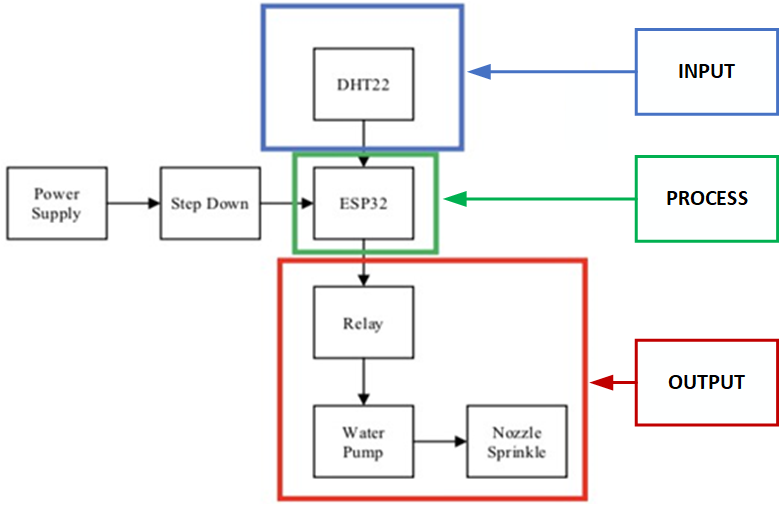
Figure 2. Block diagram
Wiring Diagram System
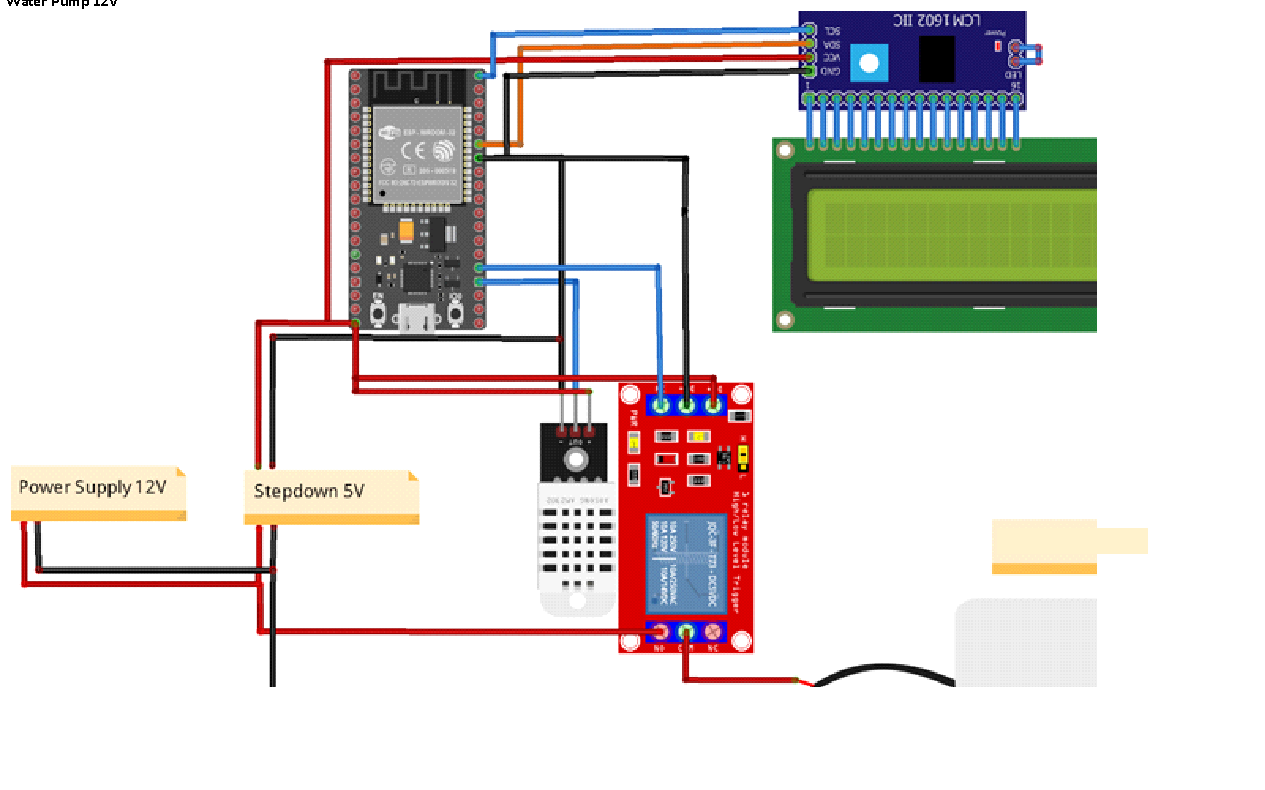
This subchapter discusses the schematic used in this research to visualize the connection or wiring arrangement between the components in the system. A wiring diagram is a graphical representation that shows how the components in the system are connected to each other by wires or connecting lines. In this research, a wiring diagram will be used to clearly explain how each component in the system is connected and interacts with each other. By using a schematic, it will be easier to understand the physical configuration and wiring relationships required to operate the system. Figure 3 shows the system schematic and Table 1 shows the pin usage of the components used in this research.
Table 1. Pin usage table for each component
Initial device | Destination device |
Device Name | PIN | Device Name | PIN |
ESP32 | GND | LCD_I2C | GND |
VIN | LCD_I2C | VCC |
GPIO21 | LCD_I2C | SDA |
GPOI22 | LCD_I2C | SCL |
GPIO15 | DHT22 | OUT |
3V3 | DHT22 | VCC |
GND | DHT22 | GND |
GPIO2 | Relay | OUT |
VIN | Relay | VCC |
GND | Relay | GND |
Power Supply | 12V | Relay | NO |
12V | Stepdown | VCC |
GND | Stepdown | GND |
Stepdown 5V | 5V | ESP32 | VIN |
GND | ESP32 | GND |
Water pump | VCC | Relay | COM |
GND | Power Supply | GND |
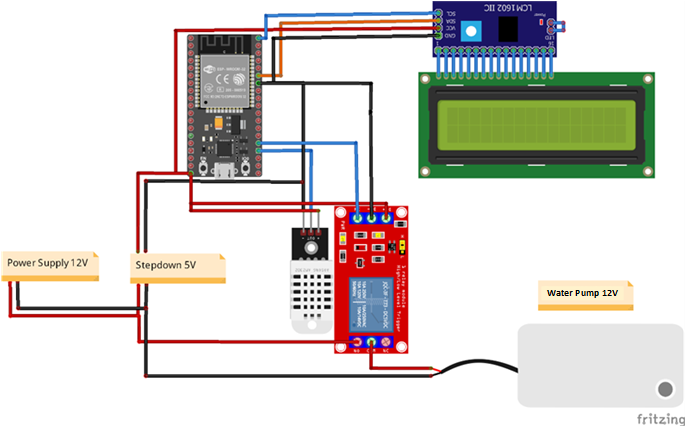
Figure 3. Wiring diagram
Tsukamoto Fuzzy Logic Design
In this section, we will explain the implementation of Tsukamoto fuzzy logic which consists of three main stages: fuzzification, inference, and defuzzification. Each stage plays an important role in transforming numerical inputs into desired outputs through a well-defined fuzzy logic process. Figure 4 displays the temperature membership image, Figure 5 displays the humidity membership image, and Table 2 displays the fuzzy table based on the rules created.
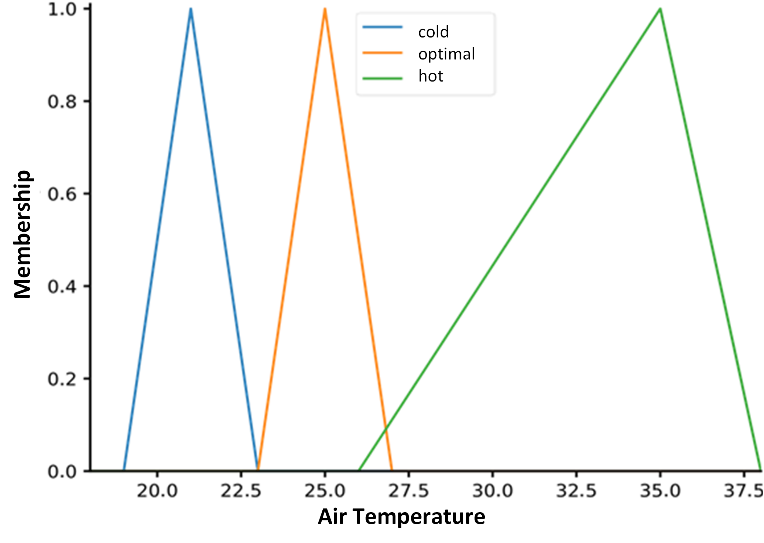
Figure 4. Temperature membership
Based on Figure 4, the y-axis is the logic prediction value in fuzzy logic with a value range of 0 to 1. Meanwhile, the x-axis is the value of the temperature parameter which has 3 memberships, namely cold, optimal and hot. The equations of the three fuzzy members use equation (1) and are shown in equation (4), equation (5), and equation (6).
Based on Figure 5, the y-axis is the logic prediction value in fuzzy logic with a value range of 0 to 1. Meanwhile, the x-axis is the value of the humidity parameter which has 3 memberships, namely dry, optimal and humid. The equations of the three fuzzy members use equation (1) and are shown in equation (7), equation (8), and equation (9).
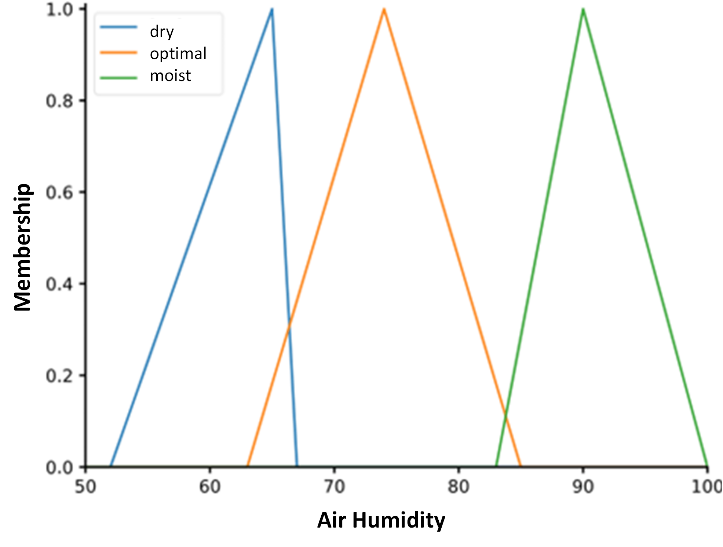
Figure 5. Humidity Membership
Based on Table 2, the given fuzzy rules regulate the time interval based on the combination of temperature and humidity. There are nine rules that classify the time interval into "Fast" (10 minutes), "Medium" (20 minutes), or "Slow" (30 minutes) according to the environmental conditions. When the temperature is cold and the humidity is dry, the time interval is fast. If the temperature is cold and the humidity is optimal, the interval is medium, and if the temperature is cold and the humidity is wet, the interval is slow. Optimum temperature with dry humidity also produces fast intervals, while optimum temperature with optimum humidity produces medium intervals, and humid humidity produces slow intervals. At hot temperatures, both dry and optimal humidity produce fast intervals, but hot temperatures with moist humidity produce medium intervals. These rules help determine the speed or duration of a process based on the existing temperature and humidity conditions.
Table 2. Fuzzy Rules
Ruels | If | Temperature | And | Humidity | So | Interval |
1 | Cold | Dry | Fast |
2 | Cold | Optimal | Medium |
3 | Cold | Moist | Slow |
4 | Optimal | Dry | Fast |
5 | Optimal | Optimal | Medium |
6 | Optimal | Moist | Slow |
7 | Hot | Dry | Fast |
8 | Hot | Optimal | Fast |
9 | Hot | Moist | Medium |
RESULTS AND DISCUSSION
DHT22 Sensor Testing
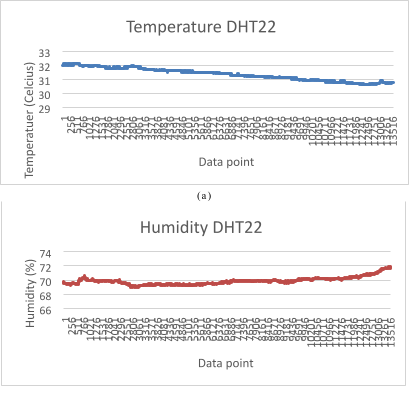
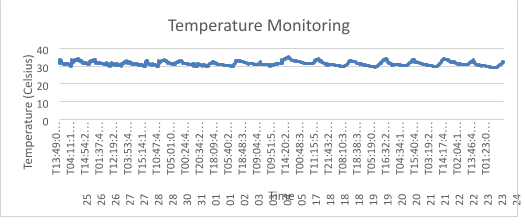
This research was conducted by testing the DHT22 sensor to measure temperature and humidity values. Figure 6(a) and Figure 6(b) display the results of the DHT22 sensor test conducted from 16.00 WIB to 00.00 WIB.
(b)
Figure 6. DHT 22 Testing (a) Temperature, (b) Humidity
From the data depicted in Figure 6(a) and Figure 6(b), the DHT22 sensor shows consistency in temperature and humidity measurements without any loss or interruption of data. From the test results, there is a decrease in temperature especially at night, which can be attributed to the generally lower temperature compared to the evening time. However, humidity values tend to remain stable over the given measurement range.
Fuzzy Logic Tsukamoto Testing
Testing the Fuzzy Logic Controller simulation on the Arduino uses synthetic data presented in the table. The data includes membership values for low (temperature1), optimal (temperature2), and high (temperature3) temperature conditions, as well as membership for low (hum1), optimal (hum2), and high (hum3) humidity. In addition, the table also lists the activation values (ac1 to ac9) of the nine Fuzzy Logic Controller rules that have been implemented, along with the weight, which is the result of multiplying the activation of the rule by its membership. The total activation value (sumac) of the Fuzzy Logic Controller rules and the output results of defuzzification (interval) used as watering time control are also contained in Table 3.The testing process was carried out by simulating different situations of temperature and humidity, allowing observation of the response of the Fuzzy Logic Controller system to variations in input values. This allows for a deeper understanding of how the designed Fuzzy Logic rules affect the system.
Table 3. Simulation fuzzy logic tsukamoto
no | temp | hum | temp1 | temp2 | temp3 | hum1 | hum2 | hum3 | ac1 | ac2 | ac3 | ac4 | ac5 | ac6 | ac7 | ac8 | ac9 | weight | sum ac | interval |
1 | 38 | 85 | 0 | 0 | 1 | 0 | 0 | 0.29 | 0 | 0 | 0 | 0 | 0 | 0 | 0 | 0 | 0.29 | 171428.57 | 0.29 | 10 |
2 | 20 | 30 | 0.12 | 0 | 0 | 0 | 0 | 0 | 0 | 0 | 0 | 0 | 0 | 0 | 0 | 0 | 0 | 0 | 0 | 10 |
3 | 25 | 60 | 0.75 | 0 | 0 | 0.63 | 0 | 0 | 0.63 | 0 | 0 | 0 | 0 | 0 | 0 | 0 | 0 | 1125000 | 0.63 | 30 |
4 | 22 | 70 | 0.37 | 0 | 0 | 0 | 0.64 | 0 | 0 | 0.37 | 0 | 0 | 0 | 0 | 0 | 0 | 0 | 450000 | 0.37 | 20 |
5 | 27 | 75 | 1 | 0 | 0 | 0 | 0.91 | 0 | 0 | 0.91 | 0 | 0 | 0 | 0 | 0 | 0 | 0 | 1090909.12 | 0.91 | 20 |
6 | 20 | 80 | 0.12 | 0 | 0 | 0 | 0.45 | 0 | 0 | 0.12 | 0 | 0 | 0 | 0 | 0 | 0 | 0 | 150000 | 0.12 | 20 |
7 | 26 | 65 | 0.88 | 0 | 0 | 0 | 0.18 | 0 | 0 | 0.18 | 0 | 0 | 0 | 0 | 0 | 0 | 0 | 218181.82 | 0.18 | 20 |
8 | 21 | 68 | 0.25 | 0 | 0 | 0 | 0.45 | 0 | 0 | 0.25 | 0 | 0 | 0 | 0 | 0 | 0 | 0 | 300000 | 0.25 | 20 |
9 | 24 | 72 | 0.63 | 0 | 0 | 0 | 0.82 | 0 | 0 | 0.63 | 0 | 0 | 0 | 0 | 0 | 0 | 0 | 750000 | 0.63 | 20 |
10 | 28 | 78 | 0 | 0 | 0 | 0 | 0.64 | 0 | 0 | 0 | 0 | 0 | 0 | 0 | 0 | 0 | 0 | 0 | 0 | 10 |
11 | 23 | 67 | 0.5 | 0 | 0 | 0 | 0.36 | 0 | 0 | 0.36 | 0 | 0 | 0 | 0 | 0 | 0 | 0 | 436363.65 | 0.36 | 20 |
12 | 19 | 71 | 0 | 0 | 0 | 0 | 0.73 | 0 | 0 | 0 | 0 | 0 | 0 | 0 | 0 | 0 | 0 | 0 | 0 | 10 |
13 | 30 | 62 | 0 | 0.5 | 0.11 | 0.37 | 0 | 0 | 0 | 0 | 0 | 0.37 | 0 | 0 | 0.11 | 0 | 0 | 650000 | 0.49 | 26 |
14 | 18 | 77 | 0 | 0 | 0 | 0 | 0.73 | 0 | 0 | 0 | 0 | 0 | 0 | 0 | 0 | 0 | 0 | 0 | 0 | 10 |
15 | 29 | 68 | 0 | 0.25 | 0 | 0 | 0.45 | 0 | 0 | 0 | 0 | 0 | 0.25 | 0 | 0 | 0 | 0 | 300000 | 0.25 | 20 |
16 | 31 | 74 | 0 | 0.75 | 0.22 | 0 | 1 | 0 | 0 | 0 | 0 | 0 | 0.75 | 0 | 0 | 0.22 | 0 | 1166666.62 | 0.97 | 20 |
17 | 17 | 76 | 0 | 0 | 0 | 0 | 0.82 | 0 | 0 | 0 | 0 | 0 | 0 | 0 | 0 | 0 | 0 | 0 | 0 | 10 |
18 | 16 | 66 | 0 | 0 | 0 | 0 | 0.27 | 0 | 0 | 0 | 0 | 0 | 0 | 0 | 0 | 0 | 0 | 0 | 0 | 10 |
19 | 33 | 79 | 0 | 0.83 | 0.44 | 0 | 0.55 | 0 | 0 | 0 | 0 | 0 | 0.55 | 0 | 0 | 0.44 | 0 | 1187878.75 | 0.99 | 20 |
20 | 22 | 65 | 0.37 | 0 | 0 | 0 | 0.18 | 0 | 0 | 0.18 | 0 | 0 | 0 | 0 | 0 | 0 | 0 | 218181.82 | 0.18 | 20 |
Based on the data in Table 3, which presents the simulation results of twenty tests with various temperature and humidity values, a concrete example can be seen in the 4th test. In this test, the temperature reached 22°C, falling into the temperature1 membership category or μ_suhudingin membership in equation (4) with a membership value of 0.37. Meanwhile, the recorded humidity is 70%, which falls into the hum2 membership or membership μ_optimal humidity in equation (8) with a membership value of 0.64. The result of inference is sumac with a value of 0.63, obtained from the sum of ac1 to ac9. The result of the defuzzification process shows a value of 20, representing the time interval used in this study, measured in minutes.
ThingSpeak Monitoring
After successfully implementing Fuzzy control, the next step was to send real-time temperature and humidity data to the ThingSpeak website. This process is the foundation for continuous monitoring of the measured environmental parameters. This will include a description of the program used to transmit the temperature and humidity data to the ThingSpeak platform, enabling more detailed visualisation and analysis of the measured environmental conditions. Figure 7 shows a view of the ThingSpeak website.
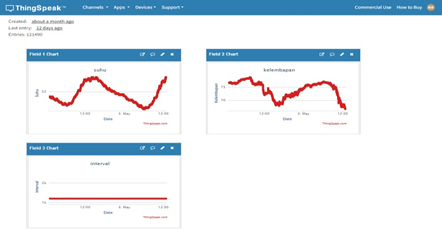
Figure 7. ThingSpeak website view
Based on Figure 7, ThingSpeak monitoring, there are three main parameters displayed: temperature, humidity, and watering interval. These three parameters play a crucial role in monitoring the condition of the aeroponic mini greenhouse in real-time. Temperature provides information on the thermal conditions within the greenhouse, which is important for maintaining an optimal environment for plant growth. Humidity, both in the air and in the growing medium, is a key indicator in ensuring that the plants get enough water content for photosynthesis and other metabolic processes. Meanwhile, watering interval indicates the frequency and duration of watering, which is especially important for aeroponic systems where plant roots are sprayed with water-soluble nutrients at regular intervals. By monitoring these three parameters continuously, we can make the necessary adjustments to create ideal conditions, improve plant growth efficiency, and prevent problems such as heat stress or drought that can hinder productivity.
Plant Results
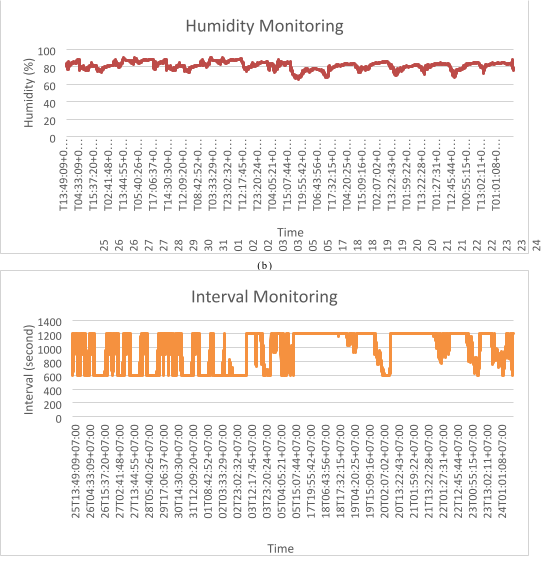
The plants tested were caisim mustard greens with a 5-day seeding treatment. After seeding and then stored in aeroponics. Figure 8 shows the caisim mustard plants after 5 days of seeding. During the planting process, the aeroponics used Fuzzy control to provide watering time interval decisions, as well as monitoring through ThingSpeak. Figure 9(a) shows the temperature, Figure 9(b) shows the humidity, and Figure 9(c) shows the Interval data measured during the 30-day planting period of caisim mustard greens.
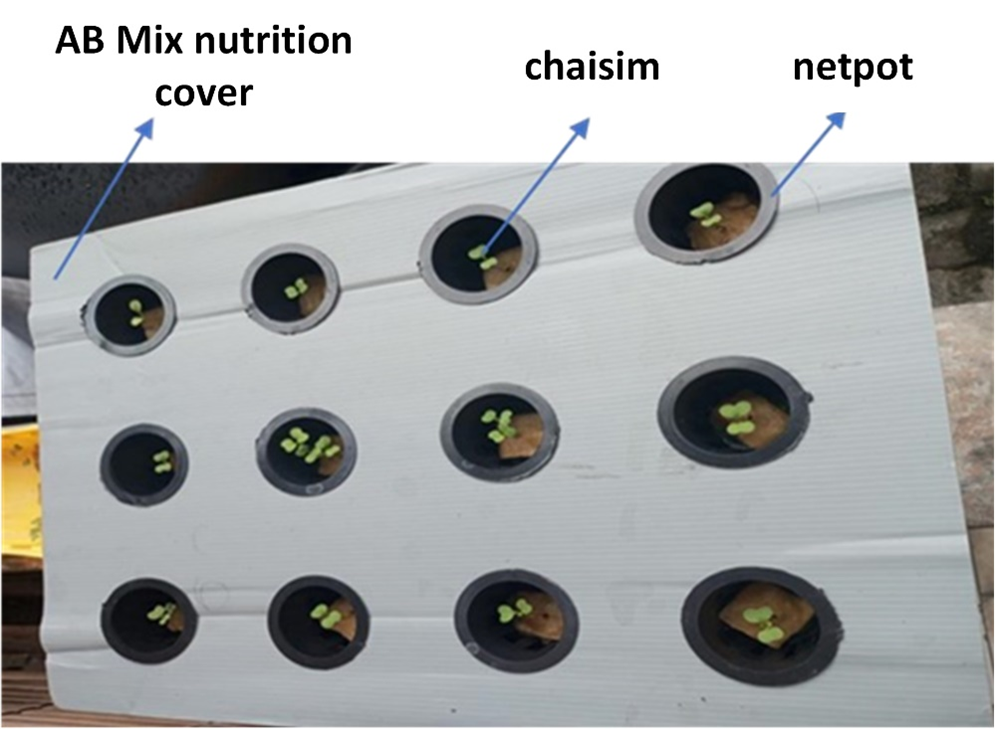
Figure 8. Plants after seeding
|
(a) |
|
(c) |
Figure 9. Monitoring data (a) Temperature, (b) Humidity, and (c) Interval
Based on Figure 9(a) the average temperature during planting was at 31.417 C, with the lowest temperature at 29.037 C and the highest temperature at 35.206 C. While in Figure 9(b) the average humidity during planting time was at 81.24%, with the lowest humidity at 65.7% and the highest humidity at 90.9%.And in Figure 9(c) the average watering interval for 981.807 seconds, with the lowest interval for 600 seconds, and the highest interval for 1200 seconds. As well as the amount of water poured taip times watering is 375 ml.
Table 4 shows the development of caisim mustard plants grown using the aeroponic method, as well as the application of fuzzy control to regulate watering intervals. The recorded data include plant height (cm), number of leaves (leaflets), and leaf width (cm) on each observation day during the test period. Appendix 2 shows the results of the caisim mustard plants.
Table 4. Growth of caisim mustard
Days | Height of Caisim (cm) | Number of leaves (strands) | Leaf width (cm) |
5 | 4 | 3 | 1 |
10 | 10 | 5 | 2 |
15 | 14 | 7 | 4 |
20 | 18 | 8 | 5 |
25 | 22 | 9 | 7 |
30 | 25 | 9 | 8 |
Based on Table 4, on day 5, the plant height reached 4 cm with 3 leaves and 1 cm leaf width. Then, on the 10th day, there was a significant increase where the plant height reached 10 cm with the number of leaves increasing to 5 pieces and the width of the leaves reaching 2 cm. Furthermore, on the 15th day, the development of plants is getting faster with a height of 14 cm, the number of leaves is 7 strands, and the width of the leaves is 4 cm.
On the 20th day, the plants reached a height of 18 cm, with a total of 8 leaves and a leaf width of 5 cm. On the 25th day, the development of the plants got even better with the height reaching 22 cm, the number of leaves 9 pieces, and the width of the leaves 7 cm. Finally, on day 30, the plants reached a maximum height of 25 cm with the number of leaves remaining at 9, but the leaf width increased to 8 cm.
Power Consumption
In order to evaluate the energy efficiency of the pumping system, researchers conducted a series of tests to measure power consumption under two main conditions: when the pump was idle (in monitoring mode) and when the pump was actively operating. The data used for this analysis came from the average of the measurements taken during the test period, which lasted 30 days after seeding. Power consumption testing is important to provide a deeper understanding of how the pump system utilizes energy under various operational conditions. As such, the results of these tests will provide valuable insights in efforts to improve the energy efficiency and overall performance of the pump system.
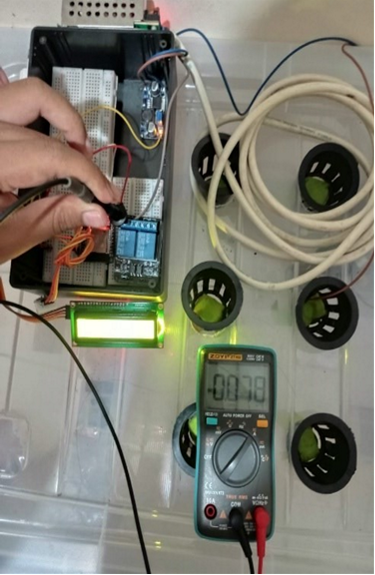
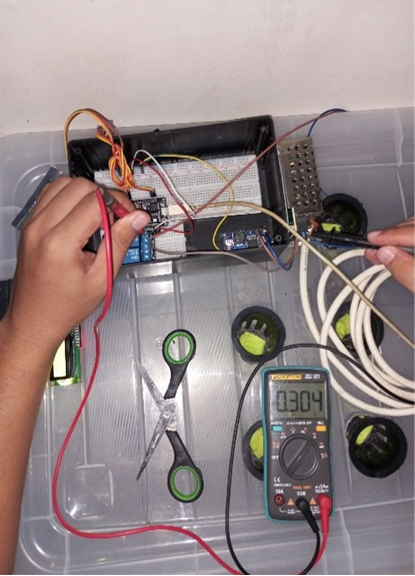
Based on the power consumption test when the idle condition requires an electric current of 78 mA, while when the pump is operating (flushing) requires an electric current of 300 mA. The power consumption testing process is done by directly measuring the output of the 12V power supply, thus measuring the overall power consumption of the pump and ESP32 controller. Figure 10 shows the picture of the electric current collection when the idle condition and the pump are operating.
Based on the measurements in Figure 10, with current measurements, idle power can be obtained by multiplying the idle current by the supply voltage.
Meanwhile, to get the power when the pump operates, it is obtained by multiplying the active current by the supply voltage.
With an average watering interval of 981.807 seconds or rounded up to 982 seconds, during the caisim planting process, the amount of watering per day can be measured by dividing 24 hours by the average interval.
Rounding the number of waterings is because a non-fraction value is needed, so the number of waterings is rounded to 88 times a day, with a watering time of 15 seconds each time. so that the active time for a day is obtained.
And, the power required when the pump operates per day.
The idle power is obtained by subtracting 24 hours from the flush time per day.
So the total power required in a day to use this aeroponics is.
Meanwhile, to operate the pump for 24 hours, the power required per day.
After comparing the power usage when the pump operates for 24 hours with the method that the researchers used, there is a significant difference in power consumption, from 86.4 W to 23.463 W, the difference is almost 4 times lower, or more precisely 3.686 lower power compared to operating the pump for 24 hours. Thus, making the research conducted more efficient.
| 
|
(a) | (b) |
Figure 10. Electric Current (a) idle, and (b) whit pump are operating
CONCLUSION
In this study, researchers successfully designed and implemented an aeroponic system for growing microgreen crops, especially caisim mustard greens. This implementation includes the use of IoT technology through ThingSpeak to monitor temperature and humidity, and the application of Tsukamoto Fuzzy Logic to automatically control watering intervals.
Overall, this research successfully evaluated and optimized the use of modern technology in an aeroponic mini greenhouse for growing microgreen plants. By integrating IoT, Tsukamoto Fuzzy Logic, and watering interval strategies, this research makes a significant contribution to plant growth efficiency and resource management. This is highly relevant in the context of modern agriculture to achieve economically and ecologically better results.
The experimental results showed that caisim mustard plants grown using the aeroponic system exhibited satisfactory growth. The height of the plants reached 25 cm, with the number of leaves 9, and the width of the leaves reached 8 cm, showing a positive development in the control environment of the aeroponic mini greenhouse.
The implemented watering interval method proved effective in optimizing water use and significantly reducing the power consumption of the system. Compared to continuous watering for 24 hours, the use of interval watering reduced power consumption by up to 3.6 times lower. This indicates that the application of watering interval control has great potential in energy management in aeroponic systems for caisim mustard plants.
REFERENCES
- R. A. Nugroho, R. A. Raras, and A. A. Rahmawati, "The Acceptance of Technology in Agriculture: case in Dalangan Village," 2021 IEEE 7th Information Technology International Seminar (ITIS), pp. 1-6, 2021, https://doi.org/10.1109/ITIS53497.2021.9791535.
- N. Liundi, A. W. Darma, R. Gunarso and H. L. H. S. Warnars, "Improving Rice Productivity in Indonesia with Artificial Intelligence," 2019 7th International Conference on Cyber and IT Service Management (CITSM), pp. 1-5, 2019, https://doi.org/10.1109/CITSM47753.2019.8965385.
- E. T. Tosida, Y. Herdiyeni, S. Suprehatin, and Marimin, "The Potential for Implementing a Big Data Analytic-based Smart Village in Indonesia," 2020 International Conference on Computer Science and Its Application in Agriculture (ICOSICA), pp. 1-10, 2020, https://doi.org/10.1109/ICOSICA49951.2020.9243265.
- R. Alfred, J. H. Obit, C. P. -Y. Chin, H. Haviluddin and Y. Lim, "Towards Paddy Rice Smart Farming: A Review on Big Data, Machine Learning, and Rice Production Tasks," in IEEE Access, vol. 9, pp. 50358-50380, 2021, https://doi.org/10.1109/ACCESS.2021.3069449.
- M. S. Farooq, S. Riaz, M. A. Helou, F. S. Khan, A. Abid and A. Alvi, "Internet of Things in Greenhouse Agriculture: A Survey on Enabling Technologies, Applications, and Protocols," in IEEE Access, vol. 10, pp. 53374-53397, 2022, https://doi.org/10.1109/ACCESS.2022.3166634.
- R. Rayhana, G. Xiao and Z. Liu, "Internet of Things Empowered Smart Greenhouse Farming," in IEEE Journal of Radio Frequency Identification, vol. 4, no. 3, pp. 195-211, 2020, https://doi.org/10.1109/JRFID.2020.2984391.
- C. Maraveas, “Environmental Sustainability of Greenhouse Covering Materials,” Sustainability, vol. 11, no 21, p.6129, 2019, https://doi.org/10.3390/su11216129.
- P. Musa, H. Sugeru and H. F. Mufza, "An intelligent applied Fuzzy Logic to prediction the Parts per Million (PPM) as hydroponic nutrition on the based Internet of Things (IoT)," 2019 Fourth International Conference on Informatics and Computing (ICIC), pp. 1-7, 2019, https://doi.org/10.1109/ICIC47613.2019.8985712.
- D. I. Saputra, N. Ismail, F. Gumilang, A. Najmurrokhman and M. T. A. Hakim, "Design and Implementation of RTOS on Multivariable Control of Urban Farming Hydroponic Fertilizer based on Fuzzy Logic," 2022 8th International Conference on Wireless and Telematics (ICWT), pp. 1-5, 2022, https://doi.org/10.1109/ICWT55831.2022.9935357.
- J. M. Mendel, "Fuzzy logic systems for engineering: a tutorial," in Proceedings of the IEEE, vol. 83, no. 3, pp. 345377, 1995, https://doi.org/10.1109/5.364485.
- T. Sutikno, A. C. Subrata and A. Elkhateb, "Evaluation of Fuzzy Membership Function Effects for Maximum Power Point Tracking Technique of Photovoltaic System," in IEEE Access, vol. 9, pp. 109157-109165, 2021, https://doi.org/10.1109/ACCESS.2021.3102050.
- L. T. Hong Lan et al., "A New Complex Fuzzy Inference System With Fuzzy Knowledge Graph and Extensions in Decision Making," in IEEE Access, vol. 8, pp. 164899-164921, 2020, https://doi.org/10.1109/ACCESS.2020.3021097.
- Y. W. Kerk, C. Y. Teh, K. M. Tay and C. P. Lim, "Parametric Conditions for a Monotone TSK Fuzzy Inference System to be an n-Ary Aggregation Function," in IEEE Transactions on Fuzzy Systems, vol. 29, no. 7, pp. 18641873, 2021, https://doi.org/10.1109/TFUZZ.2020.2986986.
- N. Lekbangpong, J. Muangprathub, T. Srisawat and A. Wanichsombat, "Precise Automation and Analysis of Environmental Factor Effecting on Growth of St. John’s Wort," in IEEE Access, vol. 7, pp. 112848-112858, 2019, https://doi.org/10.1109/ACCESS.2019.2934743.
- P. Srivani, Y. Devi C. and S. H. Manjula, "A Controlled Environment Agriculture with Hydroponics: Variants, Parameters, Methodologies and Challenges for Smart Farming," 2019 Fifteenth International Conference on Information Processing (ICINPRO), pp. 1-8, 2019, https://doi.org/10.1109/ICInPro47689.2019.9092043.
- G. Saha, "Technological Influences on Monitoring and Automation of the Hydroponics System," 2021 Innovations in Power and Advanced Computing Technologies (i-PACT), pp. 1-8, 2021, https://doi.org/10.1109/i-PACT52855.2021.9696519.
- N. Joshi, A. Kumar, D. Minenkov, D. Kaplun, and S. C. Sharma, "Optimized MAC Protocol Using Fuzzy-Based Framework for Cognitive Radio AdHoc Networks," in IEEE Access, vol. 11, pp. 27506-27518, 2023, https://doi.org/10.1109/ACCESS.2023.3256890.
- Y. Wang, J. -R. Chardonnet, F. Merienne, and J. Ovtcharova, "Using Fuzzy Logic to Involve Individual Differences for Predicting Cybersickness during VR Navigation," 2021 IEEE Virtual Reality and 3D User Interfaces (VR), pp. 373-381, 2021, https://doi.org/10.1109/VR50410.2021.00060.
- F. Jiménez, C. Martínez, E. Marzano, J. T. Palma, G. Sánchez, and G. Sciavicco, "Multiobjective Evolutionary Feature Selection for Fuzzy Classification," in IEEE Transactions on Fuzzy Systems, vol. 27, no. 5, pp. 1085-1099, 2019, https://doi.org/10.1109/TFUZZ.2019.2892363.
- Y. Zheng, Z. Xu, and X. Wang, "The Fusion of Deep Learning and Fuzzy Systems: A State-of-the-Art Survey," in IEEE Transactions on Fuzzy Systems, vol. 30, no. 8, pp. 2783-2799, 2022, https://doi.org/10.1109/TFUZZ.2021.3062899.
- M. Schwarz, L. C. Hinske, U. Mansmann, and F. Albashiti, "Designing an ML Auditing Criteria Catalog as Starting Point for the Development of a Framework," in IEEE Access, vol. 12, pp. 39953-39967, 2024, https://doi.org/10.1109/ACCESS.2024.3375763.
- J. N. Kreikemeyer and P. Andelfinger, "Smoothing Methods for Automatic Differentiation Across Conditional Branches," in IEEE Access, vol. 11, pp. 143190-143211, 2023, https://doi.org/10.1109/ACCESS.2023.3342136.
Implementation of Tsukamoto Fuzzy Logic for Watering Interval Control in Mini Greenhouse Temperature and Humidity Monitoring System with Aeroponic Method (Revata Dendi Aurix Pramana)