Buletin Ilmiah Sarjana Teknik Elektro ISSN: 2685-9572
Implementation of Digital Feedback Control with Change Rate Limiter in Regulating Water Flow Rate Using Arduino
Erwin Sitompul 1, Ridha Muhlita Putra 1, Hendra Tarigan 2, Arthur Silitonga 3, Iksan Bukhori 1
1 Study Program of Electrical Engineering, Faculty of Engineering, President University, Indonesia
2 Department of Engineering, Computer Science and Physics, School of Science and Mathematics, Mississippi College, United States of America
3 Karlsruhe Institute of Technology, Karlsruhe, Germany
ARTICLE INFORMATION |
| ABSTRACT |
Article History: Submitted 11 March 2024 Revised 11 April 2024 Accepted 15 April 2024 |
| 
Water flow rate control is crucial in applications where it determines operational efficiency in applications such as agriculture, hydroponics, industrial processes, and hydrology. This research presents two algorithms for a simple and reliable digital water flow control: Error-Sign-based Control (ESC) and Error-Value-based Control (EVC). These algorithms are equipped with a change rate limiter to avoid excessive control output increase. They were compared qualitatively with the conventional digital PID controller. Subsequently, they were implemented and tested in a water circulation system. The control loop consisted of a microcontroller, water flow rate sensor, and submersible DC water pump with a supporting motor driver. The controllers were given a control task to follow a 150-second reference trajectory with a changing set point every 30 seconds. The performance measures of Mean Absolute Error (MAE) and Root Mean Square Error (RMSE) were utilized to assess the performance of the control algorithms. EVC with a change rate limiter of 10% delivered the best performance with an MAE of 0.40 and RMSE of 0.97. EVC provides simple and reliable control of the water flow rate system due to its easy tuning, quick tracking response to set point changes, and solid regulating performance. Further work in the implementation of the control scheme in other applications is encouraged. |
Keywords: Error Feedback; Water Flow Rate; Change Rate Limiter; Mean Absolute Error (MAE);
Root Mean Square Error (RMSE) |
Corresponding Author: Erwin Sitompul, Study Program of Electrical Engineering, Faculty of Engineering, President University, Cikarang, Bekasi, Indonesia. Email: sitompul@president.ac.id |
This work is licensed under a Creative Commons Attribution-Share Alike 4.0 
|
Document Citation: E. Sitompul, R. M. Putra, H. Tarigan, A. Silitonga, and I. Bukhori, “Implementation of Digital Feedback Control with Change Rate Limiter for Water Flow Rate Regulation Using Arduino,” Buletin Ilmiah Sarjana Teknik Elektro, vol. 6, no. 1, pp. 72-82, 2024, DOI: 10.12928/biste.v6i1.10234. |
- INTRODUCTION
Digitalization and automation have significantly impacted all modern aspects of human life through the development of more reliable, and more automated daily-life support systems. Automated systems help humans monitor and regulate certain process quantities without the need for constant supervision [1]. Further, an automated system can be made adaptive to cope with changes within the system or its surroundings so that its outputs always follow the predefined reference values. Flow rate is one of the important process quantities that need to be controlled to match a certain set point [2]. Gas flow rate was monitored and controlled for the optimum operation of a coating furnace [3]. The water flow rate was precisely measured and verified [4]. A feedback control was implemented on a robot to control its liquid pouring flow rate, where complex modeling of the motor, pouring process, and load cell model were presented [5]. The environmental aspect of water scarcity has been addressed [6], where the need for dynamic water flow rate control was addressed. An accurate water flow rate is crucial to the efficiency of a UVC water disinfection system, which has been reported elsewhere [7]. This is true if the process is to be extended to a flowing system. Smart systems in agriculture were implemented to foster and sustain plant growth [8][9]. In hydroponics, necessary nutrients for the plant are supplied through a water circulation system.
The water flow rate through the hydroponic pipes needs to be regulated to a specific value to optimize plant growth and improve resource usage efficiency [9][10]. If the water flow is too fast, it may cause plant damage and root foaming. On the other hand, when the water flow is not adequate, the plants may suffer from nutrient deficiency and become wilted and dwarfed [11][12]. The need for a regulated water flow rate in hydroponics applications has challenged the authors to develop a simple and reliable digital control system. Control algorithms based on error feedback were also proposed to control water flow rate [13][14]. The controllers were required to offer simplicity of tuning for the laymen with only one control parameter while fulfilling the accuracy requirement in water flow rate regulation.
Firstly, a water circulation system was to be built as the platform to implement the digital control system. The system is a closed circulation system, which is used to emulate the common system used in hydroponics applications. The main parts of the control loop consist of a microcontroller, an actuating DC water pump, and a water flow sensor. The pump is commonly used in a hydroponics watering system, while the measurement range of the sensor fulfills the requirement for the aforementioned application. Two feedback control algorithms were devised and then tested to regulate the water flow rate at the test platform: a) the Error-Sign-based Controller with change rate limiter (ESC) and b) the Error-Value-based Controller with change rate limiter (EVC). A number of tests with different controller parameters were conducted. The control performance was measured and analyzed using the two performance indexes: Mean Absolute Error (MAE) and Root Mean Square Error (RMSE) in order to determine the best controller settings. By taking the mean value, both indexes are normalized for each discrete time instant. Furthermore, MAE detects the average distance between the set point and the measurement point, while RMSE detects the presence of outliers in the implementation. The results of this study were expected to encourage future works in the implementation of the proposed control algorithm in applications that need a simple and reliable digital control system.
- METHODS
- Control Algorithms and Performance Measures
A Proportional Integral Derivative (PID) controller is commonly deployed for regulation tasks in many applications [15]. PID controller is of linear origin where the controller output  is calculated based on the magnitude, sum, and change of the control error
  , which is the difference between the reference value or set point
  and the measured process output
  . The discrete version of the PID controller is required in its digital implementation. This is obtained through the discretization of the continuous-time equation using Euler approximation or trapezoidal approximation [15][16]. Thus, the discrete PID controller has 4 parameters that need to be tuned: the proportional gain, integral gain, derivative gain, and sampling time.
To avoid a complex tuning process of the aforementioned four parameters, a control approach based on the change rate of the controller output was proposed in this paper. The change rate limiter was introduced to avoid undesirable sudden changes in control output because it may lead to hardware malfunction or hazard for certain control applications [15][17]. A large change in controller output, theoretically, leads to a fast response of the system. However, from the practical point of view, it can cause unnecessary sudden power demand and current inrush to an electrical actuator [18][19].
In this paper, two controller algorithms with the corresponding change rate limiters were proposed by the authors. The Error-Sign-based Controller with a change rate limiter, denoted by ESC, is shown in Equation (1). The Error-Value-based Controller with a change rate limiter, denoted by EVC, is shown in Equation (2).
| 
| (1) |
| 
| (2) |
The variable u denotes a controller output,  is a control error, and
  is a change rate limiter. The variable
  indicates the discrete time instant. The control error is calculated for each value of time. The controller output for the next sampling period is determined based on: the current controller output, the change rate limiter, and the control error. The output of the ESC depends on the sign of the control error, which can be +1 if the control error is positive or −1 if negative, whereas the output of the EVC depends on the value of the control error.
Compared to PID controllers, ESC and EVC only have 2 parameters to be tuned; the change rate limiter and sampling time. This leads to less time required to tune the suitable parameters, as has been proven elsewhere [20]. In order to tune the parameters of the proposed controllers, the sampling time needs to be determined first. Depending on the transient characteristics of the system, the value between 1/10 and 1/3 of the settling time is adequate. Subsequently, the change rate limiter can be first set to 1% for a less active control action and further increased to a higher value while monitoring the behavior of the controlled system.
The performance of the proposed control algorithms was measured by using the Mean Absolute Error (MAE) and the Root Mean Square Error (RMSE) as shown in Equation (3) and Equation (4).
| 
| (3) |
| 
| (4) |
where k represents discrete time instant and n is the data length under consideration. MAE measures the absolute distance between the set point and process output and serves as the first instrument for the performance comparison between ESC and EVC [18][21]. Due to the quadratic term, RMSE gives more emphasis on large control errors and is useful for detecting the existence of error outliers. If the MAE of the two controllers is very close to each other, then the RMSE can be used as the second instrument to determine a better controller [21].
- System Design and Wiring Diagram
Figure 1 shows the block diagram of the proposed water flow rate control system. The red arrows represent a high-current power flow, while the blue arrows show a low-current power flow or an information flow. Arduino Nano was employed as a microcontroller [22]. The YF-S201 water flow rate sensor with a measurement range between 1 to 30 L/min was used to detect the flow rate. A generic 24-V-DC submersible water pump with a maximum capacity of 13.33 L/min (800 L/hour) was utilized to pump the water. The microcontroller’s limited current delivery capacity (40 mA) necessitates the use of an L298N motor driver [23]. Arduino Nano was powered by an XL6009 voltage regulator. The KY-040 rotary encoder was used to adjust the flow rate manually in case it was needed. An LCD was installed as a user interface of which the brightness can be adjusted using a trimmer potentiometer. The overall system was powered by an external DC power supply.
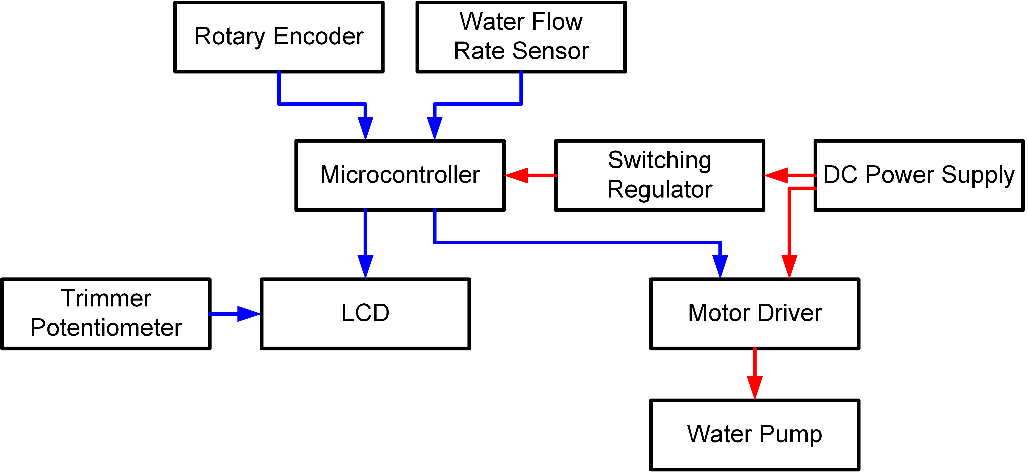
- A block diagram of the proposed system
Figure 2 presents the control loop of the water flow rate control system. The sensor reads the flow rate and delivers the pulse count signal to the controller. This pulse count is read and converted to the flow rate using a calibration factor. The control algorithm calculates the controller output in the range of 0% to 100%. This percentage corresponds to the percentage of the maximum water pump voltage. Following that, Arduino converts the controller output to a Pulse-Width-Modulation (PWM) signal and sends it to the actuators. The actuator consists of a motor driver and water pump. The motor driver provides adequate power to the water pump so that it can flow the water at predetermined current and voltage values.

- A control loop of the proposed system
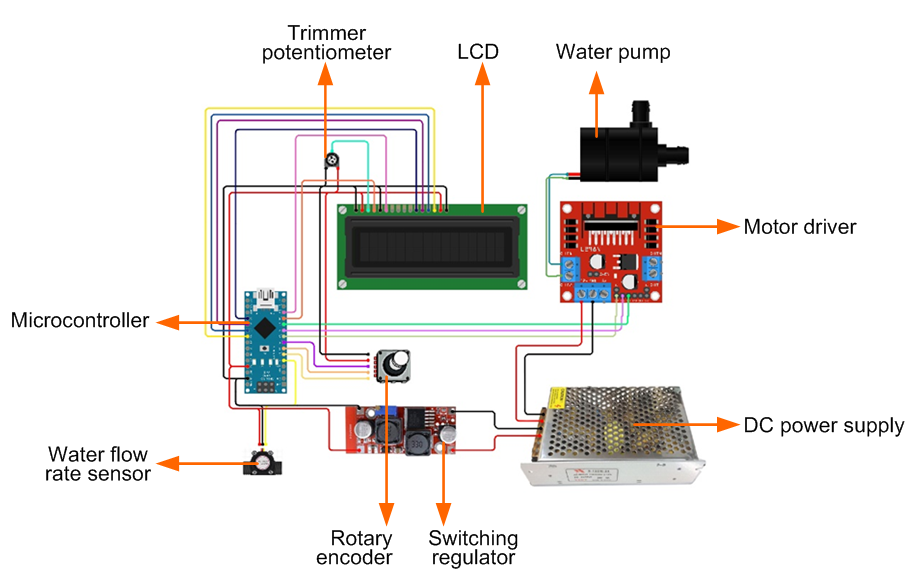
The control algorithms were programmed in Arduino Integrated Development Environment (IDE), which is specifically used to write and upload the code to the physical Arduino Nano board. The computational constraints in implementing the control program were negligible due to its simplicity and low-cost memory requirements. The flowchart of the control program is shown in Figure 3. The interconnection among the parts of the water flow rate control system is shown in Figure 4 in the form of a wiring diagram.
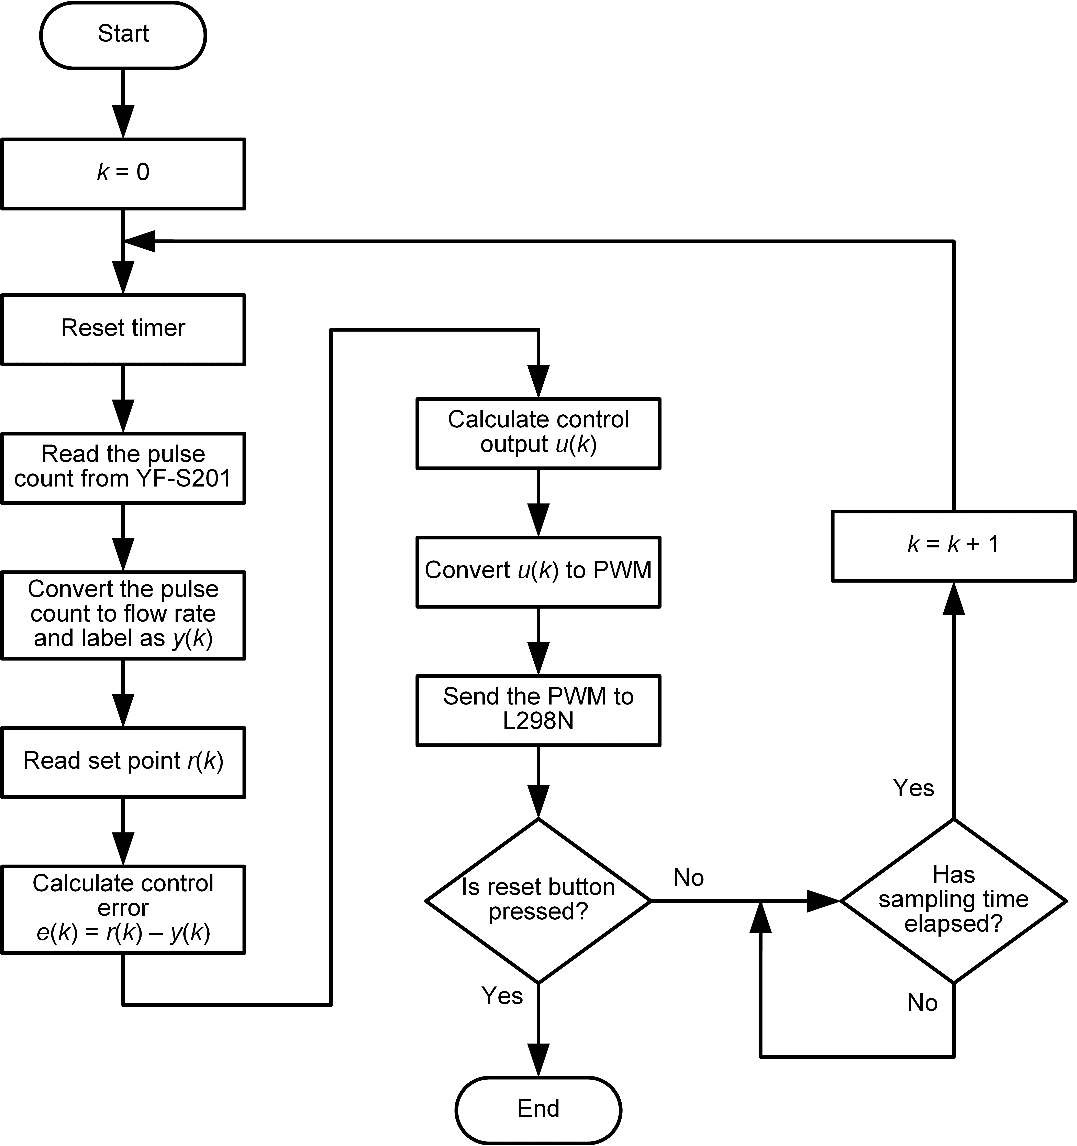
- A flowchart of the control program

- A wiring diagram of the proposed system
- Sensor Calibration Procedure
The YF-S201 water flow rate sensor has a rotor that contains magnet pieces. As the water flows and the rotor rotates, an electric pulse is created when a magnet piece passes through a Hall effect sensor. Therefore, the number of pulses can be used to determine the amount of water flowing through the sensor. However, the correlation between the number of pulses and the flow rate is nonlinear due to the constructional design of the sensor. To overcome this problem, the sensor needs to be calibrated before usage in order to determine the exact flow rate at various pulse counts.
For the calibration purpose in this study, the voltage supplied to the water pump was configured with an increment of 10%, starting from 0% to the maximum value of 100%. The 10% step was considered sufficient to cover the working range of the water pump. In each voltage setting, the water pump was first turned on and then turned off, 1 second after the first pulse count from the sensor was detected. The total pulse count and the amount of water that was pumped were obtained as the intermediate result. The measurement was repeated five times in each voltage setting to obtain and confirm a statistically convergent value. The final result of the calibration process was a calibration factor for each voltage setting, which is the quotient of the pulse count divided by the pumped water volume (L/min).
- RESULTS AND DISCUSSION
- Realization of the Test Platform
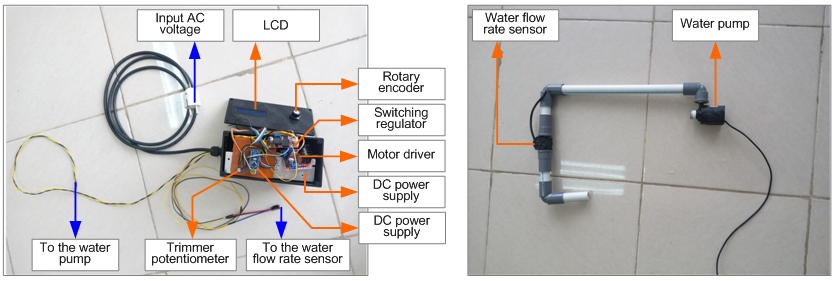
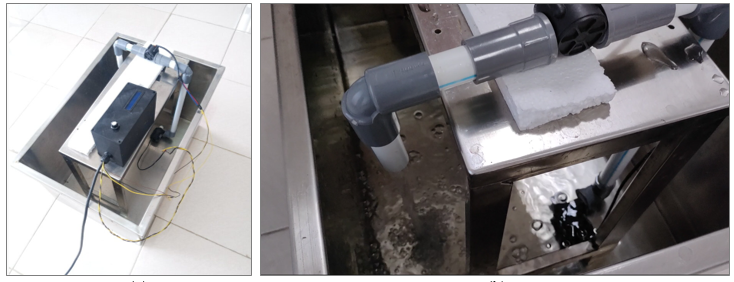
The hardware components mentioned in the previous section were interconnected in this realization step. Most of the components were compactly placed in a utility box as shown in Figure 5 (a). The utility box has 3 external connections to each of the following: the input AC voltage, flow rate sensor, and water pump. Figure 5 (b) shows the 0.5” long water pipe with the installed flow rate sensor and water pump. During the integration, no issues related to compatibility, communication protocols, or signal conditioning were encountered, since all components were compatible with each other.
|
(a) | (b) |
- Hardware setup: (a) Utility box and (b) Water pipe with
a flow rate sensor and a water pump
The fully installed water flow rate control system is shown in Figure 6 (a). In this condition, the system is ready to operate. Firstly, the water container needs to be filled with water. During the operation, water is circulated by the water pump, as shown in Figure 6 (b). Thus, there is no need to further refill the water container.
|
(a) | (b) |
- Completely installed test platform for the water flow rate control system:
(a) Overall view and (b) Close view showing circulating water
- Sensor Calibration
Figure 7 shows the setup of the flow rate sensor calibration. The pumped water flows through the sensor into a measuring tube. The water volume in the measuring tube and pulse count were taken as the intermediate test results. The calibration is precise to the order of milliliters (mL), which is the resolution of the measuring tube. The issues associated with the measurement error and sensor accuracy were expected to be corrected by performing five measurement trials. If the pulse count reading is converging, no further consideration is needed on the repeatability of the calibration process.
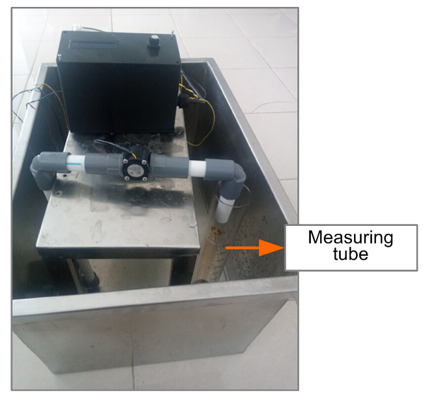
- Calibration of water flow rate sensor
Table 1 shows the experimental data from the flow rate sensor calibration. The calibration factor is the ratio of the pulse count to the flow rate (L/min). The mean calibration flow rate was obtained by averaging the calibration factors of the same water pump input voltage.
The input voltage, which was ≤ 4.8 V (20% of the maximum voltage of the water pump) was not adequate to flow the water within the sensor’s measurement range (1 L/min to 30 L/min). Thus, the set point of the control system had to be made greater than 1 L/min.
- Results of sensor calibration
Input voltage (%) (max. 24 V DC) | Output volume (mL/s) | Flow rate (L/min) | Pulse count | Calibration factor | Mean
calibration factor |
100 | 160 | 9.60 | 74 | 7.708 | 7.604 |
165 | 9.90 | 75 | 7.576 |
160 | 9.60 | 74 | 7.708 |
170 | 10.20 | 76 | 7.451 |
165 | 9.90 | 75 | 7.576 |
90 | 135 | 8.10 | 66 | 8.148 | 8.221 |
135 | 8.10 | 66 | 8.148 |
131 | 7.86 | 65 | 8.270 |
131 | 7.86 | 65 | 8.270 |
133 | 7.98 | 66 | 8.271 |
80 | 127 | 7.62 | 62 | 8.136 | 8.122 |
126 | 7.56 | 61 | 8.069 |
127 | 7.62 | 62 | 8.136 |
125 | 7.50 | 61 | 8.133 |
127 | 7.62 | 62 | 8.136 |
70 | 120 | 7.20 | 56 | 7.778 | 7.793 |
120 | 7.20 | 56 | 7.778 |
121 | 7.26 | 57 | 7.851 |
120 | 7.20 | 56 | 7.778 |
120 | 7.20 | 56 | 7.778 |
60 | 110 | 6.60 | 51 | 7.727 | 7.715 |
112 | 6.72 | 52 | 7.738 |
110 | 6.60 | 51 | 7.727 |
111 | 6.66 | 51 | 7.658 |
110 | 6.60 | 51 | 7.727 |
50 | 105 | 6.30 | 49 | 7.778 | 7.744 |
104 | 6.24 | 48 | 7.692 |
105 | 6.30 | 49 | 7.778 |
105 | 6.30 | 49 | 7.778 |
104 | 6.24 | 48 | 7.692 |
40 | 90 | 5.40 | 37 | 6.852 | 6.926 |
91 | 5.46 | 38 | 6.960 |
89 | 5.34 | 37 | 6.929 |
90 | 5.40 | 37 | 6.852 |
90 | 5.40 | 38 | 7.037 |
30 | 60 | 3.60 | 26 | 7.222 | 7.206 |
62 | 3.72 | 27 | 7.258 |
60 | 3.60 | 26 | 7.222 |
60 | 3.60 | 26 | 7.222 |
61 | 3.66 | 26 | 7.104 |
20 | 16 | 0.96 | 10 | 10.417 | 10.334 |
15 | 0.90 | 9 | 10.000 |
16 | 0.96 | 10 | 10.417 |
16 | 0.96 | 10 | 10.417 |
16 | 0.96 | 10 | 10.417 |
- Control Algorithm Tests
In this stage, the proposed digital control algorithms, ESC and EVC, were tested using the constructed test platform. For this purpose, a reference trajectory was designed to change a value every 30 seconds. The reference trajectory was chosen to test the ability of the control algorithms in terms of tracking ability and regulating ability. At  = 0 s, the set point was set to 4 L/min. Then, it was changed to 6 L/min at
  = 30 s. Afterward, at
  = 60 s the set point was changed to 8 L/min before it was decreased to 3 L/min at
  = 90 s and back to 0 L/min at
  = 120 s. Thus, every test took 150 s to complete. The control algorithms were expected to regulate the system’s flow rate to quickly follow a new set point value and maintain the flow rate closely at that value.
ESC and EVC were tested to follow the aforementioned reference trajectory in three different values of the change rate limiter  : 1%, 5%, and 10%. The larger the change rate limiter, the more active a controller will become and the faster it gets in responding to process changes such as set point changes or disturbances. On the other hand, an active controller may bring the process to an oscillating state and become susceptible to noise. The tendency of the control performance to have a negative or positive value due to the change rate limiter was to be detected by the chosen performance measure, MAE and RMSE. The experiment limited its coverage to one experiment per parameter setting. Further studies are encouraged to include statistical analysis to determine the significance and correlation of the observed differences.
Figure 8 shows the test result for  = 1% (refer to Equation (1) and Equation (2)). Figure 8 (a) shows the set point (blue line) and process output using ESC (green line) and process output using EVC (red line). Here, the process output is meant as the flow rate with the unit of L/min. The corresponding controller output (% water pump voltage) can be seen in Figure 8 (b). The same test procedure was repeated for
  = 5% and
  = 10%. The test results are shown in Figure 9 and Figure 10.


(a) (b)
- Control algorithm test results with a change rate limiter of 1%:
(a) Set point and the process outputs and (b) Controller outputs

(a) (b)
- Control algorithm test results with a change rate limiter of 5%:
(a) Set point and the process outputs and (b) Controller outputs

(a) (b)
- Control algorithm test results with a change rate limiter of 10%:
(a) Set point and the process outputs and (b) Controller outputs
Table 2 summarizes the performance measures of MAE and RMSE for the control algorithms ESC and EVC in three different values of the change rate limiter: 1%, 5%, and 10%. All three numbers are obtained from the numerical data processing previously presented in the form of graphs in Figure 7, Figure 8, and Figure 9.
- Performance measures of ESC and EVC for three different values of change rate limiter
Change rate
limiter | MAE (L/min) | RMSE (L/min) |
ESC | EVC | ESC | EVC |
1% | 3.18 | 1.22 | 3.49 | 1.71 |
5% | 0.90 | 0.46 | 1.63 | 1.09 |
10% | 0.83 | 0.40 | 1.44 | 0.97 |
- Discussion
- Sensor Calibration
As presented in Table 1, the calibration process was considerably accurate where in five trials of the same input voltage the output volumes only differed by the maximum of 10 mL/s (between 160 mL/s and 170 mL/s) and the pulse counts only differed by the maximum of 2 counts (between 74 and 76), both occurred when the input voltage was set to 100% (24 V). In all other values of input voltage, the output volumes differed by less than or equal to 4 mL/s and 1 pulse count.
Figure 11 shows the graph of mean calibration factor versus pulse count, as also given in Table 1. The graph shows the nonlinear relationship between the mean calibration factor and the pulse count. For the pulse count between 26 and 75, the mean calibration factor varies between 6.926 and 8.221. Thus, the pump operation within the range of 30% to 100% of the maximum water pump voltage is preferable to obtain a small variation of mean calibration factor and thus reduce measurement error.
During the control algorithm implementation, the mean calibration factor was determined from the pulse count reading of the sensor. Firstly, the closest calibration pulse count in Figure 10 to the pulse count reading was selected. Then, the corresponding mean calibration factor of that calibration pulse count was used to convert the pulse count reading to the flow rate. The flow rate was given as the pulse count reading divided by the mean calibration factor.
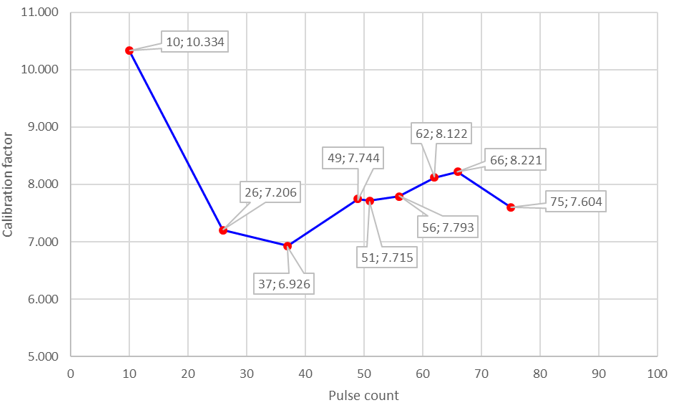
- The relationship between the mean calibration factor and pulse count
- Controller Tests
Figure8 suggests that the water pump voltage has to reach around 25%-28% before water flow can be detected (see the dashed indicator lines). The value of change rate limiter  = 1% is too small to allow ESC to follow the increase and the decrease of the set point. With the same
  , EVC performs better than ESC, but cannot reach the set points of 4 L/min, 6 L/min, and 8 L/min within 30 seconds. Figure 9 shows the controller test results when the flow rate was controlled by ESC and EVC where
  = 5%. Here, ESC is able to follow the set point but with oscillations around the set points. EVC performs better with less oscillation and more constant controller output. However, there is a big overshoot spike at the beginning, where the flow rate reaches 8 L/min. The performance of both controllers for
  = 10%, as shown in Figure 10 is marked by an increase in the oscillation around the set point for ESC, but a decrease for EVC. The overshoot spike at the beginning of EVC operation is reduced to 7 L/min. The controller output for ESC fluctuates heavily along the test, while EVC is able to maintain the controller output within a narrow range for most duration of the test. Oscillations and spikes can be tracked to the error windups effect due to the strong nonlinearity of the water pump in low voltages, which cannot be avoided.
Analysis of the data in Table 2 suggests that the performance measures MAE and RMSE deliver a clear trend for the increasing value of the change rate limiter. For both controllers, MAE and RMSE decrease as  increases. Furthermore, EVC is always better than ESC, in terms of MAE and RMSE values. This may be traced back to the fact that the output of ESC can only change with a fixed percentage according to the value of
  . For instance, if
  = 5%, then the controller output may only change by ± 5% of the current water pump voltage. On the other hand, the output of EVC may change freely according to the control error value, allowing the change within a fraction of
  . Due to the bounded input bounded output (BIBO) property of the water circulation system, the control loop stability was not a concern and indeed the system was stable at all times in that respect. Furthermore, the transient response characteristics and the disturbance rejection in the form of set point changes were reflected in the magnitude of MAE and RMSE.
A low value of performance indexes of MAE or RMSE positively correlates with good tracking accuracy and good disturbance rejection. In this study, the MAE directly shows the mean control error in each second. Considering 5 changes of set point value along a test, the MAE values equaling 0.40 L/min and 0.46 L/min for EVC are excellent. This MAE will be significantly lower if the set point is held constant for the entire test duration. The simultaneous consistent decrease of MAE and RMSE values as the change rate increases indicates that the flow rate control system does not have any outlier problems [23]. In this case, no large control errors were compensated by small control errors to reach the lower mean of control errors. On the contrary, the control errors are collectively lower as  increases.
- CONCLUSIONS
Two digital control algorithms with a change rate limiter: Error-Sign-based Control (ESC) and Error-Value-based Control (EVC) were proposed in this paper. The objective was to provide a simple and suitable control for applications that need a regulated flow rate such as resource rationing, chemical processes, agriculture, and farming. The control algorithms offer easy tuning with the change rate limiter as the only control parameter that concurrently features the negative effect restriction of excessive and sudden increases in controller output. A water circulation process to emulate a hydroponic process was constructed with the main components of an Arduino microcontroller, Hall effect water flow sensor, and submersible DC water pump. The controllers ESC and EVC were applied to regulate the process to follow a reference trajectory in three 150-s tests. The set point was changed every 30 seconds to check the tracking and regulating ability of the controllers. Two performance measures: Mean Absolute Error (MAE) and Root Mean Square Error (RMSE) were used to assess the controllers. The experiment results show that the MAE and RMSE decrease as the change rate limiter increases. Furthermore, EVC performed better than ESC for all values of the change rate limiter. The EVC with the change rate limit of 10% yielded the best result with an MAE of 0.40 and an RMSE of 0.97. The EVC with a 10% change rate limiter is recommended as the best to be implemented in water flow rate control within the test setup. Future works include more experiments for different values of the change rate limiter and the EVC implementation in other applications to confirm its generalization, simplicity, and performance. The versatility of the water circulation system can be increased by the integration of the Internet-of-Things (IoT) so that the users can monitor the process and conduct control adjustments anytime anywhere provided that the internet connection is available.
REFERENCES
- C. W. Lumoindong and E. Sitompul, “A prototype of an IOT-based pet robot with customizable functions (CoFiBot V2),” International Journal of Mechanical Engineering and Robotics Research, pp. 510–518, 2021, https://doi.org/10.18178/ijmerr.10.9.510-518.
- J. Kassila, N. Khallaf, K. Knibass, F. E. Aamri, and Y. Ouagajjou, “Effect of water flow rate on nursing spat mussels, mytilus galloprovincialis,” Thalassas: An International Journal of Marine Sciences, vol. 39, no. 2, pp. 1237–1243, 2023, https://doi.org/10.1007/s41208-023-00559-0.
- Z. Jianhui and C. Xin, “Monitoring and control of gas flow rate in a pyrocarbon coating furnace for heart valves,” in Proc. of International Conference on Consumer Electronics, Communications and Networks (CECNet), 2011, https://doi.org/10.1109/CECNET.2011.5768609.
- J. Ma and Y. Chen, “Influence of verification volume and flow rate on verification facility for water meters of piston,” in Proc. of the 19th International Flow Measurement Conference 2022 on Flow Measurement - FLOMEKO 2022, 2023, https://doi.org/10.21014/tc9-2022.074.
- Y. Sueki and Y. Noda, “Development of flow rate feedback control in tilting-ladle-type pouring robot with direct manipulation of pouring flow rate,” in Proc. of the 16th International Conference on Informatics in Control, Automation and Robotics, 2019, https://doi.org/10.5220/0007951004600467.
- E. A. Feukeu, L. L. Snyman, and H. Twinomurinzi, “Overcoming water scarcity with dynamic water flow rate control (DWFRC),” International Journal of Social Ecology and Sustainable Development, vol. 13, no. 1, pp. 1–16, 2022, https://doi.org/10.4018/IJSESD.289642.
- D.-K. Kim and D.-H. Kang, “Investigation of a new UVC leds array continuous type water disinfection system for inactivating escherichia coli O157:H7 according to flow rate and electrical energy efficiency analysis,” Food Control, vol. 119, p. 107470, 2021, https://doi.org/10.1016/j.foodcont.2020.107470.
- M. Galina, C. Safitri, I. Bukhori, A. Silitonga, and A. Suhartomo, “An an implementation of smart agriculture for optimizing growth using Sonic Bloom and IoT integrated,” Jurnal Infotel, vol. 14, no. 1, pp. 65–74, 2022, https://doi.org/10.20895/infotel.v14i1.725.
- G. Swaminathan and G. Saurav, “Development of sustainable hydroponics technique for urban agrobusiness,” Evergreen, vol. 9, no. 3, pp. 629–635, 2022, https://doi.org/10.5109/4842519.
- Vagisha, E. Rajesh, S. Basheer, and K. Baskar, “Hydroponics soilless smart farming in improving productivity of crop using Intelligent Smart Systems,” in Proc. of 3rd International Conference on Innovative Practices in Technology and Management (ICIPTM), 2023, https://doi.org/10.1109/ICIPTM57143.2023.10117747.
- J. Li, Z. Mao, Z. Cao, K. Tei, and S. Honiden, “Self-adaptive hydroponics care system for human-hydroponics coexistence,” in Proc. of IEEE 3rd Global Conference on Life Sciences and Technologies (LifeTech), 2021, https://doi.org/10.1109/LifeTech52111.2021.9391909.
- G. Niu and J. Masabni, “Hydroponics,” Plant Factory Basics, Applications and Advances, pp. 153–166, 2022, https://doi.org/10.1016/B978-0-323-85152-7.00023-9.
- I. Aksikas, “Error-feedback temperature regulation for a reverse flow reactor driven by a distributed parameter exosystem,” Journal of Process Control, vol. 117, pp. 132–139, 2022, https://doi.org/10.1016/j.jprocont.2022.07.010.
- A. Alotaibi, A. Alkandri, and M. Alsubaie, “Load disturbance conditions for current error feedback and past error feedforward state-Feedback Iterative Learning Control,” Intelligent Control and Automation, vol. 12, no. 02, pp. 65–72, 2021, https://doi.org/10.4236/ica.2021.122004.
- J. Moreno-Valenzuela, R. Pérez-Alcocer, M. Guerrero-Medina and A. Dzul, “Nonlinear PID-Type Controller for Quadrotor Trajectory Tracking, “ IEEE/ASME Transactions on Mechatronics, vol. 23, no. 5, pp. 2436-2447, 2018, https://doi.org/10.1109/TMECH.2018.2855161.
- X. Kuang, X. Huan, H. Xiao, and Y. Xu, “Simple modeling of a novel fuzzy memristor PID controller,” in Proc. of 3rd International Conference on Electronic Information Engineering and Computer (EIECT), 2023, https://doi.org/10.1109/EIECT60552.2023.10441986.
- L. Chirco and S. Manservisi, “On the optimal control of stationary fluid–structure interaction systems,” Fluids, vol. 5, no. 3, p. 144, 2020, https://doi.org/10.3390/fluids5030144.
- M. Wessberg, T. Vyhlídal, and T. Broström, “Humidity change rate control in intermittently heated historic buildings,” E3S Web of Conferences, vol. 172, p. 15004, 2020, https://doi.org/10.1051/e3sconf/202017215004.
- V. N. Chernukha, S. M. Kastersky, and A. V. Suvorov, “Synthesis of pressure rate-of-change limits control in Pressurized Aircraft Cabin,” Science Intensive Technologies, 2022, https://doi.org/10.18127/j19998465-202206-05.
- A. H. Akbar, A. Ma’arif, C. Rekik, A. J. Abougarair, and A. M. Mekonnen, “Implementing PID Control on Arduino Uno for Air Temperature Optimization”, Buletin Ilmiah Sarjana Teknik Elektro, vol. 6, no. 1, pp. 1–13, 2024, https://doi.org/10.12928/biste.v6i1.9725.
- S. F. AL-Azzawi and M. M. Aziz, “Strategies of linear feedback control and its classification,” TELKOMNIKA (Telecommunication Computing Electronics and Control), vol. 17, no. 4, p. 1931, 2019, https://doi.org/10.12928/telkomnika.v17i4.10989.
- M. Galina, G. E. Prasetyo, E. Sitompul, and A. Suhartomo, “Automatic door lock with hand cleaning and infra-red temperature detection system,” ELKOMIKA: Jurnal Teknik Energi Elektrik, Teknik Telekomunikasi, & Teknik Elektronika, vol. 10, no. 2, p. 364, 2022, https://doi.org/10.26760/elkomika.v10i2.364.
- T. Tongskulroongruang and T. Jennawasin, “A comparative study of several ph control laws implemented to a smart hydroponics farm,” in Proc. of 22nd International Conference on Control, Automation and Systems (ICCAS), 2022, https://doi.org/10.23919/ICCAS55662.2022.10003913.
Implementation of Digital Feedback Control with Change Rate Limiter (Erwin Sitompul)