Buletin Ilmiah Sarjana Teknik Elektro ISSN : 2685-9572
Designing a Monitoring System and Optimizing Water Quality in Tilapia Farming Ponds in Pohkecik Hamlet Using Ubidots
Muhammad Taufik Nur Efendi, Indah Sulistiyowati, Syamsudduha Syahrorini, Izza Anshory
Department of Electrical Engineering, Universitas Muhammadiyah Sidoarjo, East Java, Indonesia
ARTICLE INFORMATION |
| ABSTRACT |
Article History: Submitted 16 January 2024 Revised 21 February 2024 Accepted 02 March 2024 |
| 
There are several important factors to increase the success rate of tilapia farming. Among them is the regulation of water quality in the pond, which is still mostly done manually. Therefore, a water quality management tool for Ubidots-based tilapia fish farming ponds is made to facilitate tilapia fish farmers in regulating the quality of pond water automatically. so the importance of water quality management of tilapia fish farming ponds is a follow-up to reduce the failure rate in the cultivation process. The components used in this tool are Esp32 as a microcontroller, ph sensor as a water ph value detector, DS18B20 temperature sensor as water temperature detection and turbidity sensor as a water turbidity value detector, Ultrasonic sensor as a pool water level detector, LCD to display the value detected by the sensor, solenoid valve and water pump that functions to drain and fill the pool water. The conclusion of the results obtained from this device is that the device works well and helps tilapia fish farm owners to monitor and control water quality efficiently, although there are some obstacles such as delays due to internet connections. so maybe in the future it can add a solar cell as a power supply for the automatic control process in this system. |
Keywords: ESP 32; Water Quality Control; Water Level Control; Monitoring Ubidots |
Corresponding Author: Indah Sulistiyowati Department of Electrical Engineering, Faculty of Science and Technology Universitas Muhammadiyah Sidoarjo, East Java, Indonesia. Email: indah_sulistiyowati@umsida.ac.id |
This work is licensed under a Creative Commons Attribution-Share Alike 4.0 
|
Document Citation: M. T. N. Efendi, I. Sulistiyowati, S. Syahrorini, and I. Anshory “Designing a Monitoring System and Optimizing Water Quality in Tilapia Farming Ponds in Phokecik Hamlet Using Ubidots,” Buletin Ilmiah Sarjana Teknik Elektro, vol. 6, no. 1, pp. 34-44, 2024, DOI: 10.12928/biste.v6i1.10090. |
- INTRODUCTION
Water is the source of life for the living creatures of this world, just as fish have ecosystems that live in the water[1]. Fisheries is one of the most promising business sectors in the world [2]. Many communities have opened up fish farming such as Lele, Nile, Koi, and others [3]. This fish farming cultivation can be done in narrow and shallow ponds such as concrete ponds, or tarpaulin ponds [4]. The fish farming process in some areas still uses a manual system [5].
The tilapia breeding process also takes into account several important factors to increase the success rate of the tilapia breeding process. Some of these important factors are the timing of tilapia feeding and water quality management [6]. In this case, water quality management is still done manually. So with this comes an innovation that can help humans in the tilapia breeding process by utilizing current technological advances, namely providing a system that is carried out automatically such as a control system for the process of draining and filling pond water automatically [7].
This technological innovation is expected to increase the success parameters of the tilapia cultivation process [8]. The application of this innovation is carried out in Tilapia fish farming ponds in Pasuruan district. By innovating automatic water quality settings such as maintaining water acidity, water temperature, and pond water turbidity, it is expected to have a positive impact on tilapia fish farming business actors to produce high-quality fish harvests [9].
UBIDOTS-based tilapia pond water quality monitoring and automation system is a fish pond water quality monitoring and automation system that is useful for fish pond farmers to carry out the process of regulating pond water quality automatically. So that the use of the Ubidots platform as a monitoring system has advantages compared to other monitoring systems, such as ease of use, already integrated with the development board, and able to manage devices simultaneously and store data in graphical form [10].
This system works by monitoring the quality of pool water by observing the level of water acidity, water temperature, and water viscosity, and the system automatically performs the process of changing pool water [11]. In recent years, the use of automatic technology in fish ponds has grown, and many studies have been conducted to design and develop more effective and efficient automatic control systems [12].
This research is based on literacy on some previous research to improve, update, and solve problems that have been studied. In previous studies, the use of water quality monitoring systems using LDR sensors as water clarity monitors [13]. The study was found to be less effective than the study carried out by the author because it used a more precise turbidity sensor than the LDR sensor and used Ubidots to monitor and automatically control the water quality in real time [14].
Previous researchers explained the use of the Wake Up Design temperature and pH control system using the Arduino R3 as its control center [15]. This is considered less effective in monitoring because it still uses LCD. While the author uses the Ubidots platform that can monitor in real-time as well as can control automatically [16]. In this case, the technology for the Nile cultivation pool was initially done manually so that it could be automated [17]. This research aims to help Tilapia fish farming businesses by automatically controlling and monitoring pond water quality in real-time and remotely [18],[19]. Ubidots platforms are also easy to operate in monitoring pool water quality so they can be more efficient [20].
- METHODS
Research and Development (R&D) is a research method used to update and develop previous research by analyzing previous research to make improvements and upgrades so that new results are obtained that are effective and functional for the general public. In this chapter there are three processes namely the creation of a block diagram, the preparation of flowcharts, and finally the design of the wiring of the diagram to be used. Each process has a different purpose, but in the end, these three processes are continuous with the ultimate goal being to create a tool that can work effectively so that it is beneficial for those engaged in fish farming.
System Design
The block diagram of this research is made to facilitate the design and manufacture of tools as shown in Figure 1. The input component consists of four components, namely a turbidity sensor, where this sensor serves as a detector of pond water rigidity, a pH sensor serves to detect acidity values in pond water, a temperature sensor serves as the detection of pool water temperature values, and a distance sensor (HCSR-04) serving as the altitude or pond water level detection.
The part of the microcontroller data processor used is the ESP 32, which has many advantages over the Arduino Uno, one of which is a faster processor than the Arduino Uno because the ESP 32 has a clock of 240 MHz while the Arduino Uno uses the Atmega328 with a maximum of 16 MHz and the ESP 32 has more pins. The ESP 32 function is the communication of the entire component and the data processor received by the input. Then the processed data will be forwarded by ESP 32 to the output stage as the final action of this network. Using the Ubidots system monitoring platform, data is processed in real-time. ESP 32 outputs data for the command to carry out the process of sealing and filling pool water automatically.
The output part is a water pump and a solenoid valve where the water pump serves for the pool water filling process, while the solenoid Valve itself serves to carry out a pool water drainage process. In addition to the output section, there are Ubidots and LCD platforms used for monitoring pool water quality.
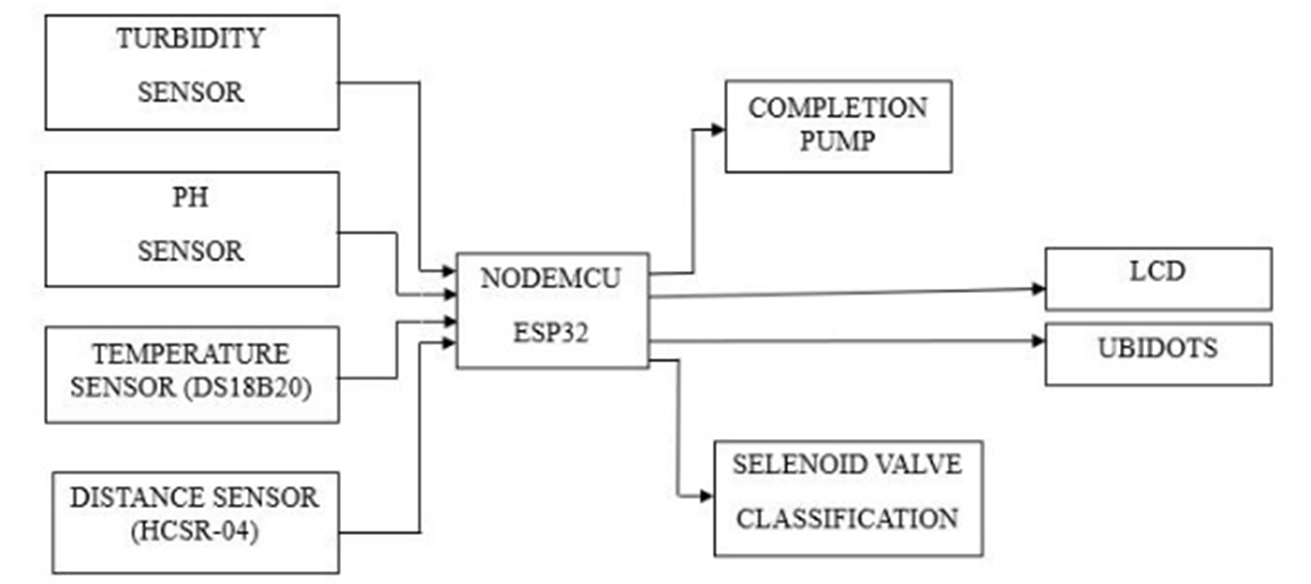
Figure1. Block diagrams
System Flowchart
Flowchart is a research flow chart from the beginning to the end of the process made to facilitate the research process. In this study there are 2 flowcharts consisting of a flow chart of the entire tool and monitoring system using Ubidots. Figure 2 is the first flowchart, namely the control system flowchart with NodeMCU ESP 32 as the controller which starts by activating the internet connection then connecting it to Ubidots, then if connected, the sensor will read and then send the readings to the microcontroller so that the ESP 32 microcontroller can command the selenoid valve and water pump to work.
Figure 2 is the first flowchart which is a whole series of flowcharts starting from the initial condition, where all the component systems are in the condition of lighting then in the input section there are 4 sensors where the Turbidity sensor functions to detect the turbidity of the water, and the temperature sensor function to detect water temperature, the ph sensor function for detecting the pH value or acidity value of the pool water.
The result obtained by the sensor will be processed by ESP 32 and forwarded to the output when one or three of the sensors detect a value that does not match the set value. Next, the Selenoid valve will carry out the sealing process up to the minimum water level limit and will change the process to the filling process carried out by the water pump until the value is detected by the sensor according to the desired working principle.
Figure 3 is the second flowchart of a series of monitoring of the quality of the water in the pool, based on the bigot's platform, starting from the start, then initiating the next input or output of the sensor to work, then the ESP 32 microcontroller will send data to the Ubidots Platform in real-time so that the entrepreneur can monitor the pool water quality remotely with the Ubuntu platform.
Figure 2. Tool set flowchart
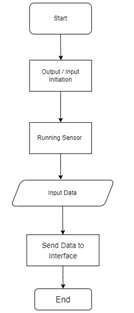
Figure 3. Monitoring series flowchart
Wiring Design
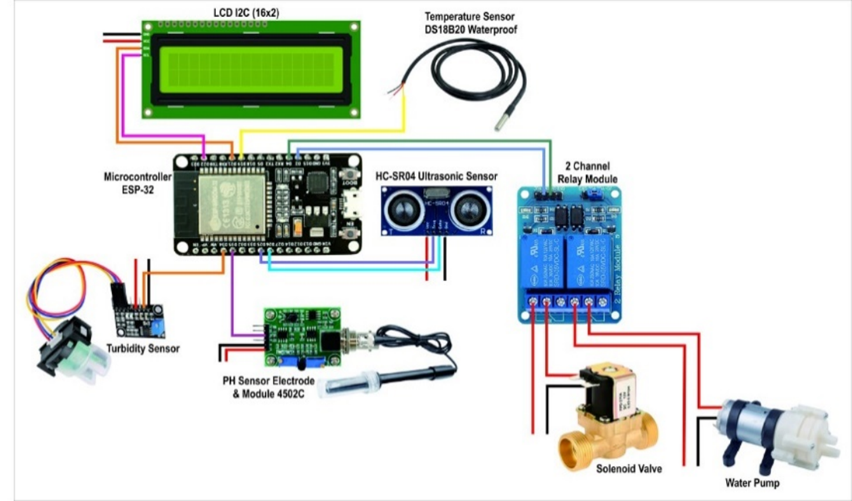
Diagram wiring is a series of wiring used in this study, in which the entire component used as input and output is connected by the microcontroller used, ESP 32. All the components used must be well connected so that the tools can be connected properly. so that it can operate optimally. In Figure 4 several components are used with the following utilities :
- Sensor Turbidity as a component of the detection of pool water clogging.
- Sensor's pH serves as a pH or acidity detector for pool water.
- Temperature Sensor used as a detector of pool water temperature values.
- Proximity sensor ( HCSR-04 ) used for detection of elevation or pool water level.
- ESP 32 Used as a network brain, the task is to process the data received by the sensor and then forward it to the output component.
- Water Pump used as the output that would carry out the pool water filling process.
- Selenoid Valve used as the output that would carry out the pool water purification process.
- LCD is used as a component that can view the monitoring data output from the sensor input directly.
The pin address of each connected component can be seen in Table 1.
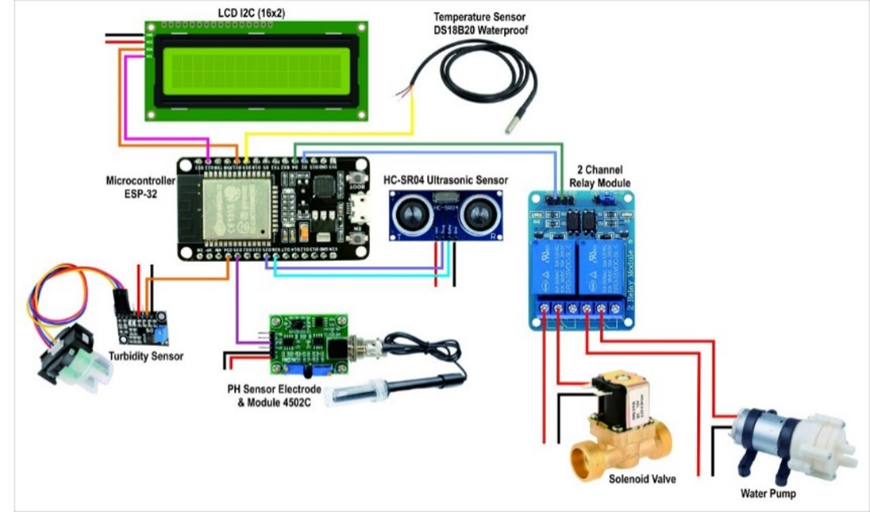
Figure 4. Wiring diagram
Table 1. Component pin address
No. | Component | Component Pin Address | ESP 32 Pin Address | Relay Pin Address |
1. | Turbidity Sensor | VCC | VIN | - |
GND | GND |
PINOUT | D34 |
2. | Ph Sensor | VCC | VIN | - |
GND | GND |
PINOUT | D35 |
3. | Temperature Sensor | VCC | VIN | - |
GND | GND |
DAT | D19 |
4. | Ultrasonic sensor | VCC | VIN | - |
TRISH | D25 |
ECHO | D26 |
GND | GND |
5. | Solenoid Valve | VCC | GND | COM |
| GND |
6. | Water Pump | VCC | GND | COM |
GND |
7. | LCD | VCC | VIN | - |
SDA | D21 |
SCL | D22 |
GND | GND |
8. | Relay 1 | VCC | D2 | - |
GND | GND |
PINOUT | SELENOID |
9. | Relay 2 | VCC | D2 | - |
GND | GND |
Pinout | Pump |
The Turbidity Sensor Pin is connected to the ESP 32 microcontroller and the data resulting from sensor readings is sent to the UBIDOTS platform to provide data in real-time and under remote monitoring. Similarly, the pH, temperature, and distance sensor is connected to the ESP 32 microcontroller to provide sensor reading data and sent to the bigot's platform. With an ESP 32 input source of 5 volts. The solenoid valves and pumps are connected to the relay pins with a 12-volt DC adapter voltage source. On all the sensors used as wiring lines, there are three, namely the first pin-out cable used as an input that comes from the reading of analog values generated by the sensor. Then the second is the VCC used as a source of sensor power supply and the third is the GND as a grounding. VCC and GND wiring lines on all of the sensors we use 5v adapters.
- RESULT AND DISCUSSION
The results of the implementation of the research prototype system monitoring and automation of the quality of water in the pools of cultivation in the Pohkecik pond based on Ubidots can be seen in Figure 5.
How to operate this tool is as follows:
- The user activates the wifi network that was previously connected to the microcontroller
- The user provides the power supply through a 5-volt adapter to the ESP 32 microcontroller as an ESP 32 power supply and the Input sensor and 12-volt adaptor cable as a relay power supply for solenoid valves and water pump.
- Users can open the Ubidots platform to monitor the sensor readings.
- After that, the solenoid and water pump will work automatically if a sensor reading is detected that exceeds the set value limit.
Figure5. Tool realization

- Testing ESP 32 Connection to Wifi
Tests are carried out to ensure that the ESP 32 microcontroller can connect to Wifi to read data and enter the UBIDOTS. The tests were conducted several times to find out how long the waiting time was on the process of connecting the ESP 32 microcontroller to Wifi, the results can be seen in Table 2 testing connections. The test results of the ESP 32 microcontroller as shown in Table 2. The connection of the microcontrollers has been tested 5 times with the result can be connected well, but the waiting times are different. It can be said normal because the difference is not too far.
Table 2. Testing wifii connection to ESP 32
Testing to- | WIFI ESP 32 | Accuracy (%) |
Condition | Waiting Time (s) |
1st Test | Connected | 4 | Medium |
2nd Test | Connected | 4 | Medium |
3rd Test | Connected | 3 | Medium |
4th Test | Connected | 3 | Medium |
5th Test | Connected | 3 | Medium |
- Turbidity Sensor Testing
Turbidity sensor testing was done for 6 days, the first test was done to make sure the components are in good condition and can be used. The test results can be seen in Table 3. Based on Table 3, it is seen that when the sensor detects a water rigidity value exceeding 2000 NTU, the solenoid valve will be on to carry out the water purification process up to the water height limit below 50 cm, then it will be off and switched to the pump that carries out the pool water filling process until the water level limit exceeds 85cm and the pump will be switched off. So after the water replacement process, the sensor will detect the decreased thickness of the water until it belongs to clear water can be seen in Figure 6.
Table 3. Testing turbidity sensor detection water rigidity
Testing to- | Turbidity Sensor (NTU) | Condition | Information |
Solenoid Valves | Water Pump |
Day 1 | 686 | Off | Off | Clear |
Day 2 | 2312 | On | Off | Rigid |
Off | On |
Off | Off |
Day 3 | 689 | Off | Off | Clear |
Day 4 | 1712 | Off | Off | Clear |
Day 5 | 489.87 | Off | Off | Clear |
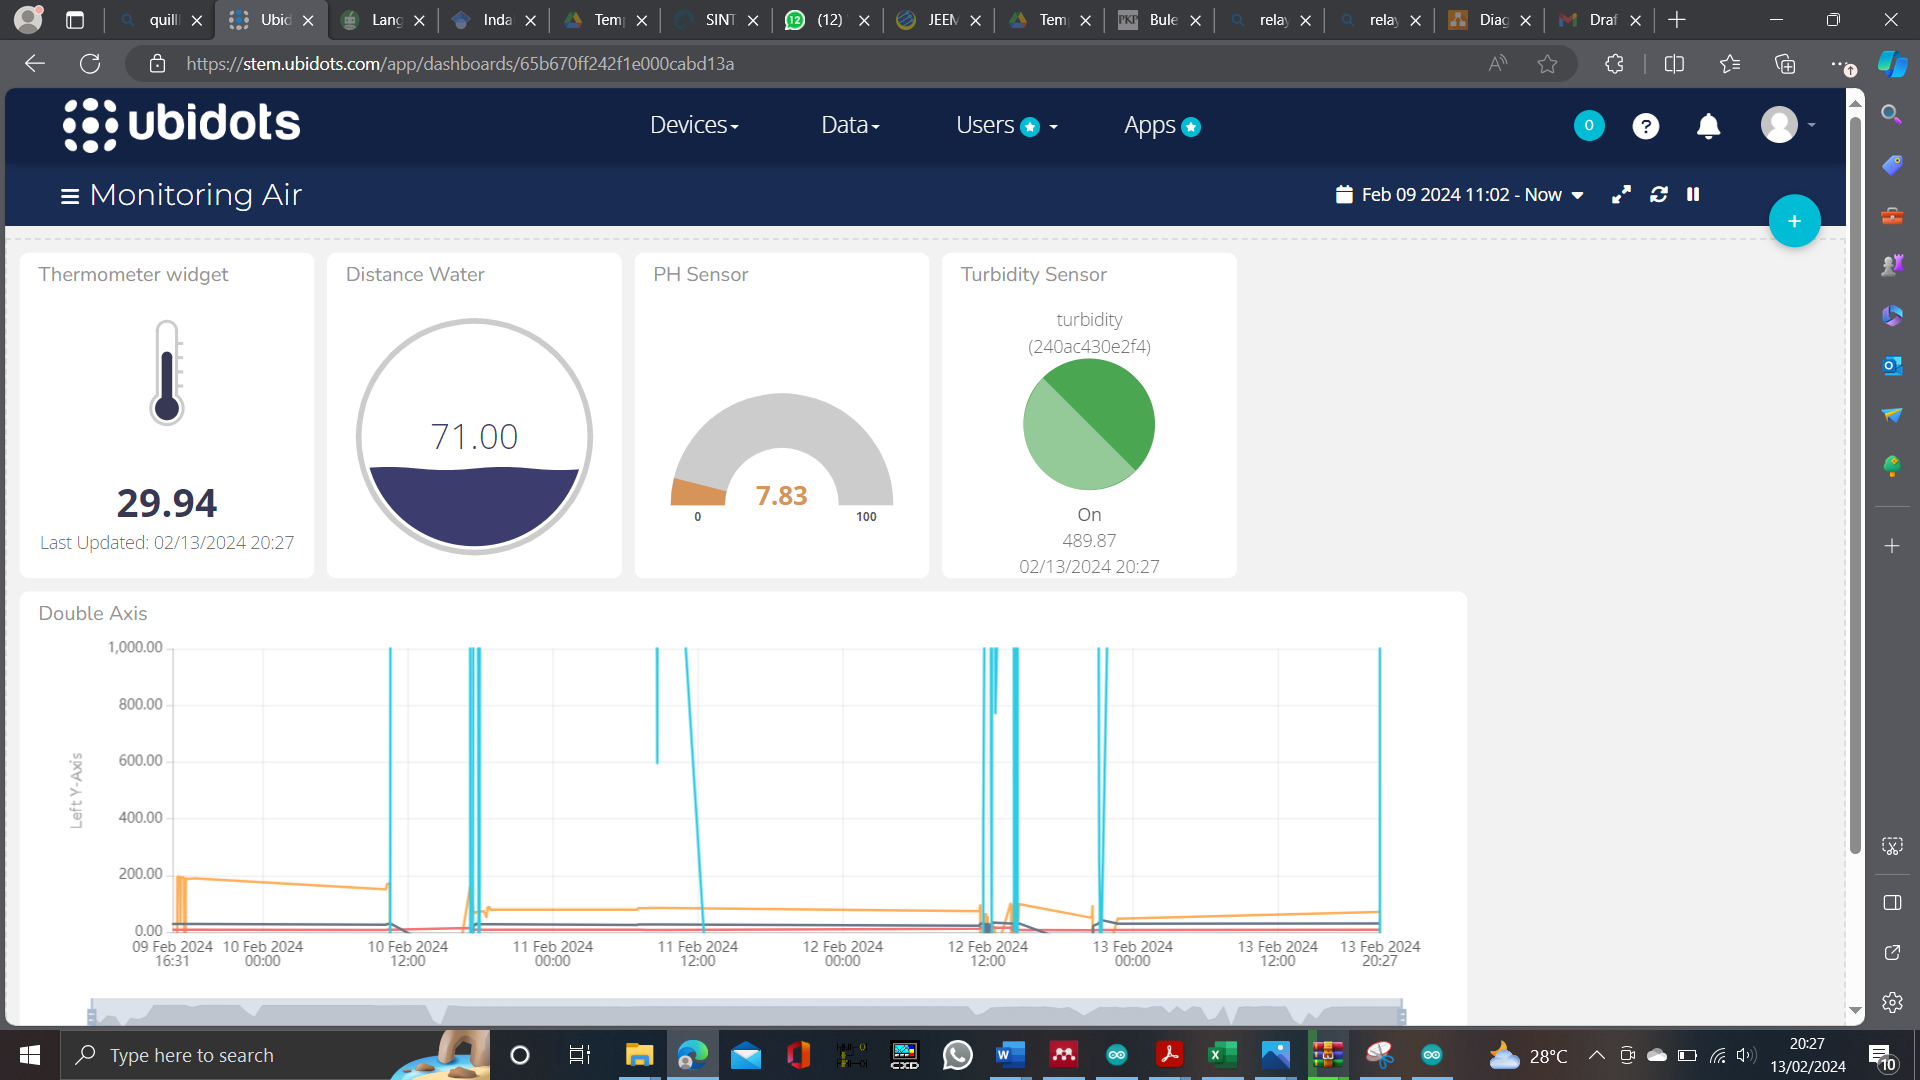
Figure 6. Monitoring pool water coercion on Ubidots
- Temperature Sensor Testing
Testing of temperature sensors to detect the temperature of pool water. The test results can be seen in the Table 4. If the water temperature exceeds 37 degrees Celsius, the solenoid valve will be on and perform the water purification process, so that the water level limit reaches the minimum value of 50 cm. At this position, the solenoid valves will be off and switch to the water pump that carries out the pool water-filling process up to 85 cm. If the normal temperature is detected below 370 degrees C, then solenoids and pumps stop. If the temperature reaches 370 Degrees, then the process of purifying and filling of pool water will continue. After the water replacement process is completed, the sensor will detect the temperature value of the water reaches normal temperature conditions can be seen in Figure 7.
Table 4. DS018B20 temperature sensor testing
Testing to- | Temperature Sensor (0 Celsius) | Thermometer (0 Celsius) | Condition Solenoid Valves | Condition Water Pump | Description | % Error |
Day 1 | 28.31 | 27.14 | Off | Off | Normal Temperature | 0.04 % |
Day 2 | 27.75 | 26.95 | Off | Off | Normal Temperature | 0.02% |
Day 3 | 26.25 | 25.67 | Off | Off | Normal Temperature | 0.02% |
Day 4 | 37.00 | 36.56 | On Off Off | Off On Off | Hot Temperature | 0.01% |
Day 5 | 29.94 | 29.21 | Off | Off | Normal Temperature | 0.02% |
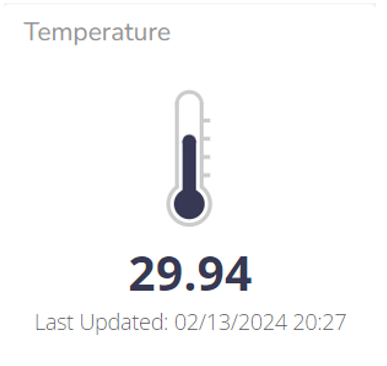
Figure 7. Monitoring pool water temperature on Ubidots
- Ph Sensor Testing
Water pH sensor testing to detect the acidity level of pool water. Component test results can be seen in Table 5. Table 5 shows the test results above that the pH of the fish pond water is in the normal pH position so that the solenoid and pump conditions are off. Suppose at one time the pH of the water is below 6.5 or above 8.5. In this case, the solenoid valve condition will turn on and carry out the process of draining the water to a water level limit of 50 cm. after the minimum water level limit is below 50 cm, the Solenoid Valve will turn off and change the process of filling the pond water by the water pump to a water level limit of 85 cm. then the ph sensor will detect the pH value of water 6.5 to 8.5 including the normal pH value. If the pH of the water is too low (below 6.5), then the water is classified as acidic. Conversely, if the pH of the water is too high (exceeding 8.5), the water falls into the alkaline category. Both of these conditions are certainly not good for tilapia and can interfere with the growth of tilapia. Thus the importance of maintaining the pH value of the water is because tilapia is sensitive to changes in water quality. If the pH of the water is disturbed, tilapia will be easily stressed and susceptible to disease. This has a negative impact on fish growth and productivity can be seen in Figure 8.
Table 5. Ph Sensor testing
Testing to- | pH Sensor | pH Meter | Condition Solenoid | Condition Water Pump | Description | % Error |
Day 1 | 7.84 | 7.1 | Off | Off | Normal pH | 0.10% |
Day 2 | 7.75 | 6.7 | Off | Off | Normal pH | 0.16% |
Day 3 | 6.50 | 6.2 | Off | Off | Normal pH | 0.04% |
Day 4 | 7.57 | 6.7 | Off | Off | Normal pH | 0.12% |
Day 5 | 7.83 | 7.4 | Off | Off | Normal pH | 0.05% |

Figure 8. Monitoring pool water pH on Ubidots
- View of the Monitoring System Using Ubidots
A view of the water quality monitoring system of the Nile pool using the Ubidots platform. The result can be seen in Figure 9.
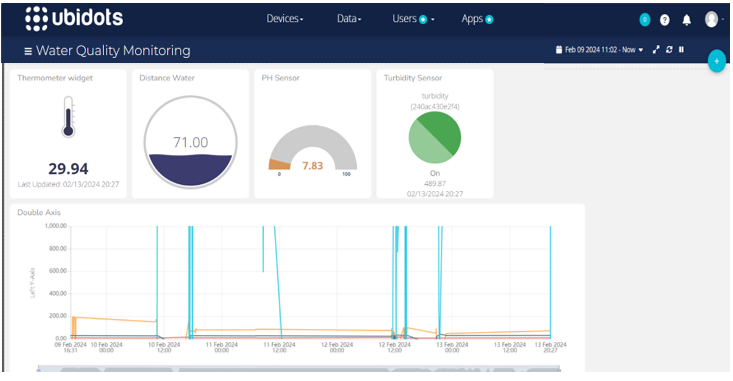
Figure 9. Ubidots platform view
- CONCLUSIONS
Based on the tests that have been carried out, it can be concluded that all components used can function optimally even though there is a time lag in testing but with a difference that is not so far away so it can be concluded that it can work well on the turbidity sensor test obtained very good results. Due to sensor readings that exceed the 2000 NTU water turbidity limit, the sensor sends data to the microcontroller so that the microcontroller gives orders to the solenoid valve and water pump to carry out the process of draining and filling the pool water automatically. Then in testing the temperature sensor, we get very good results where every experiment we do produces an error rate of 0.02% so that the sensor works well. In testing the temperature sensor for detecting the temperature of the pool water works well where the specified data transmission has been read by the temperature sensor to turn on the Selenoid and pump when the water temperature is hot, with such a system that can help the process of draining and filling the pool water automatically. The water pH sensor for detecting the pH of the pool water was also tested under normal water pH conditions. For this challenge, the number of fish in a pond and the size of the pond also make the pond water cloudy faster. So it must be balanced between the number of fish and the pond area. In testing the monitoring system, here I use the Ubidots platform where which platform can provide real-time data, this automatic water quality control system is very helpful for Tilapia fish farming businesses. Because business people can monitor the quality of pond water remotely and in real time as well as automatic control of the process of draining and filling pond water so that where business people no longer have difficulty draining water filling manually. The suggestion for future researchers is to maximize the results of this research, in addition to providing additional automatic feeding systems and adding solar panels as a power supply to suppress the electricity expenditure of PLN.
REFERENCES
- O. P. C. Series and M. Science, “Web of Things to control planting seeds and watering plants for indoor smart farm Web of Things to control planting seeds and watering plants for indoor smart farm,” In IOP Conference Series: Materials Science and Engineering, vol. 1098, no. 5, p. 052109, 2021, https://doi.org/10.1088/1757-899X/1098/5/052109.
- R. M. Hernandez and A. A. Hernandez, “Acceptance Analysis of Mobile Application for Nile Tilapia Classification using Unified Theory of Acceptance and Use of Technology,” in 2020 16th IEEE International Colloquium on Signal Processing & Its Applications (CSPA), pp. 266–271, 2020, https://doi.org/10.1109/CSPA48992.2020.9068727.
- H. Mustafidah, Suwarsito, and E. Puspitasari, “Case-Based Reasoning System to Determine the Types of Fish Farming Based on Water Quality,” in 2020 Fifth International Conference on Informatics and Computing (ICIC), pp. 1–5, 2020, https://doi.org/10.1109/ICIC50835.2020.9288535.
- L. Lopez et al., “Design of Water Quality Control System for Commercial Tilapia Pond,” in 2023 IEEE Open Conference of Electrical, Electronic and Information Sciences (eStream), pp. 1–6, 2023, https://doi.org/10.1109/eStream59056.2023.10135052.
- J. Huan, H. Li, F. Wu, and W. Cao, “Design of water quality monitoring system for aquaculture ponds based on NB-IoT,” Aquacultural Engineering, vol. 90, p. 102088, 2020, https://doi.org/10.1016/j.aquaeng.2020.102088.
- B. Dewantara, I. Sulistiyowati, and J. Jamaaluddin, “Automatic Fish Feeder and Telegram Based Aquarium Water Level Monitoring,” Buletin Ilmiah Sarjana Teknik Elektro, vol. 5, no. 1, pp. 98–107, 2023, https://doi.org/10.21070/ups.377.
- M. de la L. Sanchez-Estrada, J. F. Garcia-Trejo, V. Caltzontzin-Rabell, R. Chavez-Jaime, L. de L. Alvarez-Arquieta, and O. Alatorre-Jacome, “Factors to increase the stocking density using BioFloc Technology in tilapia production : A mini-review,” in 2018 XIV International Engineering Congress (CONIIN), pp. 1–5, 2018, https://doi.org/10.1109/CONIIN.2018.8489813.
- N. L, M. V Gudur, S. R, and S. B, “IoT Based Innovative Smart Monitoring of Aquaponics System Using Atmega 328P and ESP 8266,” in 2022 IEEE 3rd Global Conference for Advancement in Technology (GCAT), pp. 1–6, 2022, https://doi.org/10.1109/GCAT55367.2022.9972203.
- L. Y. Heng, M. E. Rana, R. Abdulla, and H. K. Tripathy, “Design and Development Recommendations for a Smart Weather Monitoring System,” in 2022 International Conference on Advancements in Smart, Secure and Intelligent Computing (ASSIC), pp. 1–9, 2022, https://doi.org/10.1109/ASSIC55218.2022.10088313.
- S. A. Hamid, A. M. A. Rahim, S. Y. Fadhlullah, S. Abdullah, Z. Muhammad, and N. A. M. Leh, “IoT based Water Quality Monitoring System and Evaluation,” Proceedings - 10th IEEE International Conference on Control System, Computing and Engineering, ICCSCE 2020, pp. 102–106, 2020, https://doi.org/10.1109/ICCSCE50387.2020.9204931.
- T. A. Bejar et al., “Enhancing Tilapia Harvesting through Semi-automated Fish Pen Elevating System and Single-input-multiple-output Aquaculture Pump System,” in 2022 IEEE 14th International Conference on Humanoid, Nanotechnology, Information Technology, Communication and Control, Environment, and Management (HNICEM), pp. 1–6, 2022, https://doi.org/10.1109/HNICEM57413.2022.10109413.
- H. Mustafidah, B. R. Alfiansyah, Suwarsito, Purnomo, and N. Hidayat, “Expert System Using Forward Chaining to Determine Freshwater Fish Types Based on Water Quality and Area Conditions,” in 2023 Eighth International Conference on Informatics and Computing (ICIC), pp. 1–5, 2023, https://doi.org/10.1109/ICIC60109.2023.10382066.
- J. D. L. Madrid, J. C. D. Cruz, and V. L. Q. Balisi, “Real-Time Water Quality Monitoring System with Predictor for Tilapia Pond,” in 2018 IEEE 10th International Conference on Humanoid, Nanotechnology, Information Technology, Communication and Control, Environment and Management (HNICEM), pp. 1–6, 2018, https://doi.org/10.1109/HNICEM.2018.8666423.
- G. Simoes, C. Dionisio, A. Gloria, P. Sebastiao, and N. Souto, “Smart System for Monitoring and Control of Swimming Pools,” IEEE 5th World Forum on Internet of Things, WF-IoT 2019 - Conference Proceedings, no. 1, pp. 829–832, 2019, https://doi.org/10.1109/WF-IoT.2019.8767240.
- C. H. Chen, Y. C. Wu, J. X. Zhang, and Y. H. Chen, “IoT-Based Fish Farm Water Quality Monitoring System,” Sensors, vol. 22, no. 17, 2022, https://doi.org/10.3390/s22176700.
- B. Aziz, E. Muchtar, and F. I. Hariadi, “Human-Machine Interface for water quality monitoring system of white-legged shrimp pond,” 2016 International Symposium on Electronics and Smart Devices, ISESD 2016, pp. 73–78, 2017, https://doi.org/10.1109/ISESD.2016.7886695.
- Abu-Khadrah, G. F. Issa, S. Aslam, M. Shahzad, K. Ateeq, and M. Hussain, “IoT Based Smart Fish-Feeder and Monitoring System,” in 2022 International Conference on Business Analytics for Technology and Security (ICBATS), pp. 1–4, 2022, https://doi.org/10.1109/ICBATS54253.2022.9759058.
- J. John and M. P. R, “Automated Fish Feed Detection in IoT Based Aquaponics System,” in 2021 8th International Conference on Smart Computing and Communications (ICSCC), pp. 286–290, 2021, https://doi.org/10.1109/ICSCC51209.2021.9528186.
- Akhriana, I. Intan, N. Tamsir, N. Nirwana, R. W. Rahmi, and R. Rahmadani, “Microcontroller Application in Feeding Fish Using an Android Mobile,” in 2021 3rd International Conference on Cybernetics and Intelligent System (ICORIS), pp. 1–6, 2021, https://doi.org/10.1109/ICORIS52787.2021.9649453.
- H. M. Saod, M. K. F. Kushiar, and N. H. Ishak, “Telemetry System for Highland Tomato Plants Using Ubidots Platform,” in 2022 IEEE 12th International Conference on Control System, Computing and Engineering (ICCSCE), pp. 197–202, 2022, https://doi.org/10.1109/ICCSCE54767.2022.9935656.
AUTHOR BIOGRAPHY

| Muhammad Taufik Nur Efendi was Born in the Pasuruan district on December 20, 2001, his first education was at SDN Pogar 2 Bangil he graduated in 2014, then continued his education at SMPN 2 Beji, and in 2020 completed his education in Electrical Power Installation Engineering at SMKN 1 Bangil located in the center of the city of Bangil. In 2020 continued his education to obtain his first bachelor's degree (S1) at Muhammadiyah University Sidoarjo in the Electrical Engineering Studies Program. |
|
|

| Indah Sulistiyowati is a researcher who specializes in Renewable Energy Power Systems and Control Systems. Completed her master’s degree at Institut Teknologi Sepuluh Nopember majoring in Control System Electrical Engineering Subsidiary, and now is a lecturer at Universitas Muhammadiyah Sidoarjo. |
|
|

| Syamsudduha Syahrorini is an active lecturer in the Department of Electrical Engineering, Faculty of Science and Technology, Muhammadiyah University of Sidoarjo. She received a Bachelor's Degree from Muhammadiyah University of Malang, a Master’s Degree from Sepuluh Nopember Institute of Technology, and a Doctoral degree from Brawijaya University. Some of the previous research she has done is IOT-Based Sumo Robot Control Using Blynk Software (2023), Training on processing household organic waste into eco enzyme at 'Aisyiyah Sidoarjo Orphanage (2022), K-Nearest Neighbor Algorithm to Identify Cucumber Maturity with Extraction of One-Order Statistical Features and GrayLevel Co-Occurrence (2021), and many more. |
|
|

| Dr.Izza Anshory, ST.,MT. He is an academic and researcher who has a rich educational background and organizational experience. He started his undergraduate education journey (S1) at Brawijaya University in 2000 with a degree (ST). then he continued his Masters (S2) education in 2006 at the Sepuluh Nopember Institute of Technology with a gelah (MT). not stopping there while being a lecturer he also continued his education at the Doctoral level (S3) in 2021 at the Sepuluh Nopember Institute of Technology with a degree (Dr). His scientific concentration is on electric vehicles both in terms of analysis and efficiency of using electric vehicles, as evidenced by his research, namely as follows: SINTA, Google Cendekia, ReseachGate |
Buletin Ilmiah Sarjana Teknik Elektro, Vol. 6, No. 1, March 2024, pp. 34-44