Transforming Cartesian coordinates into parallel coordinates in 2D space for geometric visualization
DOI:
https://doi.org/10.12928/bamme.v6i2.13792Keywords:
coordinate transformation, duality, geometric visualization, parallel coordinatesAbstract
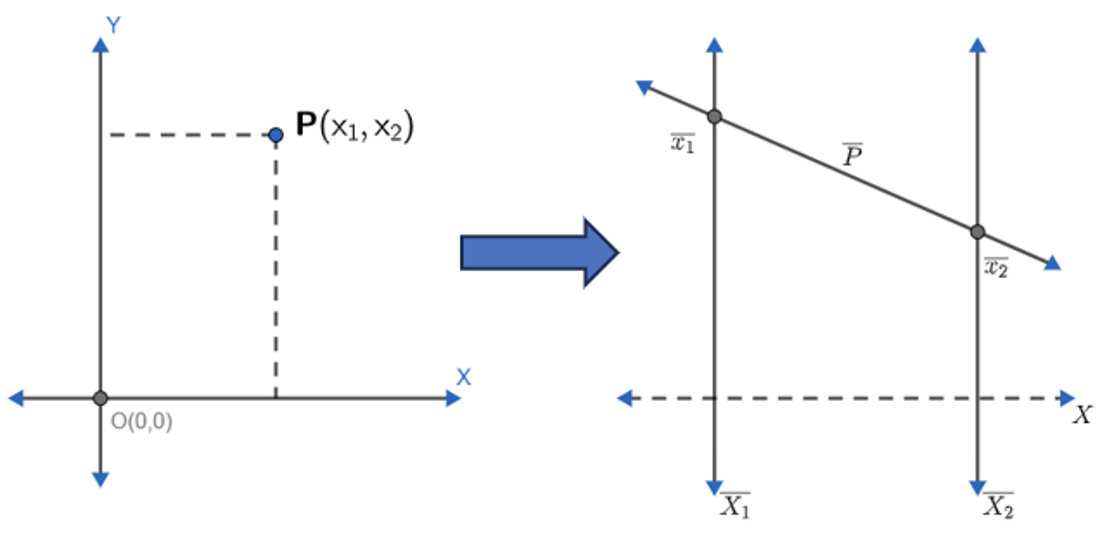
This study develops, step by step, the geometric transformation that carries the conventional two-dimensional Cartesian plane into a parallel coordinate system. Cartesian coordinates, while foundational in geometry and mathematics, are inherently limited to three dimensions, restricting their effectiveness in representing multidimensional data. As a solution, the parallel coordinate system, originally introduced by Maurice d’Ocagne and later developed into a coordinate system for multidimensional geometry by Alfred Inselberg, is explored for its ability to visualize data with higher dimensions using equidistant, parallel axes. The transformation is carried out in two explicit steps: a 90° rotation of the X-axis about the origin, so that it comes to coincide with the Y-axis, followed by a translation that separates the two axes by a fixed distance d. The duality principle is then applied to illustrate the reversed roles of points and lines. Two results follow. Every point P(x1,y1) of the Cartesian plane is mapped to a line segment joining the two parallel axes; and every line y=mx+b with m≠1 is mapped to the single point (d/1-m, b/1-m), while in the singular case m = 1 the dual is an ideal point of the projective extension of the plane. Visual constructions and worked examples validate the model, showing that the transformation preserves collinearity and the ratios of segments along a line while enabling multidimensional insights. This research highlights the potential of parallel coordinates in mathematical visualization, particularly in representing relationships among multiple variables in two-dimensional spaces.
References
Alcaide, D., & Aerts, J. (2021). Spanning trees as approximation of data structures. IEEE Transactions on Visualization and Computer Graphics, 27(10), 3994–4008. https://doi.org/10.1109/tvcg.2020.2995465
Çakır, B., Prete, M., Huang, N., Dongen, S. v., Pir, P., & Kiselev, V. Y. (2020). Comparison of visualization tools for single-Cell RNAseq data. Nar Genomics and Bioinformatics, 2(3). https://doi.org/10.1093/nargab/lqaa052
Chushig-Muzo, D., Soguero-Ruíz, C., Miguel-Bohoyo, P. d., & Mora-Jiménez, I. (2022). Learning and visualizing chronic latent representations using electronic health records. Biodata Mining, 15(1). https://doi.org/10.1186/s13040-022-00303-z
Dertinger, S. D., Briggs, E. M., Hussien, Y., Bryce, S. M., Avlasevich, S. L., Conrad, A., Johnson, G. E., Williams, A., & Bemis, J. C. (2024). Visualization strategies to aid interpretation of high‐dimensional genotoxicity data. Environmental and Molecular Mutagenesis, 65(5), 156–178. https://doi.org/10.1002/em.22604
Ding, J., Condon, A., & Shah, S. P. (2018). Interpretable dimensionality reduction of single cell transcriptome data with deep generative models. Nature Communications, 9(1). https://doi.org/10.1038/s41467-018-04368-5
d’Ocagne, M. (1885). Coordonnées parallèles et axiales Méthode de Transformation géométrique et Procédé nouveau de Calcul graphique, déduits de la Considération des Coordonnées parallèles. Nature 31, 551–552. https://doi.org/10.1038/031551b0
Eckelt, K., Hinterreiter, A., Adelberger, P., Walchshofer, C., Dhanoa, V., Humer, C., Heckmann, M., Steinparz, C., & Streit, M. (2023). Visual exploration of relationships and structure in low-dimensional embeddings. IEEE Transactions on Visualization and Computer Graphics, 29(7), 3312–3326. https://doi.org/10.1109/tvcg.2022.3156760
Fujiwara, T., Kwon, O.-H., & Ma, K. (2020). Supporting analysis of dimensionality reduction results with contrastive learning. IEEE Transactions on Visualization and Computer Graphics, 26(1), 45–55. https://doi.org/10.1109/tvcg.2019.2934251
Gadekallu, T. R., Maddikunta, P. K. R., Lakshmanna, K., Kaluri, R., Rajput, D. S., Srivastava, G., & Baker, T. (2020). Analysis of dimensionality reduction techniques on big data. IEEE Access, 8, 54776–54788. https://doi.org/10.1109/access.2020.2980942
Gu, Z., Eils, R., Schlesner, M., & Ishaque, N. (2018). EnrichedHeatmap: An R/Bioconductor Package for Comprehensive Visualization of Genomic Signal Associations. BMC Genomics, 19(1). https://doi.org/10.1186/s12864-018-4625-x
Husnain, M., Missen, M. M. S., Mumtaz, S., Luqman, M. M., Coustaty, M., & Ogier, J.-M. (2019). Visualization of high-dimensional data by Pairwise Fusion Matrices using T-Sne. Symmetry, 11(1), 107. https://doi.org/10.3390/sym11010107
Inselberg, A. (1985). The plane with parallel coordinates. The Visual Computer, 1(2), 69–91. https://doi.org/10.1007/BF01898350
Inselberg, A. (2009). Parallel coordinates: visual multidimensional geometry and its applications. Springer.
Inselberg, A., & Dimsdale, B. (1990). Parallel coordinates: a tool for visualizing multi-dimensional geometry. In Proceedings of the First IEEE Conference on Visualization (pp. 361–378). IEEE Computer Society Press.
Kanai, M., Maeda, Y., & Okada, Y. (2018). Grimon: Graphical interface to visualize multi-omics networks. Bioinformatics, 34(22), 3934–3936. https://doi.org/10.1093/bioinformatics/bty488
Kobak, D., & Berens, P. (2019). The art of using t-SNE for single-cell transcriptomics. Nature Communications, 10(1). https://doi.org/10.1038/s41467-019-13056-x
Konopka, T., Vestito, L., & Smedley, D. (2021). Dimensional reduction of phenotypes from 53 000 mouse models reveals a diverse landscape of gene function. Bioinformatics Advances, 1(1). https://doi.org/10.1093/bioadv/vbab026
Linderman, G. C., Rachh, M., Hoskins, J. G., Steinerberger, S., & Kluger, Y. (2019). Fast interpolation-based T-Sne for improved visualization of single-cell RNA-seq data. Nature Chemical Biology, 16(3), 243–245. https://doi.org/10.1038/s41592-018-0308-4
Liu, J., Wan, G., Liu, W., Li, C., Peng, S., & Xie, Z. (2023). High-Dimensional spatiotemporal visual analysis of the air quality in China. Scientific Reports, 13(1). https://doi.org/10.1038/s41598-023-31645-1
Mazher, A. (2020). Visualization Framework for High-Dimensional Spatio-Temporal Hydrological Gridded Datasets Using Machine-Learning Techniques. Water, 12(2), 590. https://doi.org/10.3390/w12020590
McInnes, L., Healy, J., Saul, N., & Großberger, L. (2018). UMAP: Uniform Manifold Approximation and Projection. The Journal of Open Source Software, 3(29), 861. https://doi.org/10.21105/joss.00861
Meehan, S., Kolyagin, G. A., Parks, D. R., Youngyunpipatkul, J., Herzenberg, L. A., Walther, G., Ghosn, E., & Orlova, D. (2019). Automated subset identification and characterization pipeline for multidimensional flow and mass cytometry data clustering and visualization. Communications Biology, 2(1). https://doi.org/10.1038/s42003-019-0467-6
Mitku, A. A., Zewotir, T., North, D., & Naidoo, R. N. (2020). Exploratory data analysis of adverse birth outcomes and exposure to oxides of nitrogen using interactive parallel coordinates plot technique. Scientific Reports, 10(1). https://doi.org/10.1038/s41598-020-64471-w
Morrell, E. D., Wiedeman, A., Long, S. A., Gharib, S. A., West, T. E., Skerrett, S., Wurfel, M. M., & Mikacenic, C. (2018). Cytometry TOF identifies alveolar macrophage subtypes in acute respiratory distress syndrome. JCI Insight, 3(10). https://doi.org/10.1172/jci.insight.99281
Nonato, L. G., & Aupetit, M. (2019). Multidimensional projection for visual analytics: linking techniques with distortions, tasks, and layout enrichment. IEEE Transactions on Visualization and Computer Graphics, 25(8), 2650–2673. https://doi.org/10.1109/tvcg.2018.2846735
Probst, D., & Reymond, J. (2020). Visualization of very large high-dimensional data sets as minimum spanning trees. Journal of Cheminformatics, 12(1). https://doi.org/10.1186/s13321-020-0416-x
Richter-Gebert, J. (2011). Perspectives on Projective Geometry: A Guided Tour Through Real and Complex Geometry. Springer. https://doi.org/10.1007/978-3-642-17286-1
Self, J. Z., Dowling, M., Wenskovitch, J., Crandell, I., Wang, M., House, L., Leman, S., & North, C. (2018). Observation-Level and parametric interaction for high-dimensional data analysis. ACM Transactions on Interactive Intelligent Systems, 8(2), 1–36. https://doi.org/10.1145/3158230
Smets, T., Keyser, T. D., Tousseyn, T., Waelkens, E., & Moor, B. D. (2021). Correspondence-aware manifold learning for microscopic and spatial omics imaging: a novel data fusion method bringing mass spectrometry imaging to a cellular resolution. Analytical Chemistry, 93(7), 3452–3460. https://doi.org/10.1021/acs.analchem.0c04759
Spathis, D., Passalis, N., & Tefas, A. (2019). Interactive dimensionality reduction using similarity projections. Knowledge-Based Systems, 165, 77–91. https://doi.org/10.1016/j.knosys.2018.11.015
Stringer, C., Pachitariu, M., Steinmetz, N. A., Carandini, M., & Harris, K. D. (2019). High-dimensional geometry of population responses in visual cortex. Nature, 571(7765), 361–365. https://doi.org/10.1038/s41586-019-1346-5
Toprasertpong, K., Nako, E., Wang, Z., Nakane, R., Takenaka, M., & Takagi, S. (2022). Reservoir computing on a silicon platform with a Ferroelectric Field-Effect transistor. Communications Engineering, 1(1). https://doi.org/10.1038/s44172-022-00021-8
Urpa, L., & Anders, S. (2019). Focused multidimensional scaling: Interactive visualization for exploration of high-dimensional data. BMC Bioinformatics, 20(1). https://doi.org/10.1186/s12859-019-2780-y
Wegman, E. J. (1990). Hyperdimensional data analysis using parallel coordinates. Journal of the American Statistical Association, 85(411), 664–675.
Wu, B., Smith, J., Wilamowski, B. M., & Nelms, R. M. (2018). DCMDS-RV: Density-concentrated multi-dimensional scaling for relation visualization. Journal of Visualization, 22(2), 341–357. https://doi.org/10.1007/s12650-018-0532-0
Zhang, J., Lü, C., Li, Z., Xi, L., & Li, J. (2018). An efficient hyperspectral image retrieval method: deep spectral-spatial feature extraction with DCGAN and dimensionality reduction using t-SNE-based NM Hashing. Remote Sensing, 10(2), 271. https://doi.org/10.3390/rs10020271
Zhang, W., & Di, Y. (2018). Searching for best lower dimensional visualization angles for high dimensional RNA-Seq data. PeerJ, 6, e5199. https://doi.org/10.7717/peerj.5199
Downloads
Published
Issue
Section
License
Copyright (c) 2026 Gibran Khalil Gibran, Farida Nurhasanah

This work is licensed under a Creative Commons Attribution-ShareAlike 4.0 International License.
Authors who publish with this journal agree to the following terms:
- Authors retain copyright and grant the journal right of first publication with the work simultaneously licensed under Creative Commons Attribution License that allows others to share the work with an acknowledgement of the work's authorship and initial publication in this journal.
- Authors are able to enter into separate, additional contractual arrangements for the non-exclusive distribution of the journal's published version of the work (e.g., post it to an institutional repository or publish it in a book), with an acknowledgement of its initial publication in this journal.
- Authors are permitted and encouraged to post their work online (e.g., in institutional repositories or on their website) prior to and during the submission process, as it can lead to productive exchanges, as well as earlier and greater citation of published work (See The Effect of Open Access).